| Param | Original file | Final file |
|---|---|---|
| Filename | modeM0/AS1A12_018T01_9000005488_39637cztM0_level2.fits | modeM0/AS1A12_018T01_9000005488_39637cztM0_level2_quad_clean.evt |
| Size (bytes) | 337,389,120 | 86,466,240 |
| Size | 321.8 MB | 82.5 MB |
| Events in quadrant A | 3,138,231 | 574,658 |
| Events in quadrant B | 2,384,468 | 597,615 |
| Events in quadrant C | 4,165,849 | 559,096 |
| Events in quadrant D | 2,411,928 | 536,855 |
| Mode SS | |||
|---|---|---|---|
| Quadrant | BADHDUFLAG | Total packets | Discarded packets |
| A | 0 | 102 | 0 |
| B | 0 | 102 | 0 |
| C | 0 | 102 | 0 |
| D | 0 | 102 | 0 |
| Mode M0 | |||
|---|---|---|---|
| Quadrant | BADHDUFLAG | Total packets | Discarded packets |
| A | 0 | 12469 | 3 |
| B | 0 | 10629 | 2 |
| C | 0 | 15740 | 2 |
| D | 0 | 10809 | 2 |
| Mode M9 | |||
|---|---|---|---|
| Quadrant | BADHDUFLAG | Total packets | Discarded packets |
| A | 0 | 32 | 0 |
| B | 0 | 32 | 0 |
| C | 0 | 32 | 0 |
| D | 0 | 33 | 0 |
| Quadrant | Total seconds | Saturated seconds | Saturation percentage |
|---|---|---|---|
| A | 4992 | 116 | 2.323718% |
| B | 4992 | 46 | 0.921474% |
| C | 4992 | 250 | 5.008013% |
| D | 4992 | 17 | 0.340545% |
Noise dominated data is calculated using 1-second bins in cleaned event files. If a bin has >2000 counts, and if more than 50% of those come from <1% of pixels, then it is considered to be noise-dominated and hence unusable.
| Quadrant | # 1 sec bins | Bins with >0 counts | Bins with >2000 counts | High rate bins dominated by noise | Noise dominated (total time) | Noise dominated (detector-on time) | Marked lightcurve |
|---|---|---|---|---|---|---|---|
| A | 7055 | 4993 | 84 | 84 | 1.19% | 1.68% | 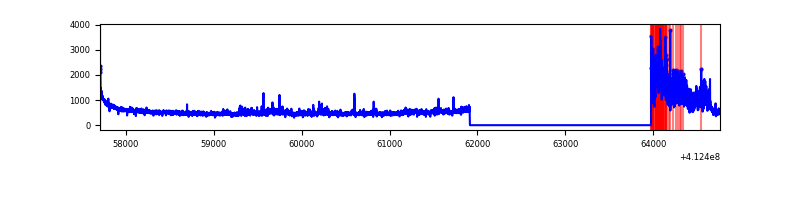 |
| B | 7055 | 4993 | 19 | 19 | 0.27% | 0.38% | 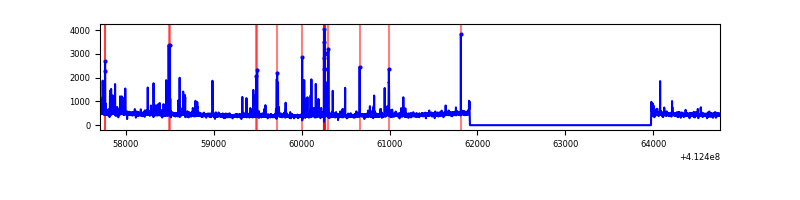 |
| C | 7055 | 4993 | 248 | 248 | 3.52% | 4.97% | 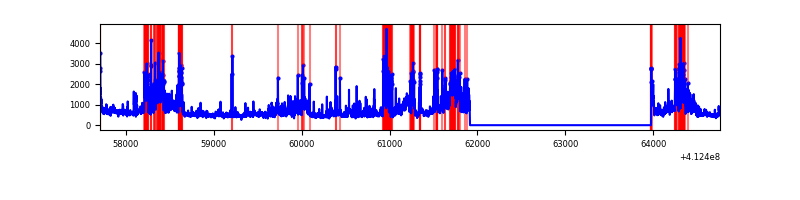 |
| D | 7055 | 4993 | 19 | 19 | 0.27% | 0.38% | 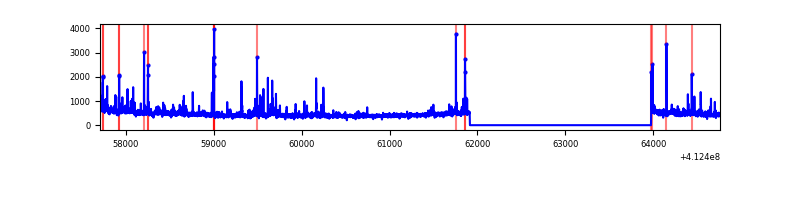 |
Top three noisy pixels from each quadrant. If the there are fewer than three noisy pixels in the level2.evt file, extra rows are filled as -1
| Pixel properties | Quadrant properties | ||||||
|---|---|---|---|---|---|---|---|
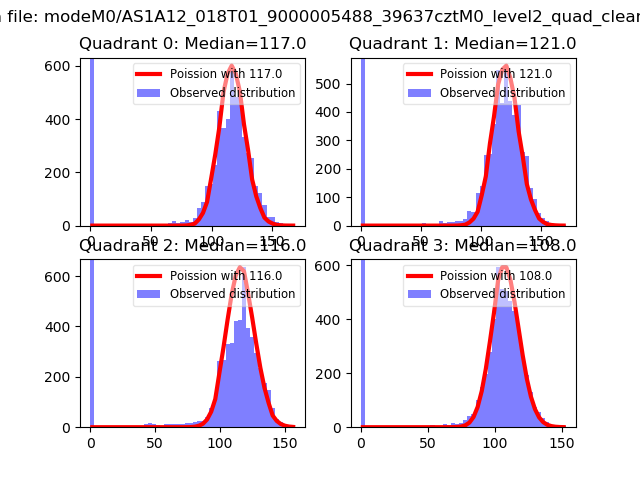
| Quadrant | DetID | PixID | Counts | Sigma | Mean | Median | Sigma |
| A | 15 | 222 | 624425 | 5670.6 | 537 | 528 | 110.0 |
| A | 10 | 83 | 418681 | 3800.59 | 537 | 528 | 110.0 |
| A | 13 | 254 | 7528 | 63.62 | 537 | 528 | 110.0 |
| B | 5 | 172 | 157864 | 1533.23 | 540 | 525 | 102.6 |
| B | 5 | 255 | 83172 | 805.37 | 540 | 525 | 102.6 |
| B | 12 | 111 | 12641 | 118.07 | 540 | 525 | 102.6 |
| C | 9 | 187 | 1425089 | 11572.42 | 528 | 531 | 123.1 |
| C | 15 | 208 | 427958 | 3472.21 | 528 | 531 | 123.1 |
| C | 15 | 214 | 207390 | 1680.42 | 528 | 531 | 123.1 |
| D | 13 | 249 | 107815 | 821.87 | 534 | 519 | 130.6 |
| D | 1 | 52 | 78784 | 599.49 | 534 | 519 | 130.6 |
| D | 12 | 0 | 53240 | 403.83 | 534 | 519 | 130.6 |
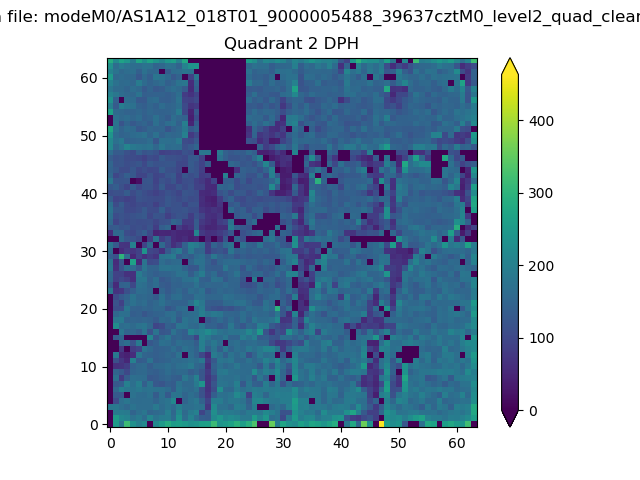
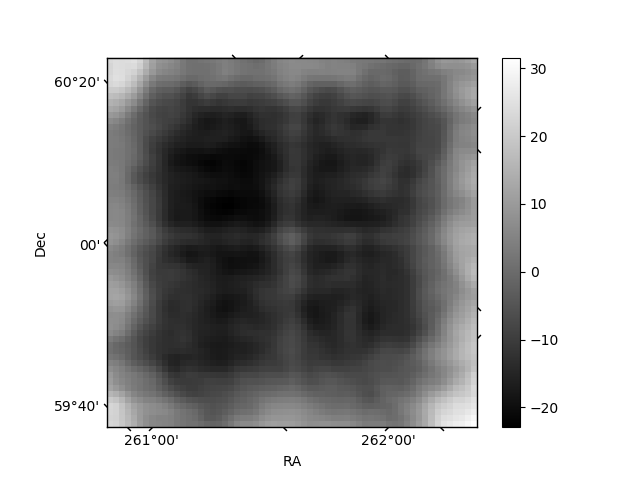
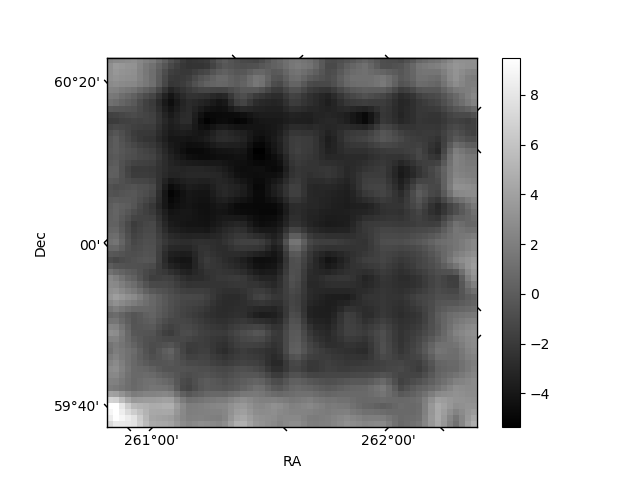
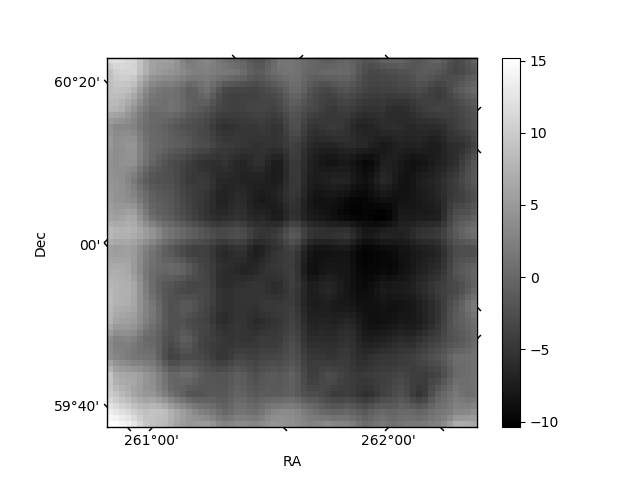
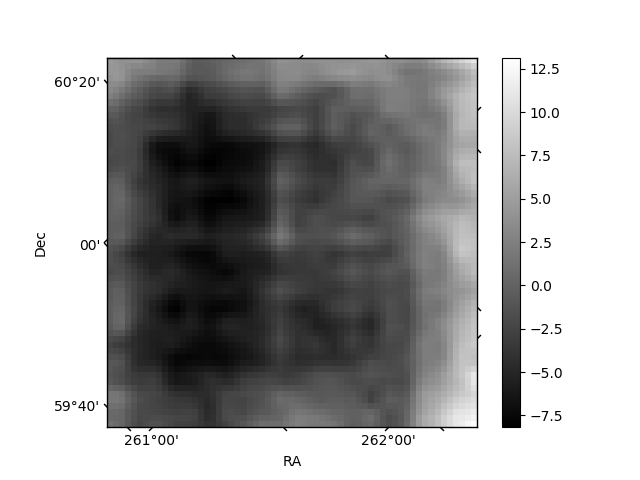
Histogram calculated using DETX and DETY for each event in the final _common_clean file
| Quadrant A | 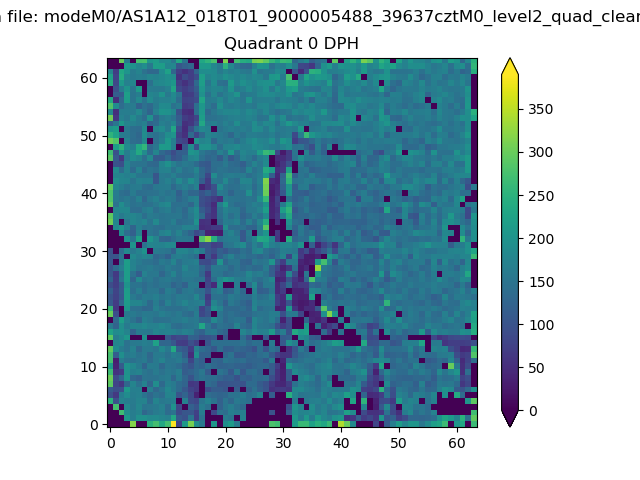 |
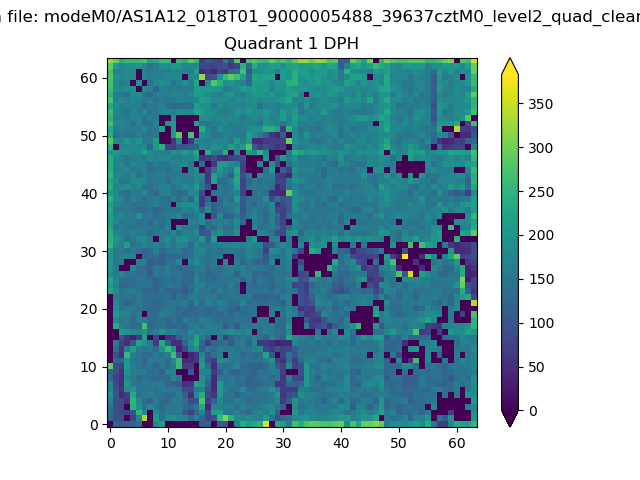 |
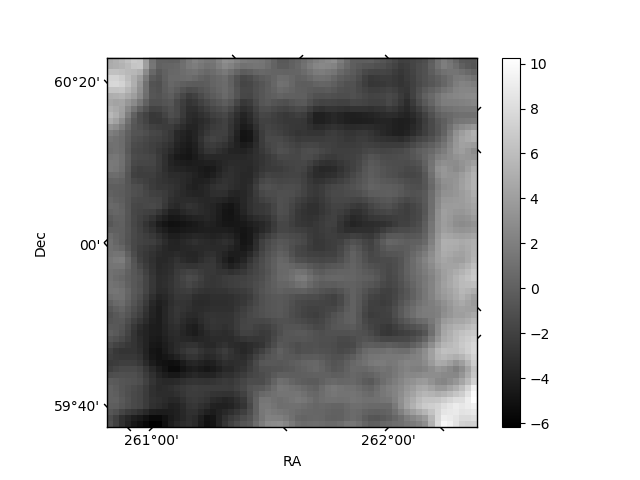
Quadrant B |
|---|---|---|---|
| Quadrant D | 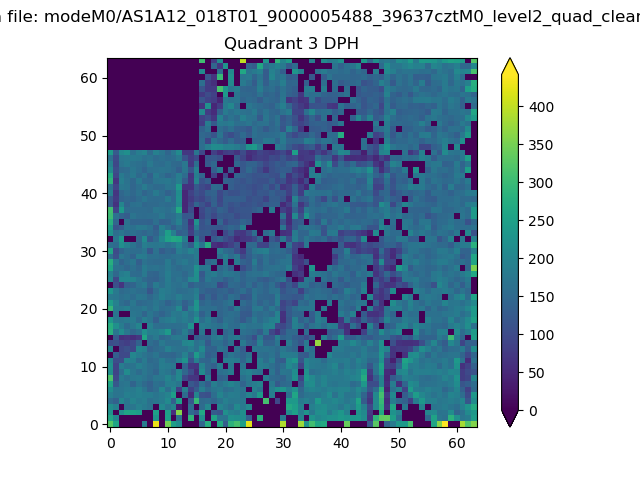 |
 |
Quadrant C |
| Plot type | Count rate plots | Images |
|---|---|---|
| Comparison with Poisson distribution Blue bars denote a histogram of data divided into 1 sec bins. Red curve is a Poisson curve with rate = median count rate of data. |
 |
 |
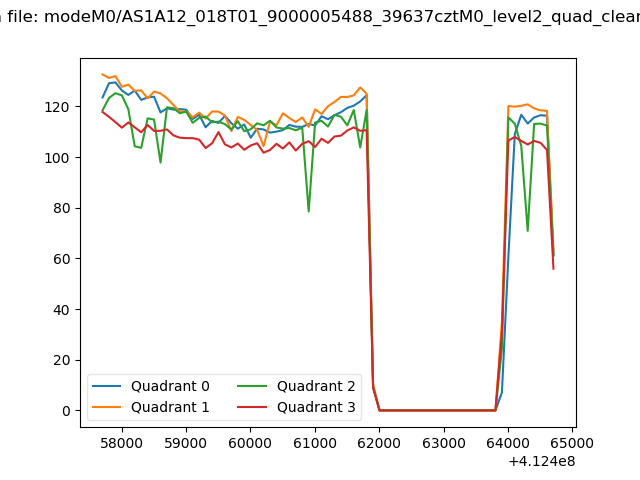
| Quadrant-wise count rates Data is divided into 100 sec bins |
 |
|
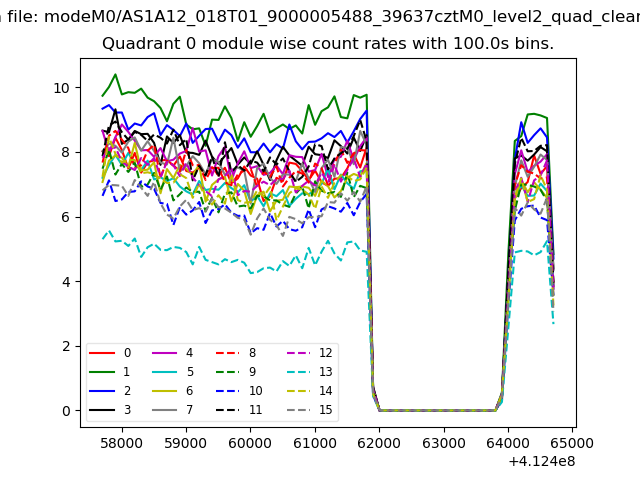
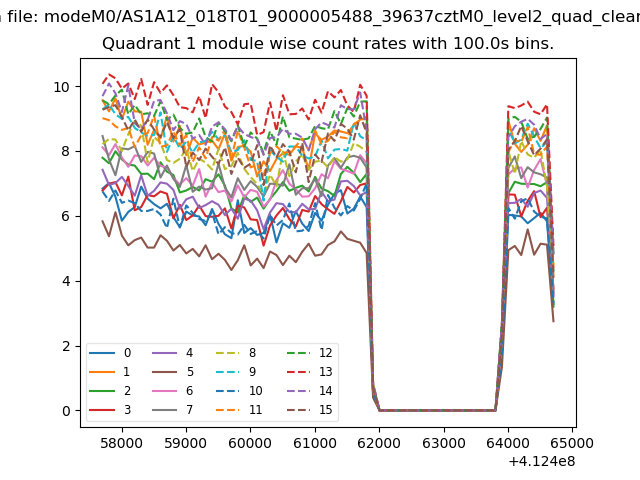
| Module-wise count rates for Quadrant A Data is divided into 100 sec bins |
 |
 |
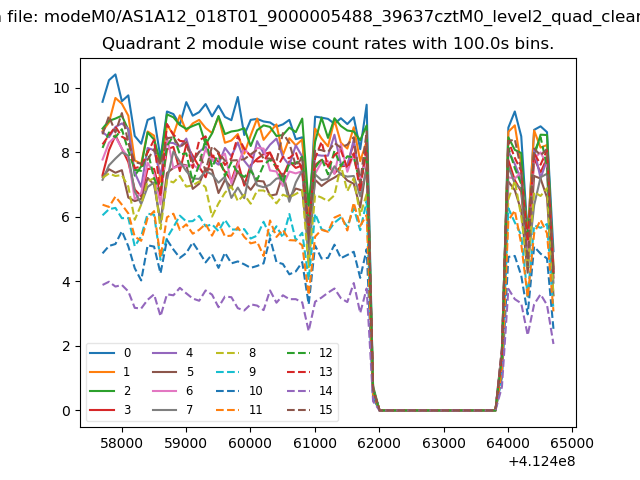
| Module-wise count rates for Quadrant B Data is divided into 100 sec bins |
 |
 |
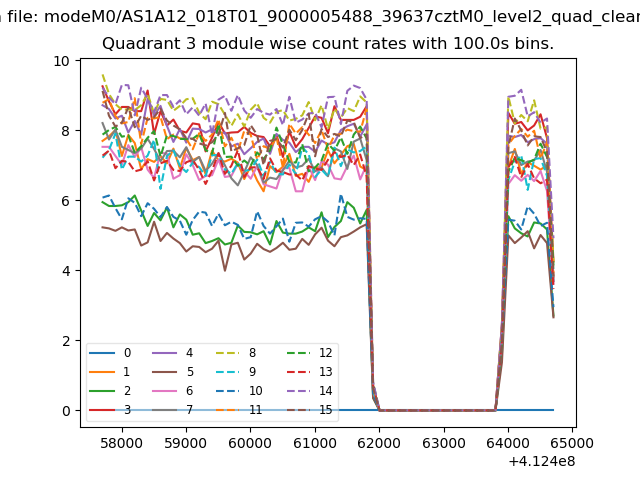
| Module-wise count rates for Quadrant C Data is divided into 100 sec bins |
 |
 |
| Module-wise count rates for Quadrant D Data is divided into 100 sec bins |
 |
 |
| Parameter | Plot |
|---|---|
| CZT HV Monitor | 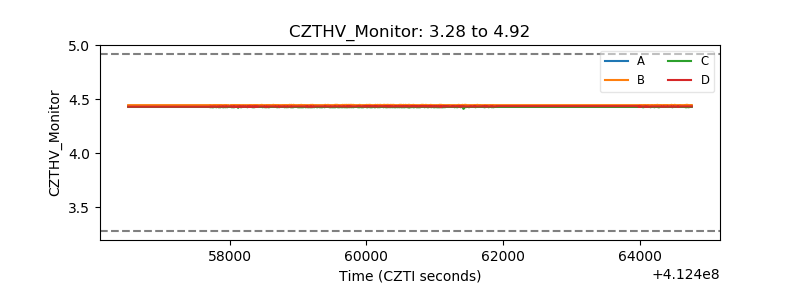 |
| D_VDD | 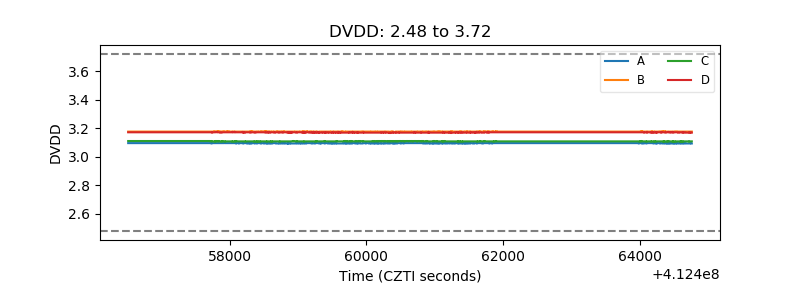 |
| Temperature 1 | 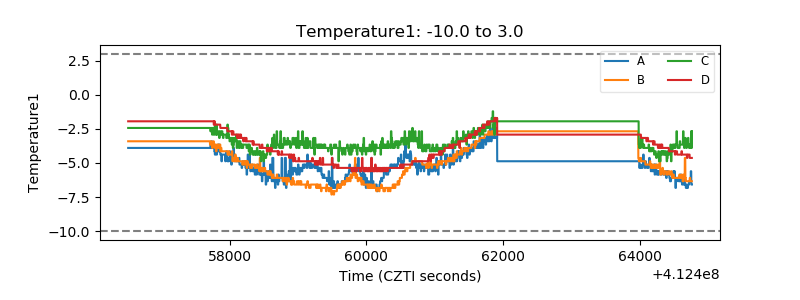 |
| Veto HV Monitor | 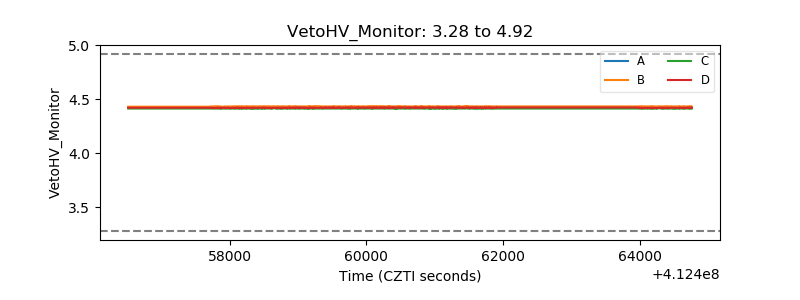 |
| Veto LLD | 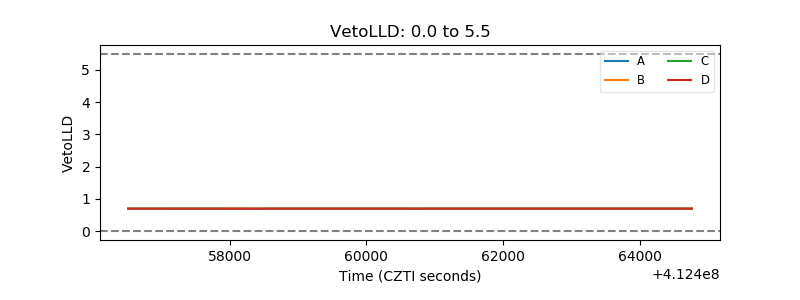 |
| Alpha Counter | 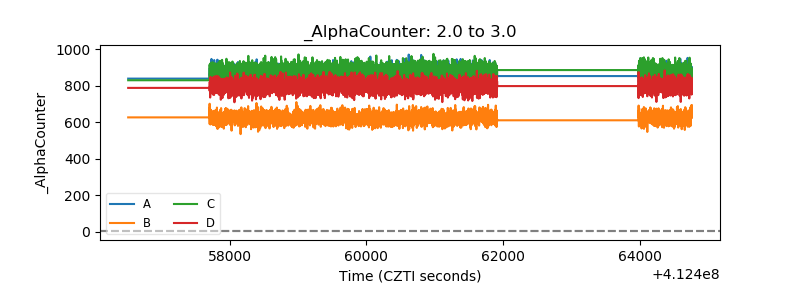 |
| _CPM_Rate | 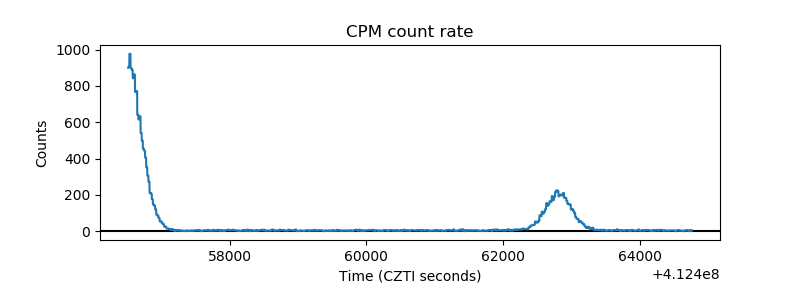 |
| CZT Counter | 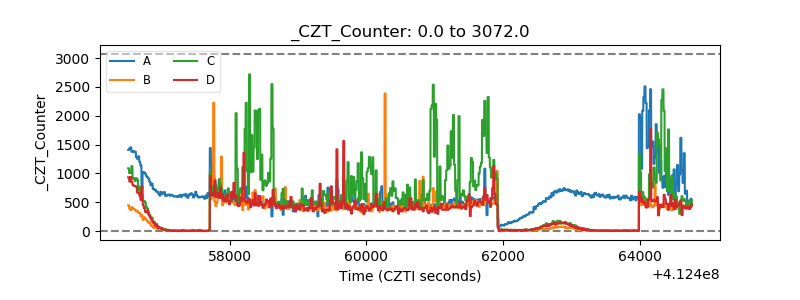 |
| +2.5 Volts monitor | 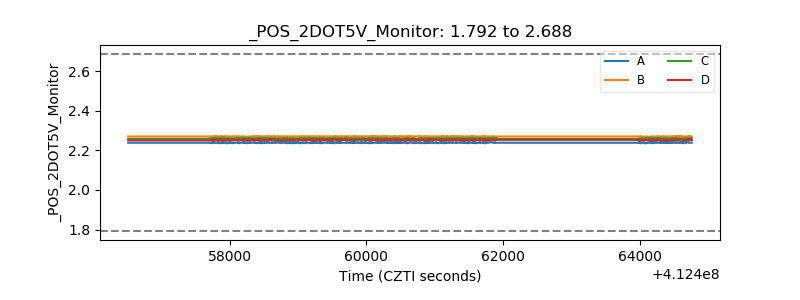 |
| +5 Volts monitor | 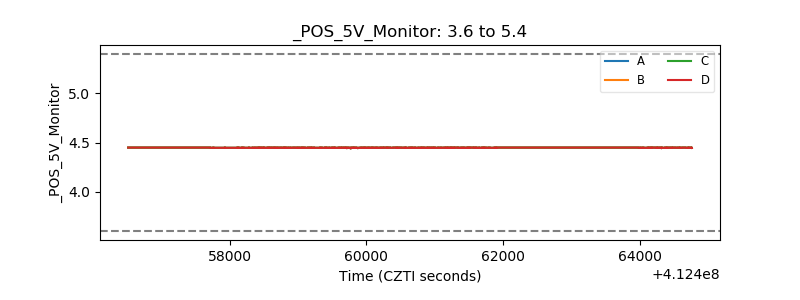 |
| _ROLL_ROT | 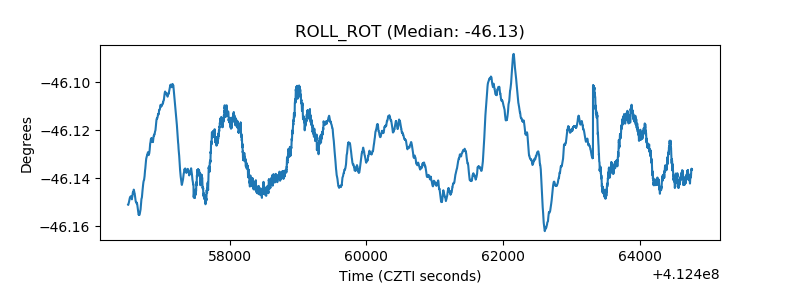 |
| _Roll_DEC | 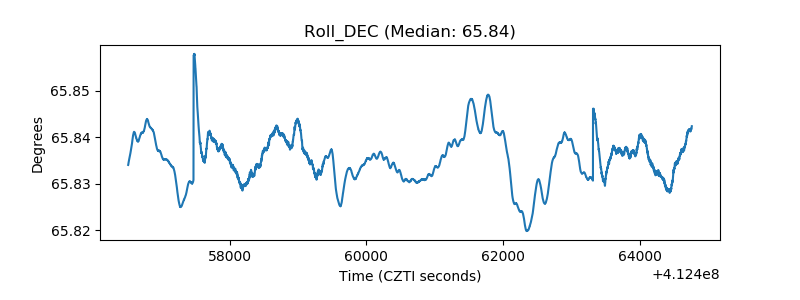 |
| _Roll_RA | 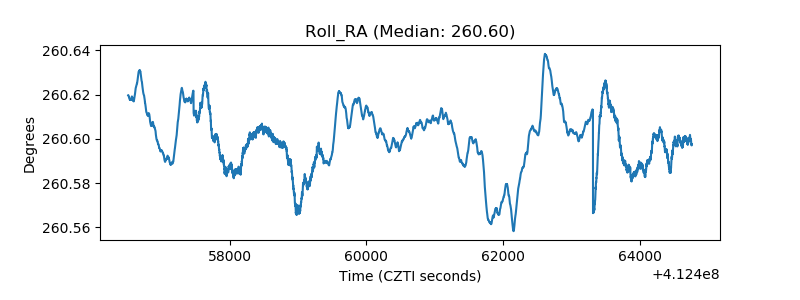 |
| Veto Counter | 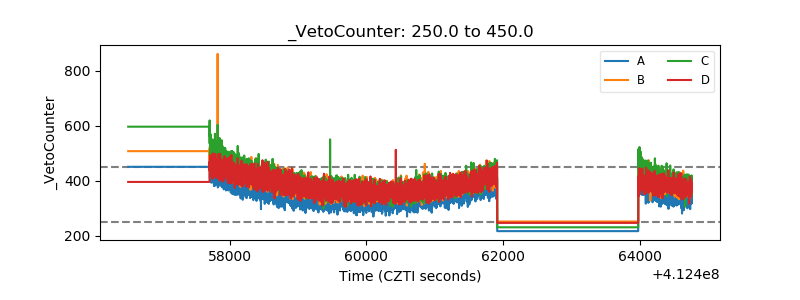 |