| Param | Original file | Final file |
|---|---|---|
| Filename | modeM0/AS1A12_018T01_9000005488_39638cztM0_level2.fits | modeM0/AS1A12_018T01_9000005488_39638cztM0_level2_quad_clean.evt |
| Size (bytes) | 384,834,240 | 85,760,640 |
| Size | 367.0 MB | 81.8 MB |
| Events in quadrant A | 3,765,834 | 570,017 |
| Events in quadrant B | 2,330,014 | 594,256 |
| Events in quadrant C | 4,333,862 | 551,084 |
| Events in quadrant D | 3,413,633 | 518,869 |
| Mode SS | |||
|---|---|---|---|
| Quadrant | BADHDUFLAG | Total packets | Discarded packets |
| A | 0 | 106 | 0 |
| B | 0 | 106 | 0 |
| C | 0 | 106 | 0 |
| D | 0 | 106 | 0 |
| Mode M0 | |||
|---|---|---|---|
| Quadrant | BADHDUFLAG | Total packets | Discarded packets |
| A | 0 | 14520 | 3 |
| B | 0 | 10714 | 2 |
| C | 0 | 16392 | 2 |
| D | 0 | 13894 | 2 |
| Mode M9 | |||
|---|---|---|---|
| Quadrant | BADHDUFLAG | Total packets | Discarded packets |
| A | 0 | 30 | 0 |
| B | 0 | 30 | 0 |
| C | 0 | 30 | 0 |
| D | 0 | 31 | 0 |
| Quadrant | Total seconds | Saturated seconds | Saturation percentage |
|---|---|---|---|
| A | 5173 | 124 | 2.397062% |
| B | 5173 | 11 | 0.212643% |
| C | 5173 | 281 | 5.432051% |
| D | 5173 | 206 | 3.982215% |
Noise dominated data is calculated using 1-second bins in cleaned event files. If a bin has >2000 counts, and if more than 50% of those come from <1% of pixels, then it is considered to be noise-dominated and hence unusable.
| Quadrant | # 1 sec bins | Bins with >0 counts | Bins with >2000 counts | High rate bins dominated by noise | Noise dominated (total time) | Noise dominated (detector-on time) | Marked lightcurve |
|---|---|---|---|---|---|---|---|
| A | 6966 | 5174 | 90 | 90 | 1.29% | 1.74% | 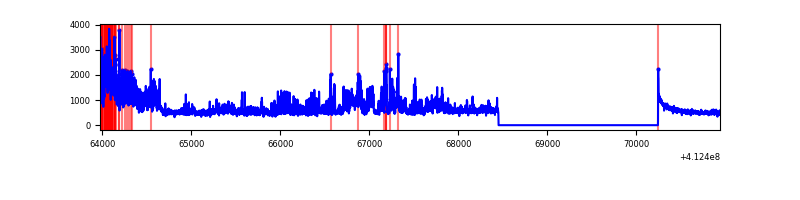 |
| B | 6966 | 5174 | 4 | 4 | 0.06% | 0.08% | 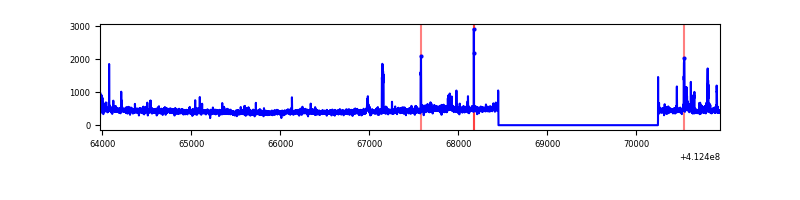 |
| C | 6966 | 5174 | 283 | 283 | 4.06% | 5.47% | 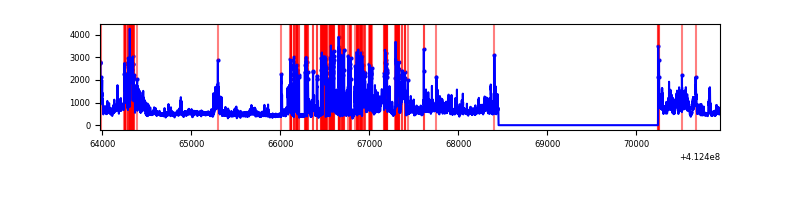 |
| D | 6966 | 5173 | 178 | 178 | 2.56% | 3.44% | 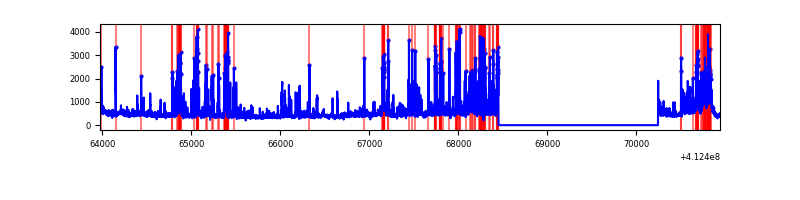 |
Top three noisy pixels from each quadrant. If the there are fewer than three noisy pixels in the level2.evt file, extra rows are filled as -1
| Pixel properties | Quadrant properties | ||||||
|---|---|---|---|---|---|---|---|
| Quadrant | DetID | PixID | Counts | Sigma | Mean | Median | Sigma |
| A | 15 | 222 | 1227310 | 11108.13 | 544 | 534 | 110.4 |
| A | 10 | 83 | 409976 | 3707.39 | 544 | 534 | 110.4 |
| A | 6 | 10 | 7045 | 58.96 | 544 | 534 | 110.4 |
| B | 4 | 251 | 109777 | 1037.53 | 547 | 531 | 105.3 |
| B | 5 | 255 | 30537 | 284.97 | 547 | 531 | 105.3 |
| B | 5 | 172 | 20413 | 188.82 | 547 | 531 | 105.3 |
| C | 9 | 187 | 1007263 | 8071.37 | 531 | 536 | 124.7 |
| C | 15 | 208 | 985446 | 7896.45 | 531 | 536 | 124.7 |
| C | 15 | 214 | 213637 | 1708.52 | 531 | 536 | 124.7 |
| D | 13 | 249 | 707864 | 5500.94 | 529 | 514 | 128.6 |
| D | 2 | 250 | 325368 | 2526.33 | 529 | 514 | 128.6 |
| D | 12 | 0 | 125688 | 973.46 | 529 | 514 | 128.6 |
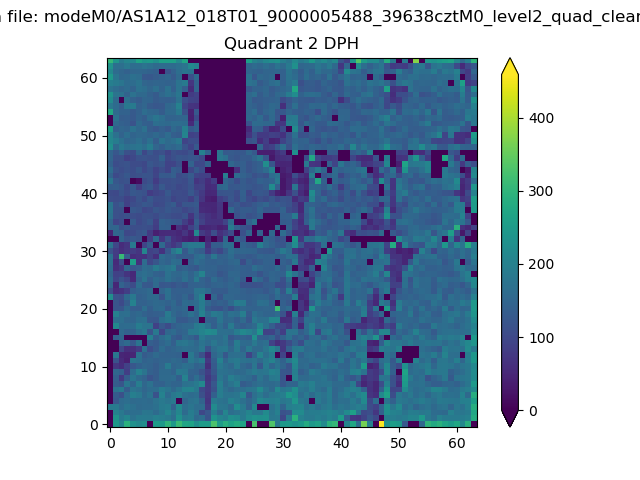
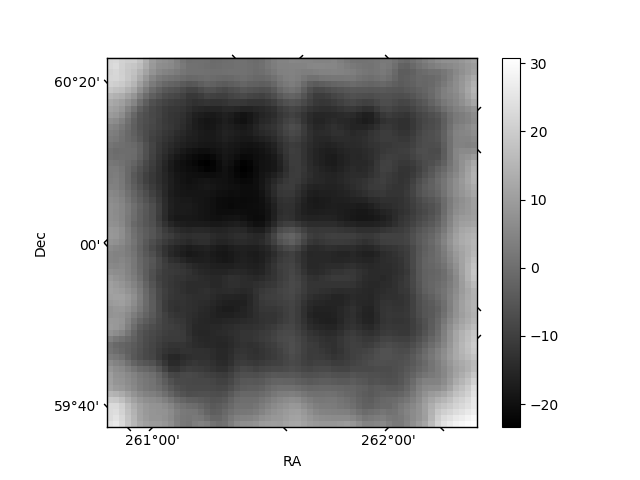
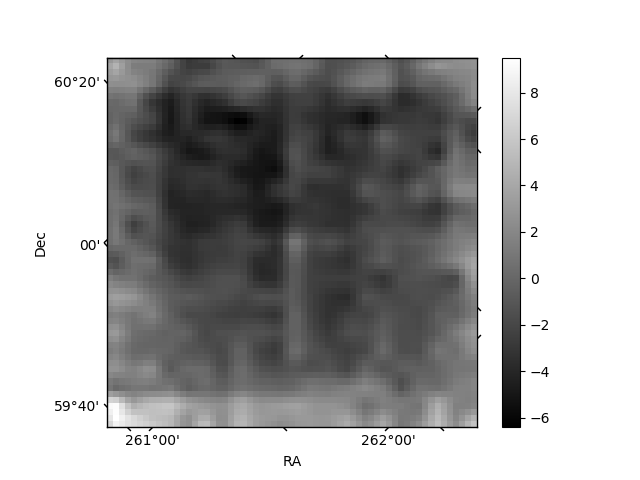
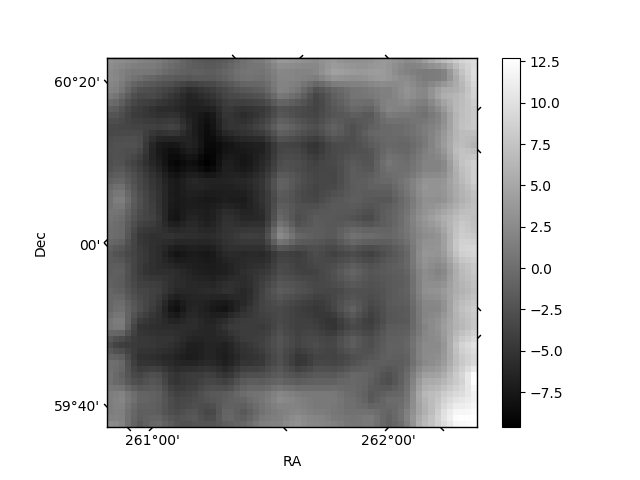
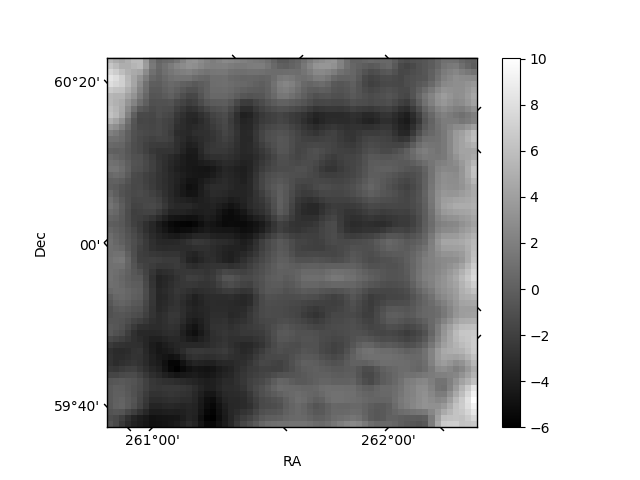
Histogram calculated using DETX and DETY for each event in the final _common_clean file
| Quadrant A | 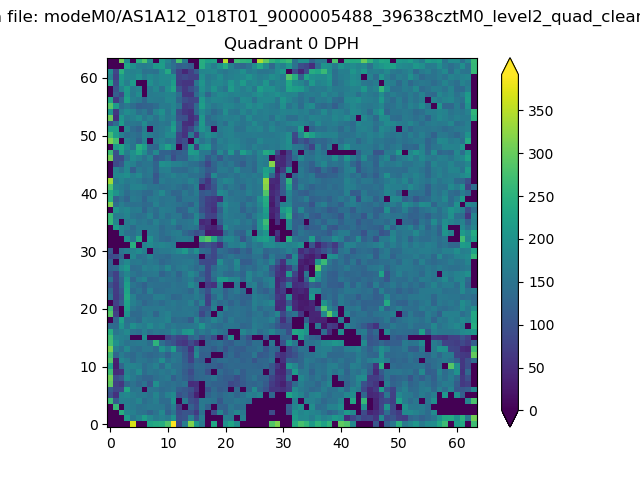 |
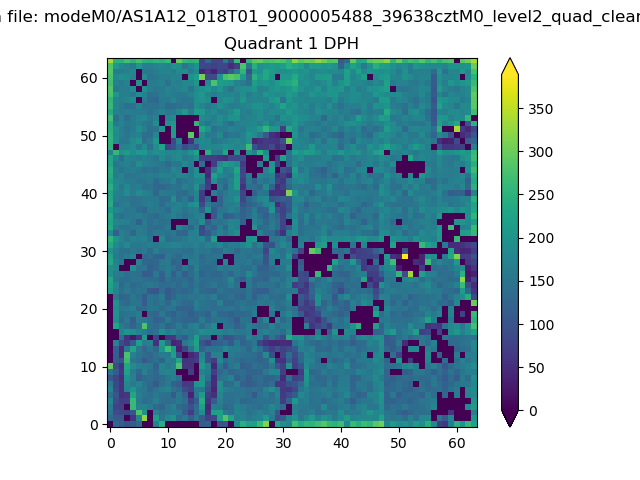 |
Quadrant B |
|---|---|---|---|
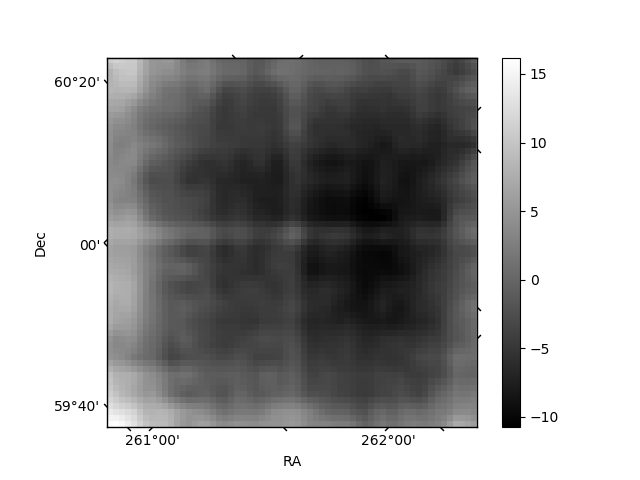
| Quadrant D | 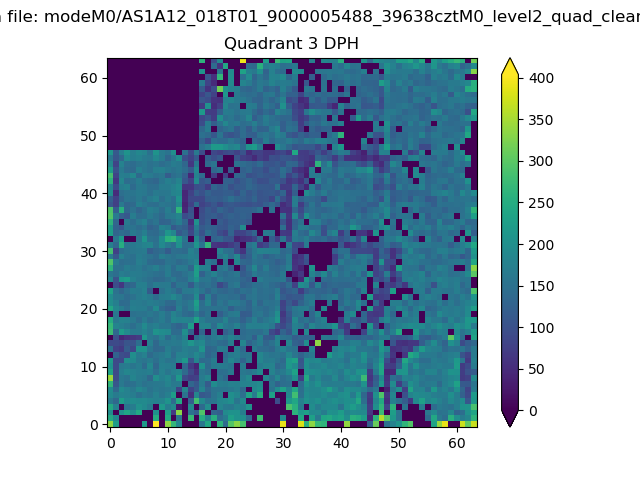 |
 |
Quadrant C |
| Plot type | Count rate plots | Images |
|---|---|---|
| Comparison with Poisson distribution Blue bars denote a histogram of data divided into 1 sec bins. Red curve is a Poisson curve with rate = median count rate of data. |
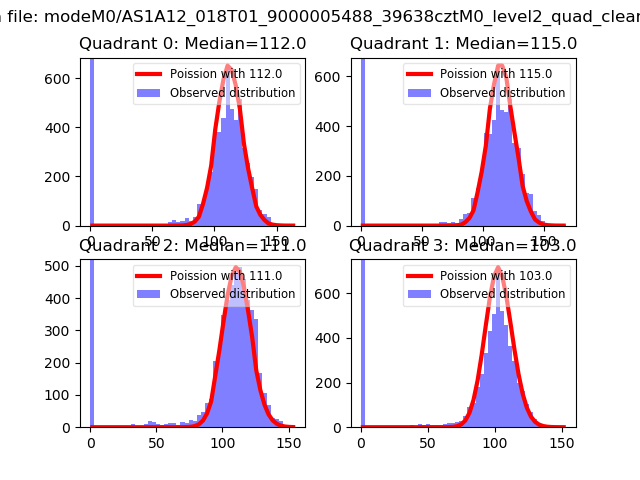 |
 |
| Quadrant-wise count rates Data is divided into 100 sec bins |
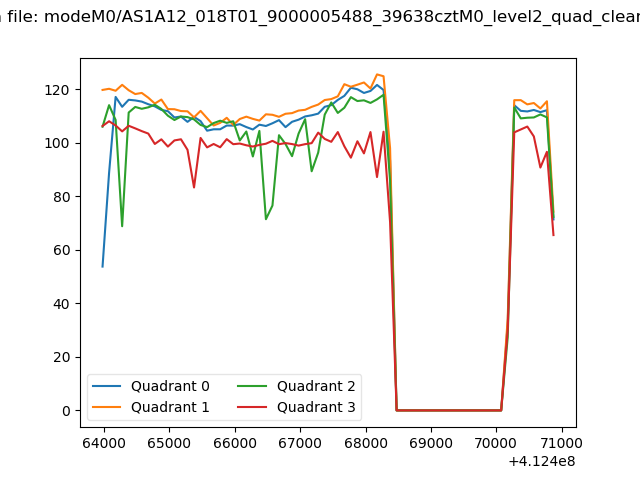 |
|
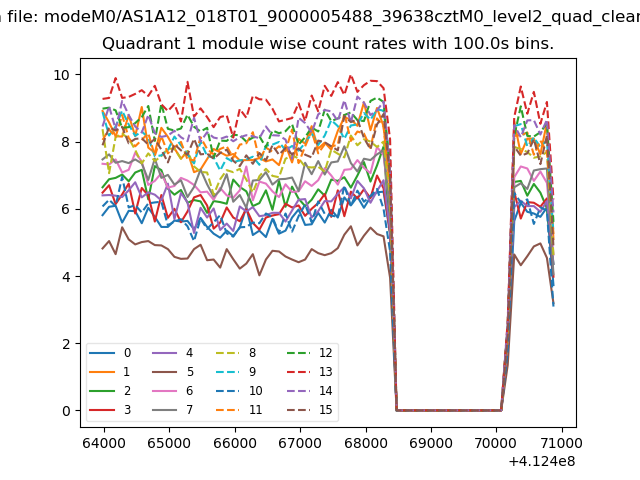
| Module-wise count rates for Quadrant A Data is divided into 100 sec bins |
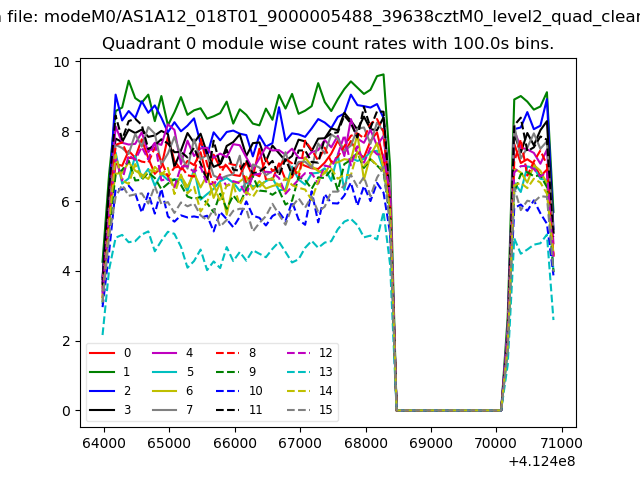 |
 |
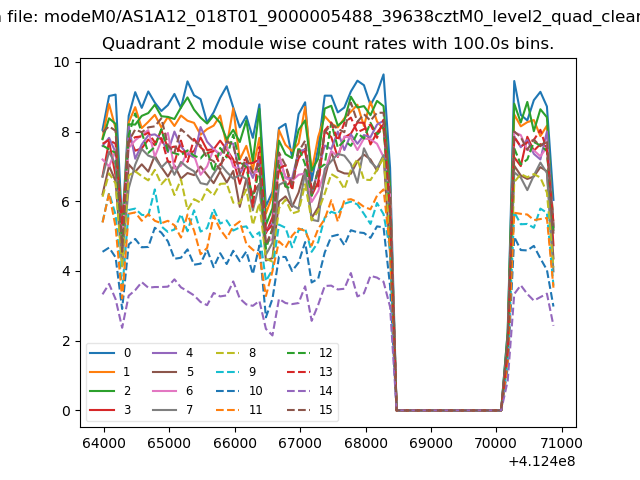
| Module-wise count rates for Quadrant B Data is divided into 100 sec bins |
 |
 |
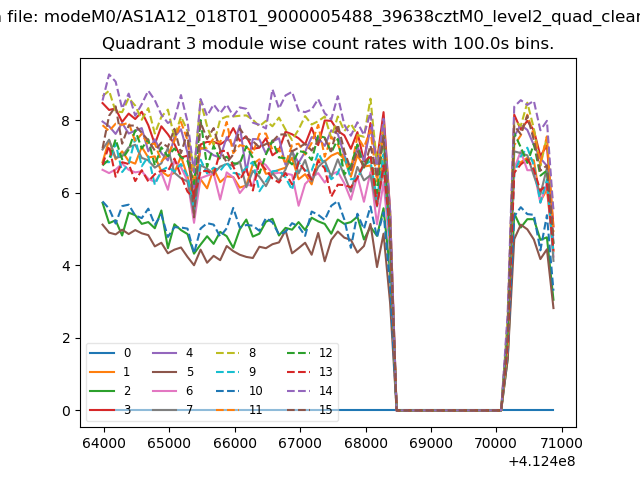
| Module-wise count rates for Quadrant C Data is divided into 100 sec bins |
 |
 |
| Module-wise count rates for Quadrant D Data is divided into 100 sec bins |
 |
 |
| Parameter | Plot |
|---|---|
| CZT HV Monitor | 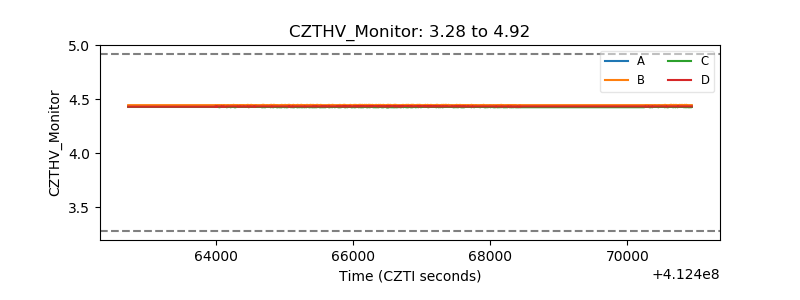 |
| D_VDD | 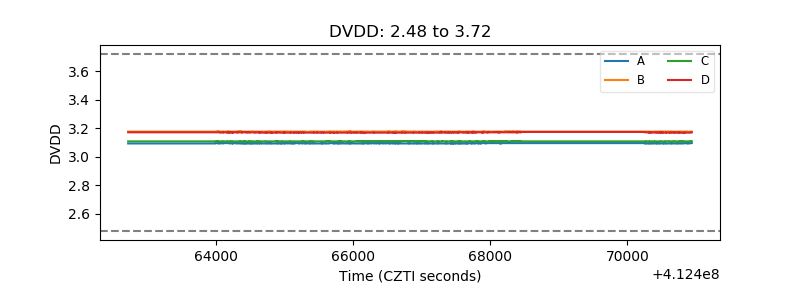 |
| Temperature 1 | 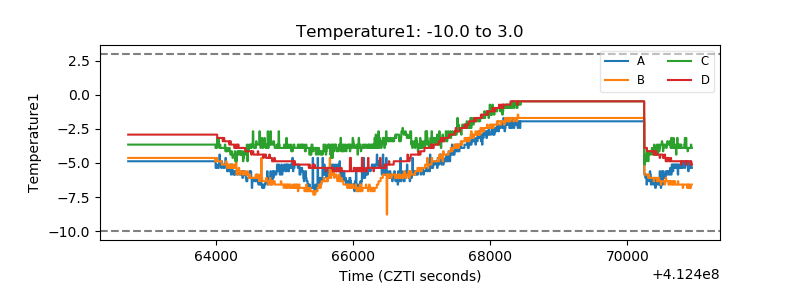 |
| Veto HV Monitor | 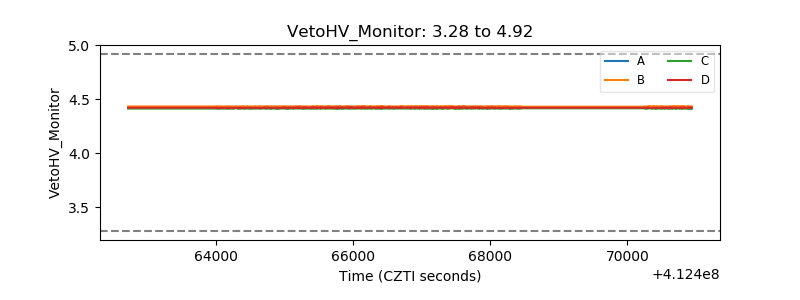 |
| Veto LLD | 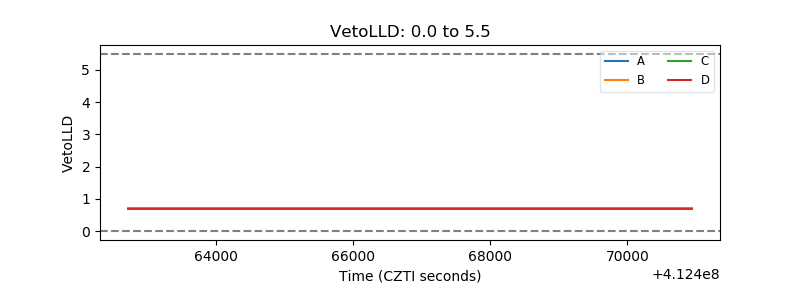 |
| Alpha Counter | 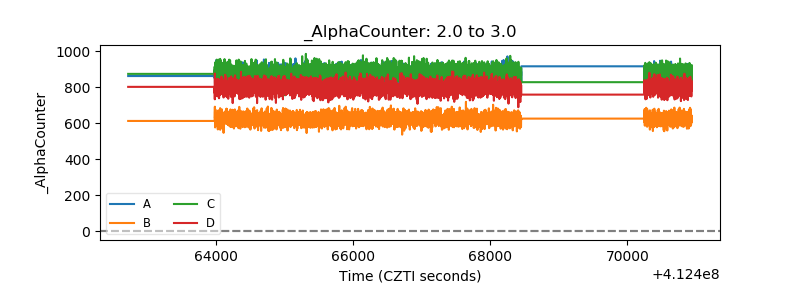 |
| _CPM_Rate | 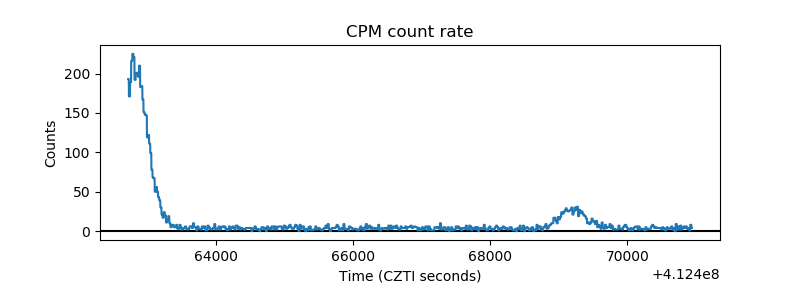 |
| CZT Counter | 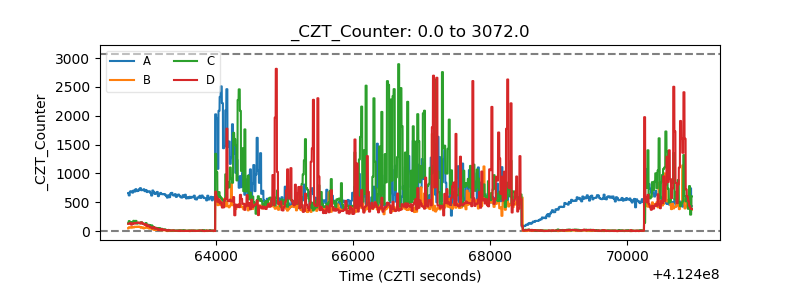 |
| +2.5 Volts monitor | 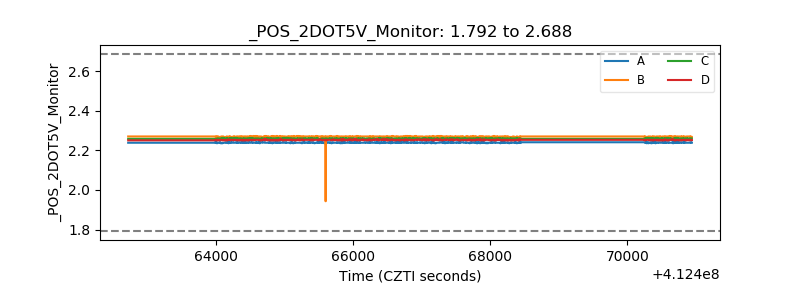 |
| +5 Volts monitor | 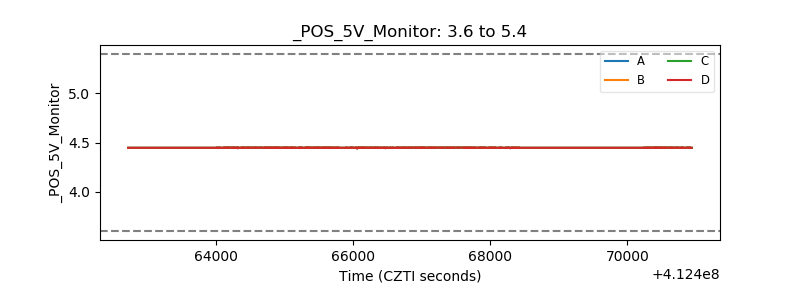 |
| _ROLL_ROT | 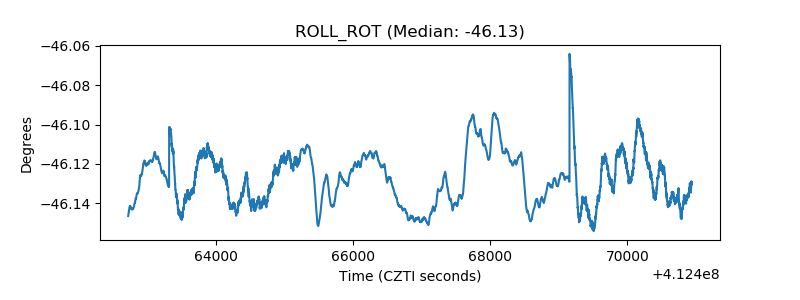 |
| _Roll_DEC | 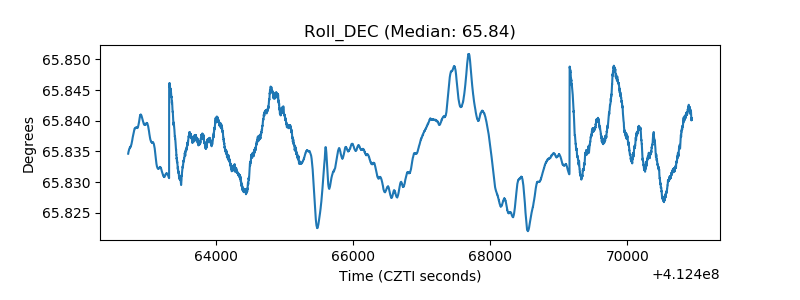 |
| _Roll_RA | 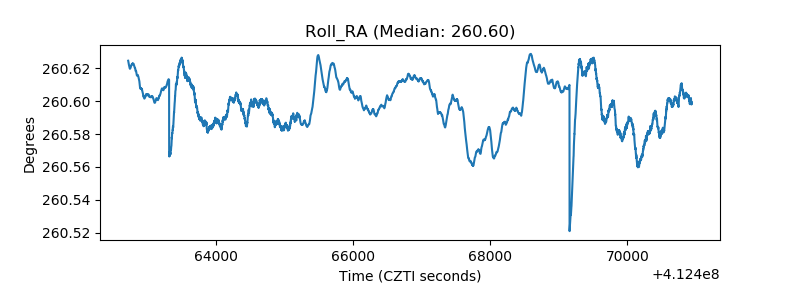 |
| Veto Counter | 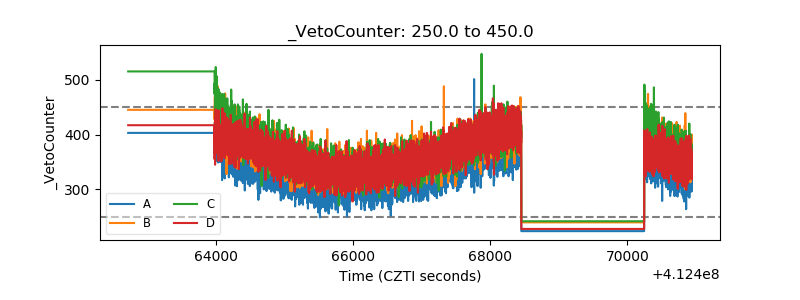 |