| Param | Original file | Final file |
|---|---|---|
| Filename | modeM0/AS1A12_018T01_9000005488_39639cztM0_level2.fits | modeM0/AS1A12_018T01_9000005488_39639cztM0_level2_quad_clean.evt |
| Size (bytes) | 379,604,160 | 95,054,400 |
| Size | 362.0 MB | 90.7 MB |
| Events in quadrant A | 3,515,926 | 626,970 |
| Events in quadrant B | 2,694,576 | 650,576 |
| Events in quadrant C | 4,010,524 | 622,661 |
| Events in quadrant D | 3,380,953 | 574,152 |
| Mode SS | |||
|---|---|---|---|
| Quadrant | BADHDUFLAG | Total packets | Discarded packets |
| A | 0 | 116 | 0 |
| B | 0 | 116 | 0 |
| C | 0 | 116 | 0 |
| D | 0 | 116 | 0 |
| Mode M0 | |||
|---|---|---|---|
| Quadrant | BADHDUFLAG | Total packets | Discarded packets |
| A | 0 | 14172 | 3 |
| B | 0 | 12248 | 2 |
| C | 0 | 15891 | 2 |
| D | 0 | 14301 | 2 |
| Mode M9 | |||
|---|---|---|---|
| Quadrant | BADHDUFLAG | Total packets | Discarded packets |
| A | 0 | 31 | 0 |
| B | 0 | 31 | 0 |
| C | 0 | 31 | 0 |
| D | 0 | 32 | 0 |
| Quadrant | Total seconds | Saturated seconds | Saturation percentage |
|---|---|---|---|
| A | 5782 | 143 | 2.473193% |
| B | 5782 | 35 | 0.605327% |
| C | 5782 | 111 | 1.919751% |
| D | 5782 | 114 | 1.971636% |
Noise dominated data is calculated using 1-second bins in cleaned event files. If a bin has >2000 counts, and if more than 50% of those come from <1% of pixels, then it is considered to be noise-dominated and hence unusable.
| Quadrant | # 1 sec bins | Bins with >0 counts | Bins with >2000 counts | High rate bins dominated by noise | Noise dominated (total time) | Noise dominated (detector-on time) | Marked lightcurve |
|---|---|---|---|---|---|---|---|
| A | 7245 | 5783 | 129 | 129 | 1.78% | 2.23% | 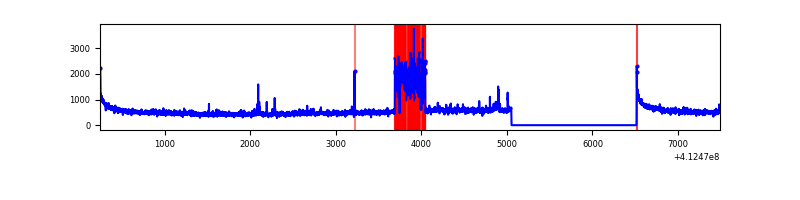 |
| B | 7245 | 5783 | 11 | 11 | 0.15% | 0.19% | 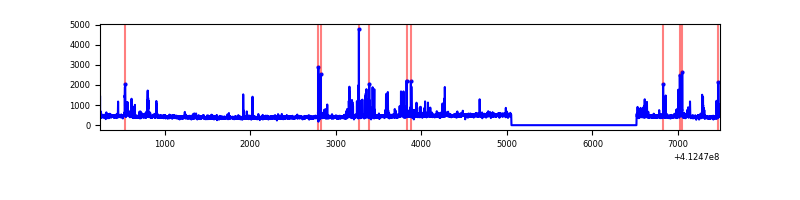 |
| C | 7245 | 5783 | 95 | 95 | 1.31% | 1.64% | 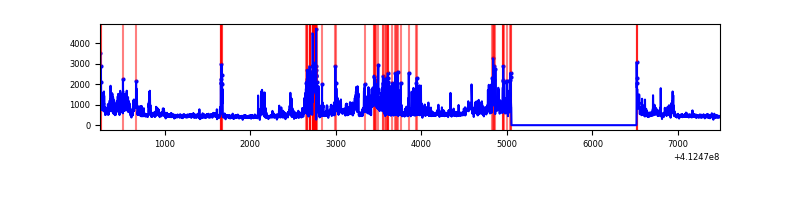 |
| D | 7245 | 5783 | 118 | 118 | 1.63% | 2.04% | 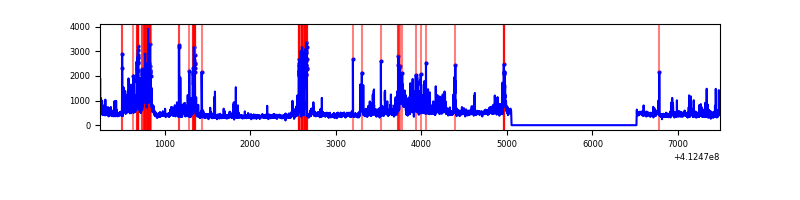 |
Top three noisy pixels from each quadrant. If the there are fewer than three noisy pixels in the level2.evt file, extra rows are filled as -1
| Pixel properties | Quadrant properties | ||||||
|---|---|---|---|---|---|---|---|
| Quadrant | DetID | PixID | Counts | Sigma | Mean | Median | Sigma |
| A | 15 | 222 | 671603 | 5379.6 | 610 | 596 | 124.7 |
| A | 10 | 83 | 461084 | 3691.82 | 610 | 596 | 124.7 |
| A | 7 | 3 | 12798 | 97.82 | 610 | 596 | 124.7 |
| B | 5 | 172 | 158929 | 1349.58 | 609 | 591 | 117.3 |
| B | 5 | 255 | 74517 | 630.1 | 609 | 591 | 117.3 |
| B | 4 | 251 | 39697 | 333.31 | 609 | 591 | 117.3 |
| C | 9 | 187 | 1025155 | 7338.84 | 597 | 601 | 139.6 |
| C | 15 | 208 | 396330 | 2834.59 | 597 | 601 | 139.6 |
| C | 15 | 214 | 236878 | 1692.44 | 597 | 601 | 139.6 |
| D | 2 | 250 | 300232 | 2048.71 | 595 | 576 | 146.3 |
| D | 13 | 249 | 272082 | 1856.25 | 595 | 576 | 146.3 |
| D | 12 | 227 | 224240 | 1529.16 | 595 | 576 | 146.3 |
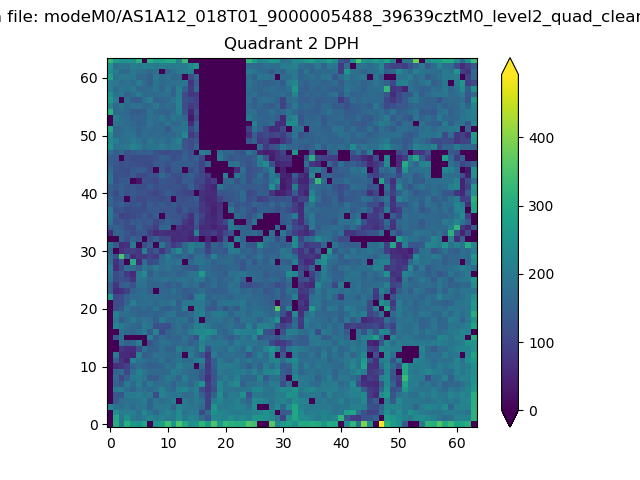
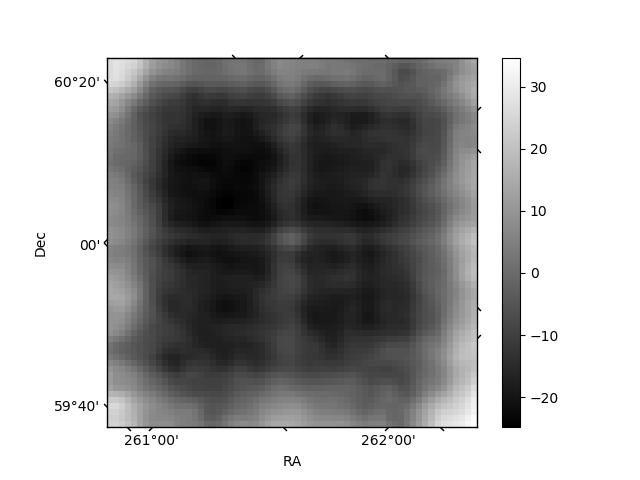
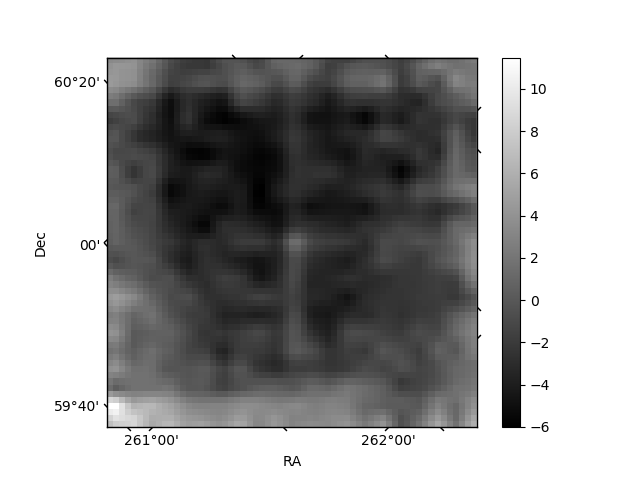
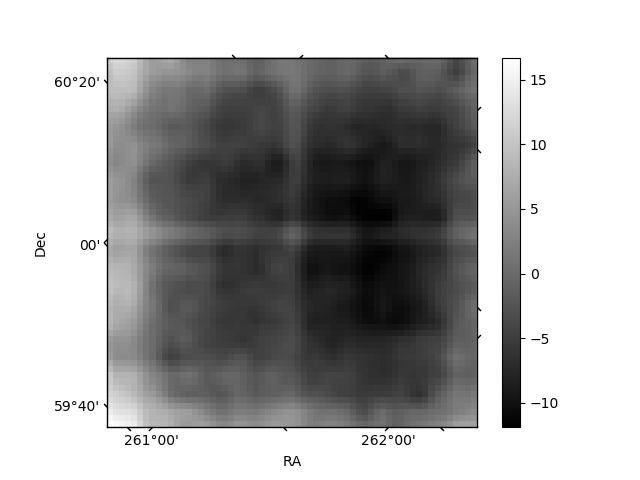
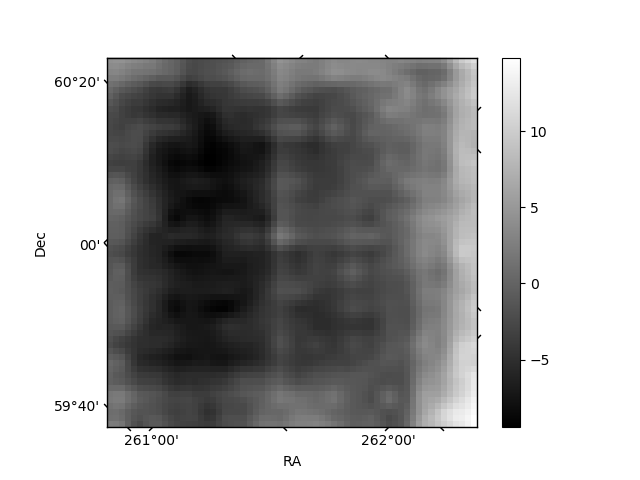
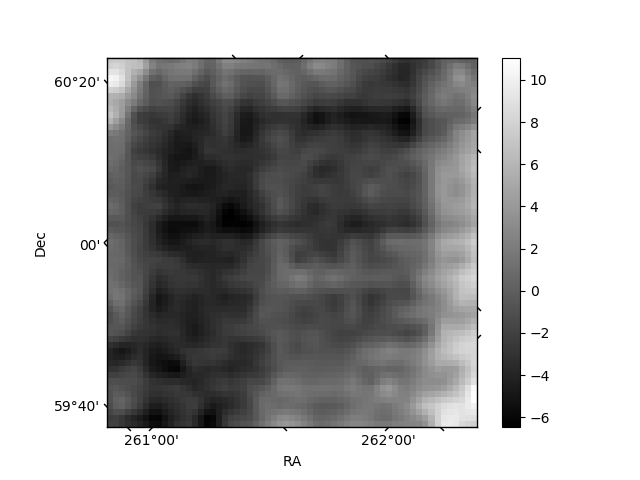
Histogram calculated using DETX and DETY for each event in the final _common_clean file
| Quadrant A | 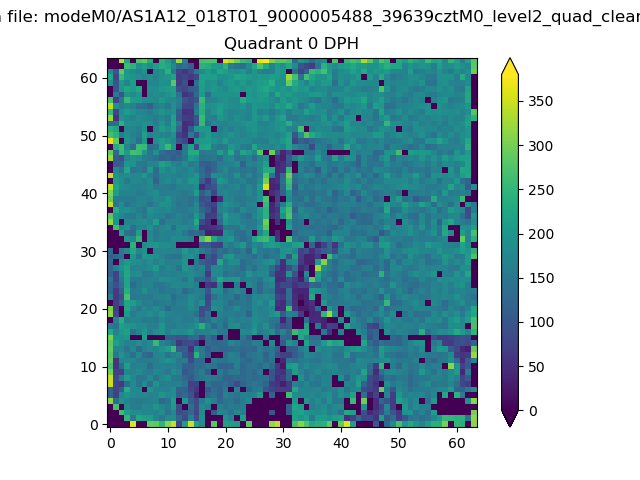 |
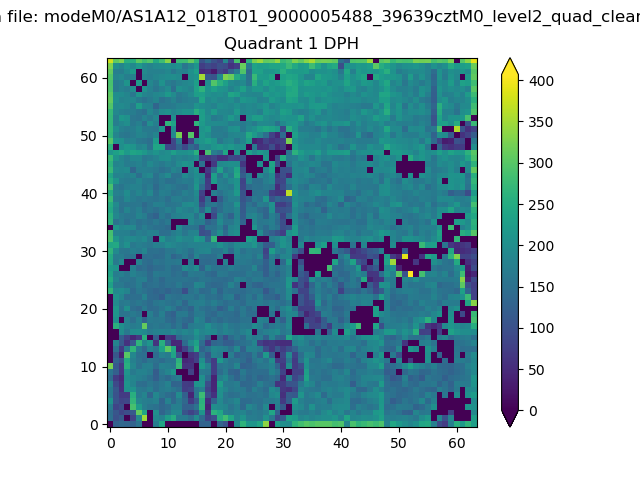 |
Quadrant B |
|---|---|---|---|
| Quadrant D | 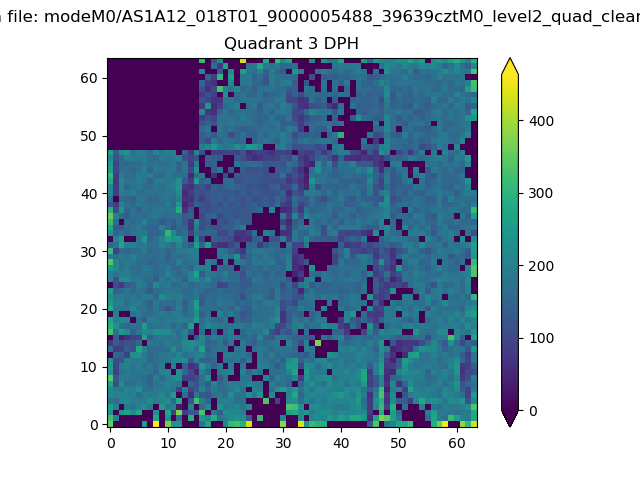 |
 |
Quadrant C |
| Plot type | Count rate plots | Images |
|---|---|---|
| Comparison with Poisson distribution Blue bars denote a histogram of data divided into 1 sec bins. Red curve is a Poisson curve with rate = median count rate of data. |
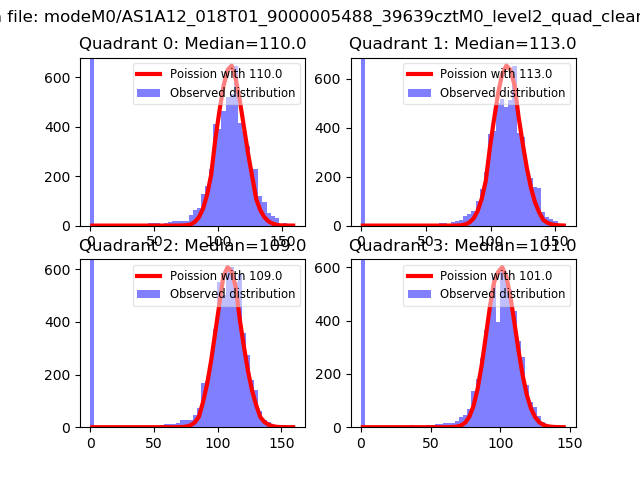 |
 |
| Quadrant-wise count rates Data is divided into 100 sec bins |
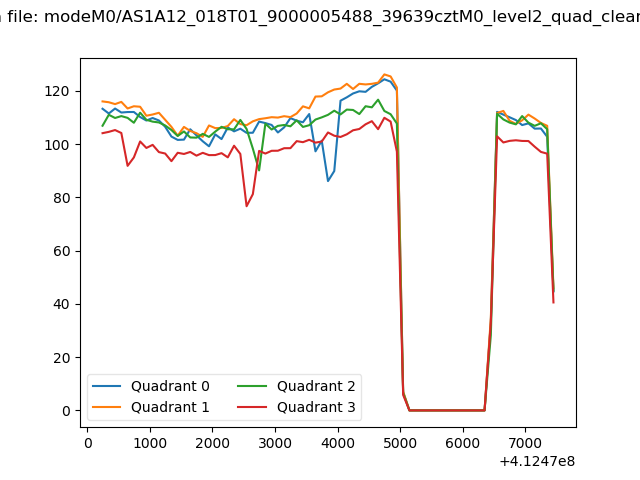 |
|
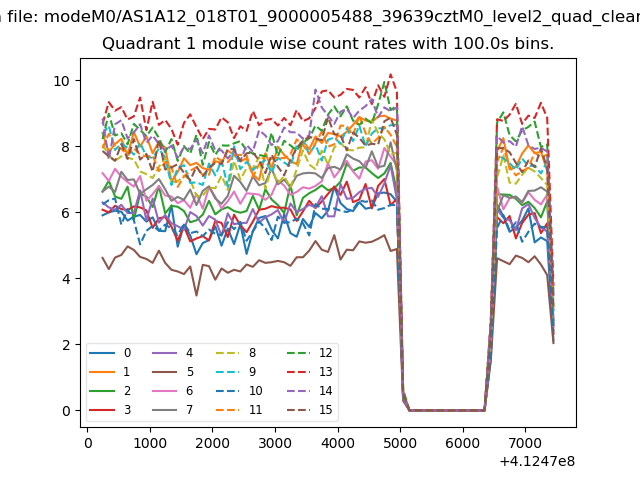
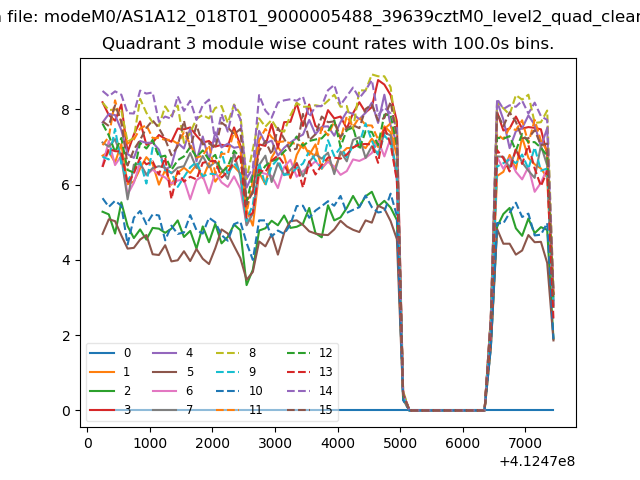
| Module-wise count rates for Quadrant A Data is divided into 100 sec bins |
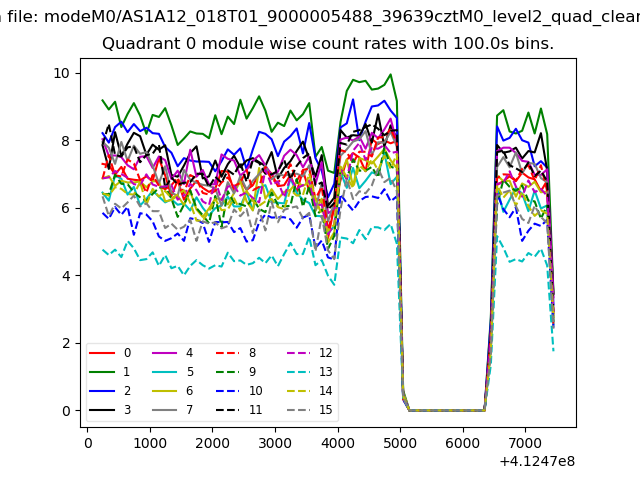 |
 |
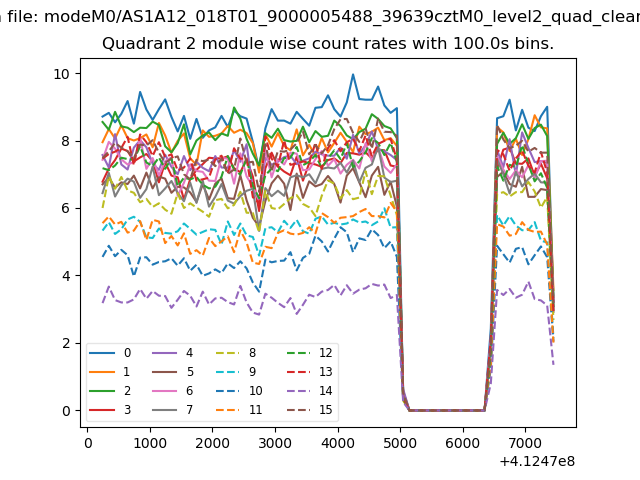
| Module-wise count rates for Quadrant B Data is divided into 100 sec bins |
 |
 |
| Module-wise count rates for Quadrant C Data is divided into 100 sec bins |
 |
 |
| Module-wise count rates for Quadrant D Data is divided into 100 sec bins |
 |
 |
| Parameter | Plot |
|---|---|
| CZT HV Monitor | 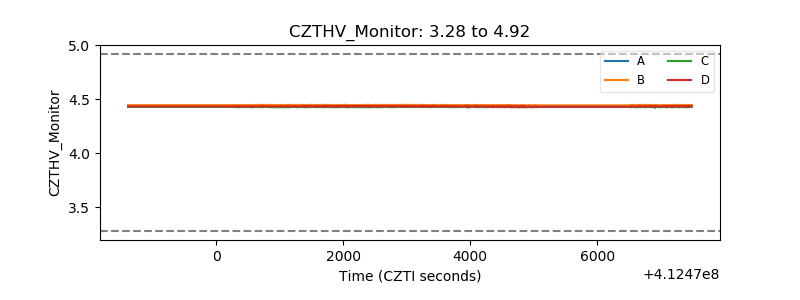 |
| D_VDD | 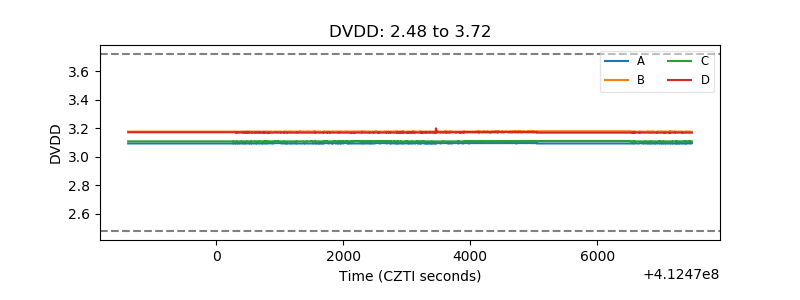 |
| Temperature 1 | 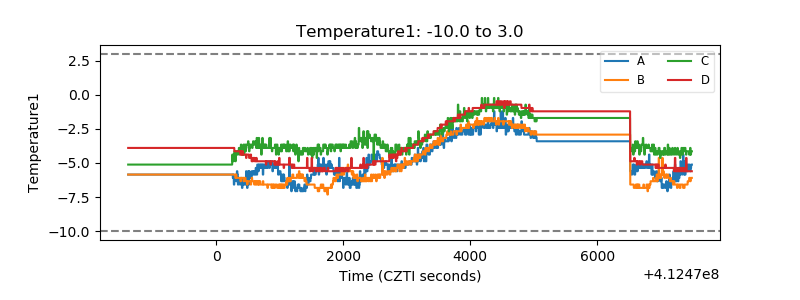 |
| Veto HV Monitor | 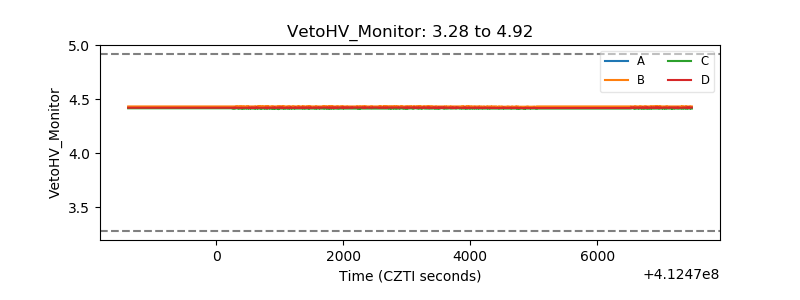 |
| Veto LLD | 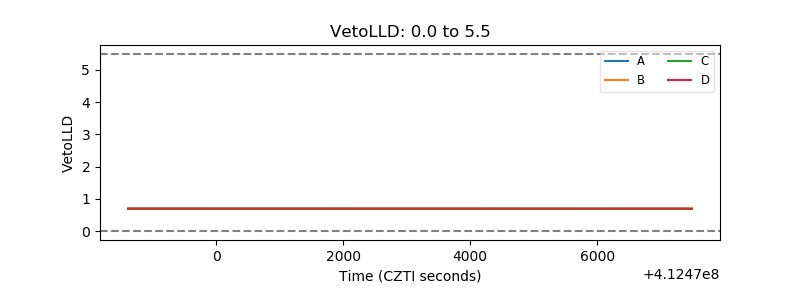 |
| Alpha Counter | 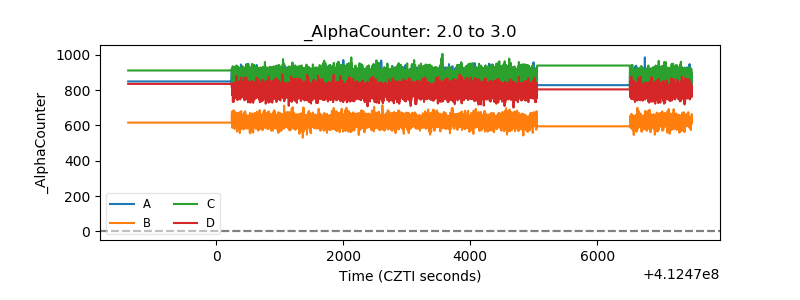 |
| _CPM_Rate | 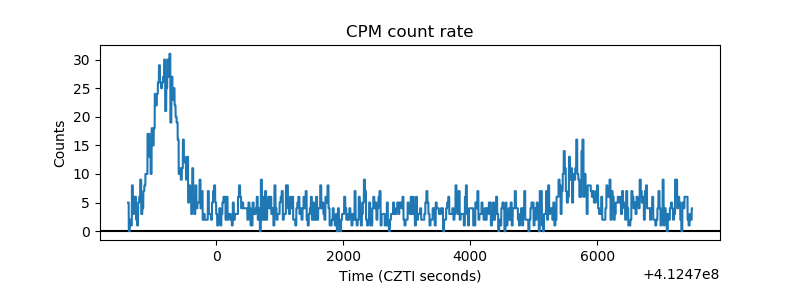 |
| CZT Counter | 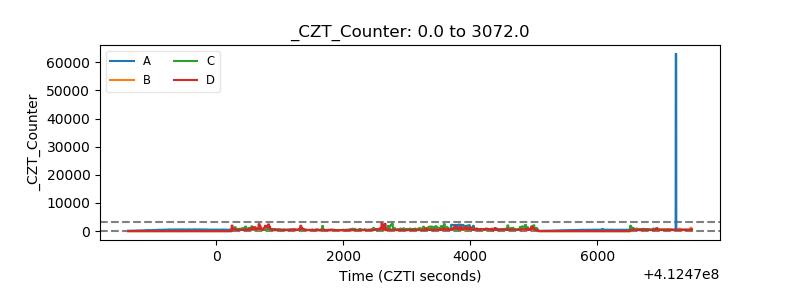 |
| +2.5 Volts monitor | 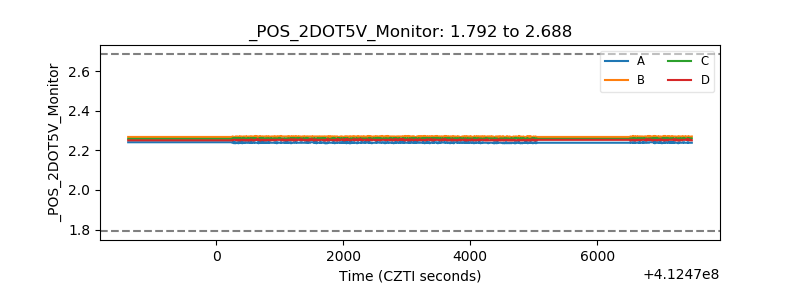 |
| +5 Volts monitor | 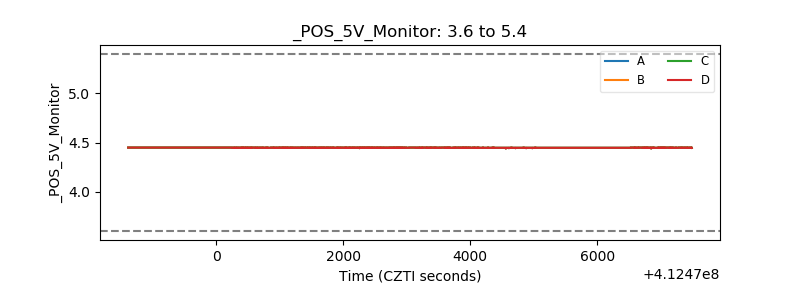 |
| _ROLL_ROT | 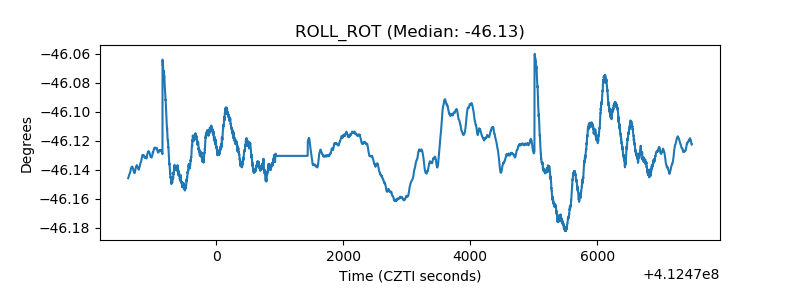 |
| _Roll_DEC | 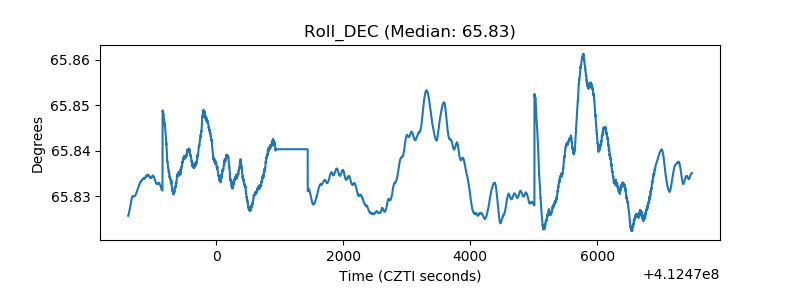 |
| _Roll_RA | 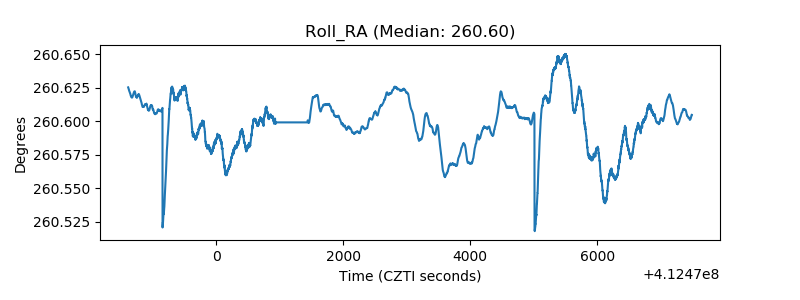 |
| Veto Counter | 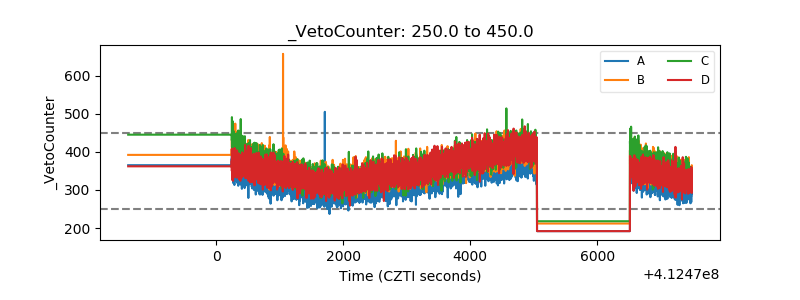 |