| Param | Original file | Final file |
|---|---|---|
| Filename | modeM0/AS1A12_018T01_9000005488_39641cztM0_level2.fits | modeM0/AS1A12_018T01_9000005488_39641cztM0_level2_quad_clean.evt |
| Size (bytes) | 479,741,760 | 94,806,720 |
| Size | 457.5 MB | 90.4 MB |
| Events in quadrant A | 4,071,099 | 652,821 |
| Events in quadrant B | 2,827,752 | 665,490 |
| Events in quadrant C | 7,273,812 | 546,602 |
| Events in quadrant D | 3,119,204 | 585,764 |
| Mode SS | |||
|---|---|---|---|
| Quadrant | BADHDUFLAG | Total packets | Discarded packets |
| A | 0 | 122 | 0 |
| B | 0 | 122 | 0 |
| C | 0 | 122 | 0 |
| D | 0 | 122 | 0 |
| Mode M0 | |||
|---|---|---|---|
| Quadrant | BADHDUFLAG | Total packets | Discarded packets |
| A | 0 | 16283 | 3 |
| B | 0 | 12878 | 2 |
| C | 0 | 25878 | 2 |
| D | 0 | 13764 | 2 |
| Mode M9 | |||
|---|---|---|---|
| Quadrant | BADHDUFLAG | Total packets | Discarded packets |
| A | 0 | 18 | 0 |
| B | 0 | 18 | 0 |
| C | 0 | 18 | 0 |
| D | 0 | 19 | 0 |
| Quadrant | Total seconds | Saturated seconds | Saturation percentage |
|---|---|---|---|
| A | 6011 | 16 | 0.266179% |
| B | 6011 | 43 | 0.715355% |
| C | 6011 | 1049 | 17.451339% |
| D | 6011 | 89 | 1.480619% |
Noise dominated data is calculated using 1-second bins in cleaned event files. If a bin has >2000 counts, and if more than 50% of those come from <1% of pixels, then it is considered to be noise-dominated and hence unusable.
| Quadrant | # 1 sec bins | Bins with >0 counts | Bins with >2000 counts | High rate bins dominated by noise | Noise dominated (total time) | Noise dominated (detector-on time) | Marked lightcurve |
|---|---|---|---|---|---|---|---|
| A | 7324 | 6012 | 4 | 4 | 0.05% | 0.07% | 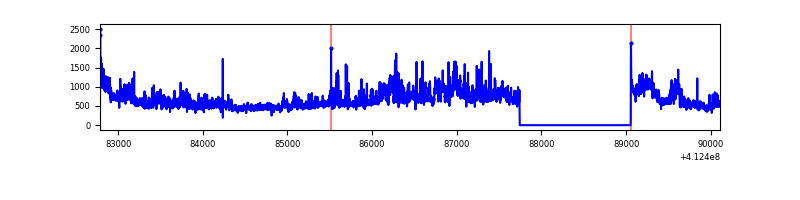 |
| B | 7324 | 6012 | 19 | 19 | 0.26% | 0.32% | 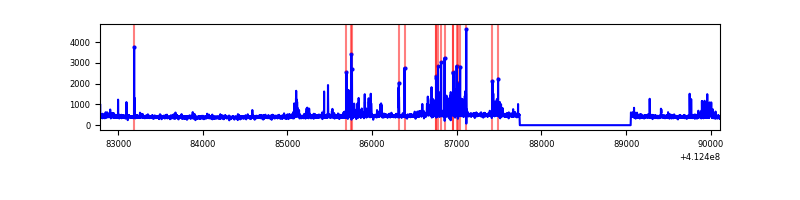 |
| C | 7324 | 6012 | 988 | 988 | 13.49% | 16.43% | 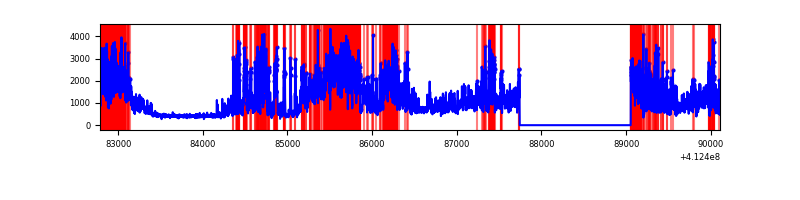 |
| D | 7324 | 6012 | 81 | 81 | 1.11% | 1.35% | 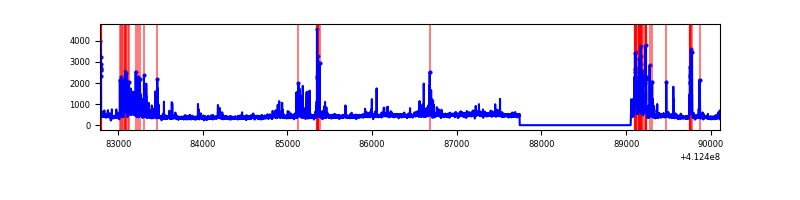 |
Top three noisy pixels from each quadrant. If the there are fewer than three noisy pixels in the level2.evt file, extra rows are filled as -1
| Pixel properties | Quadrant properties | ||||||
|---|---|---|---|---|---|---|---|
| Quadrant | DetID | PixID | Counts | Sigma | Mean | Median | Sigma |
| A | 15 | 222 | 1087298 | 8317.28 | 639 | 628 | 130.7 |
| A | 10 | 83 | 480318 | 3671.51 | 639 | 628 | 130.7 |
| A | 15 | 174 | 19801 | 146.75 | 639 | 628 | 130.7 |
| B | 5 | 172 | 210786 | 1700.86 | 635 | 616 | 123.6 |
| B | 5 | 255 | 93828 | 754.34 | 635 | 616 | 123.6 |
| B | 12 | 111 | 15645 | 121.63 | 635 | 616 | 123.6 |
| C | 9 | 187 | 3849468 | 28248.02 | 586 | 588 | 136.3 |
| C | 15 | 208 | 861092 | 6315.48 | 586 | 588 | 136.3 |
| C | 15 | 214 | 236292 | 1729.9 | 586 | 588 | 136.3 |
| D | 13 | 171 | 495603 | 3298.99 | 620 | 604 | 150.0 |
| D | 13 | 249 | 37805 | 247.93 | 620 | 604 | 150.0 |
| D | 3 | 14 | 28317 | 184.7 | 620 | 604 | 150.0 |
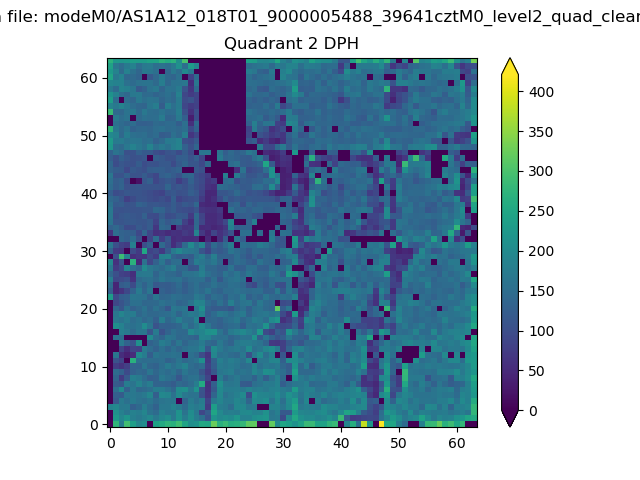
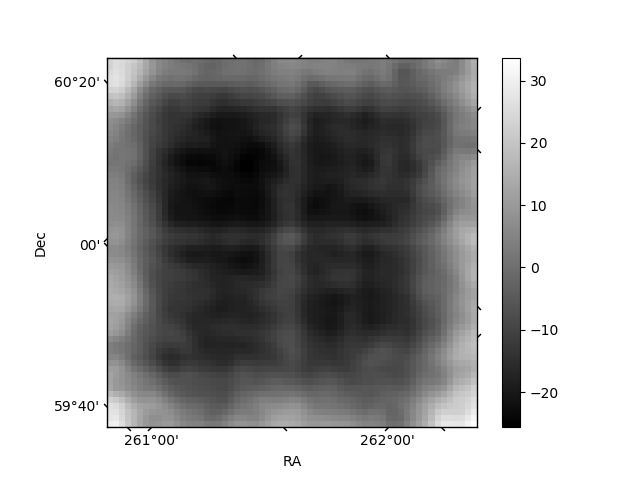
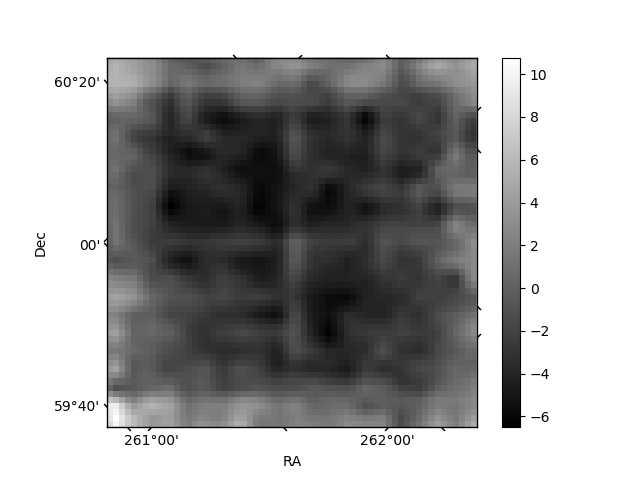
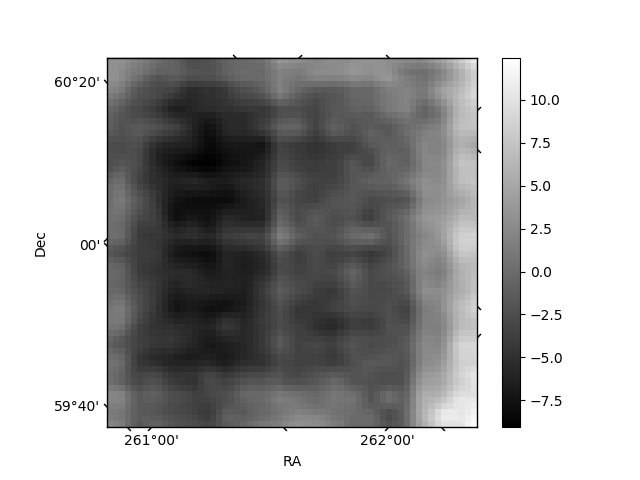
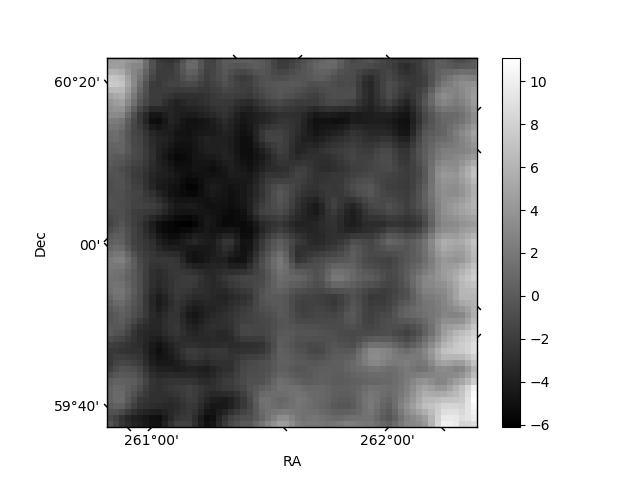
Histogram calculated using DETX and DETY for each event in the final _common_clean file
| Quadrant A | 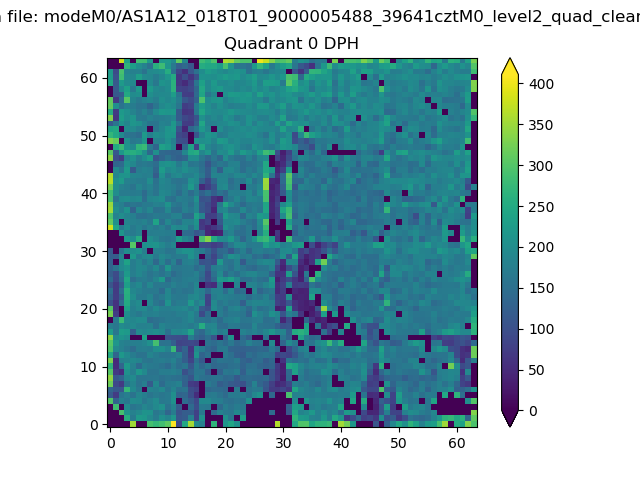 |
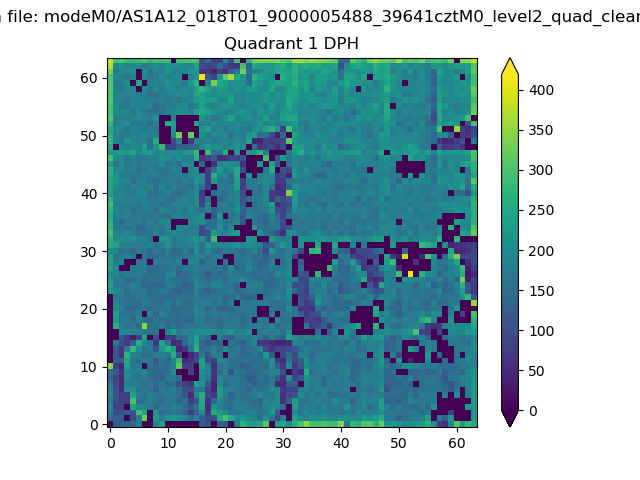 |
Quadrant B |
|---|---|---|---|
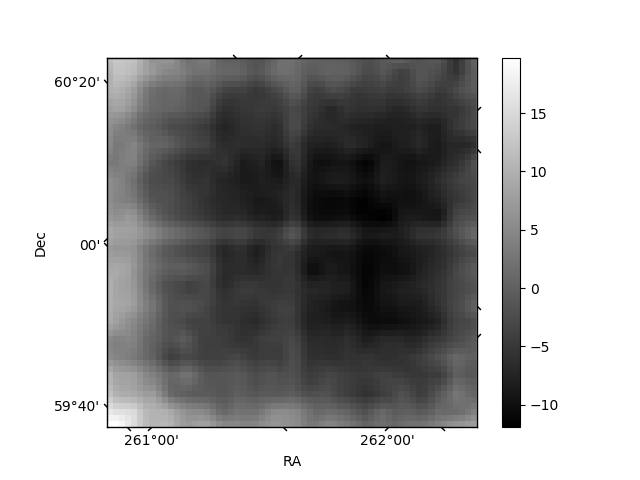
| Quadrant D | 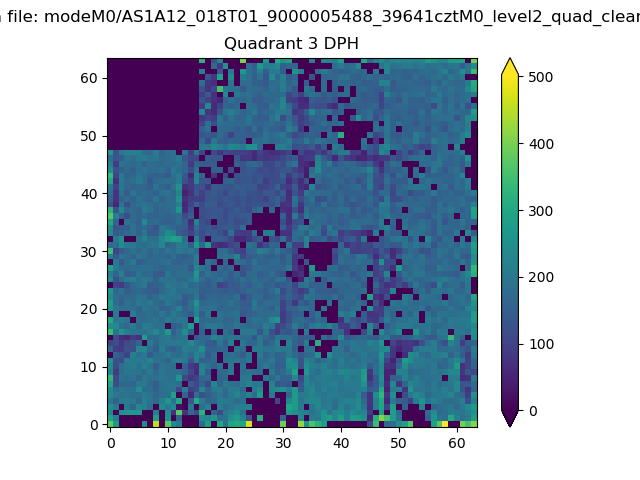 |
 |
Quadrant C |
| Plot type | Count rate plots | Images |
|---|---|---|
| Comparison with Poisson distribution Blue bars denote a histogram of data divided into 1 sec bins. Red curve is a Poisson curve with rate = median count rate of data. |
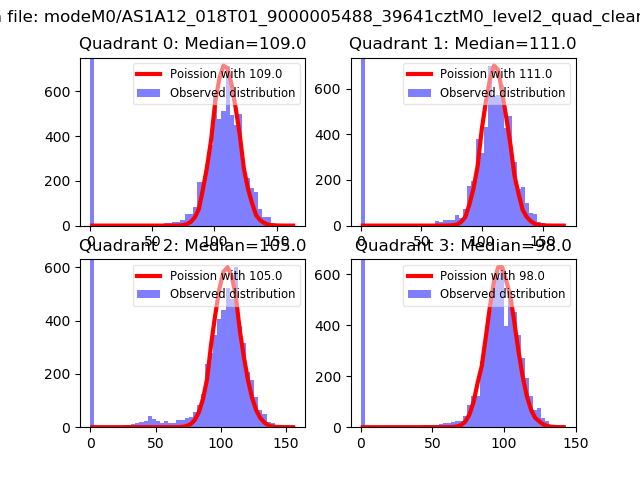 |
 |
| Quadrant-wise count rates Data is divided into 100 sec bins |
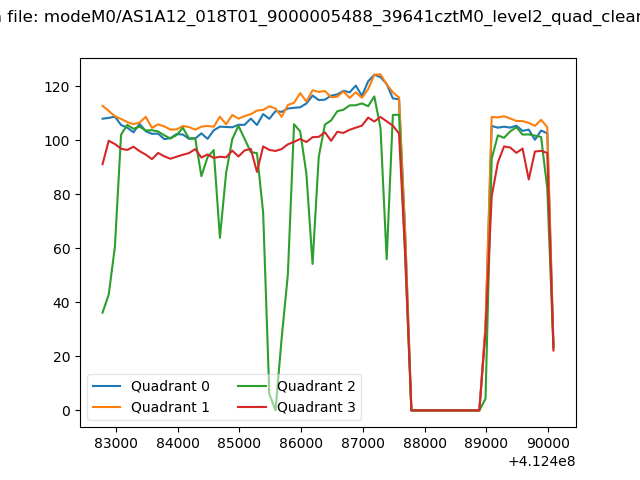 |
|
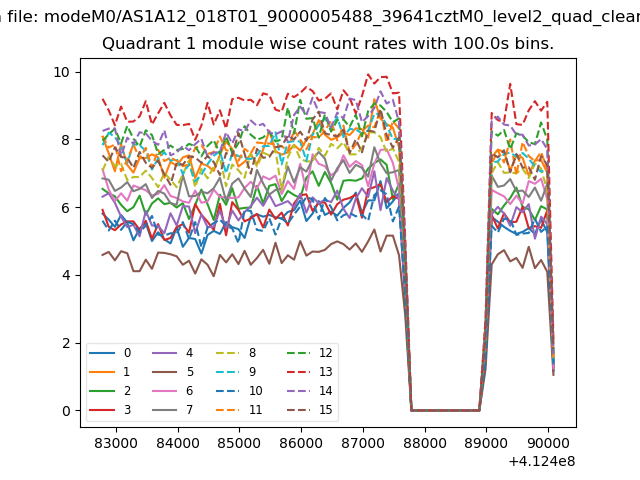
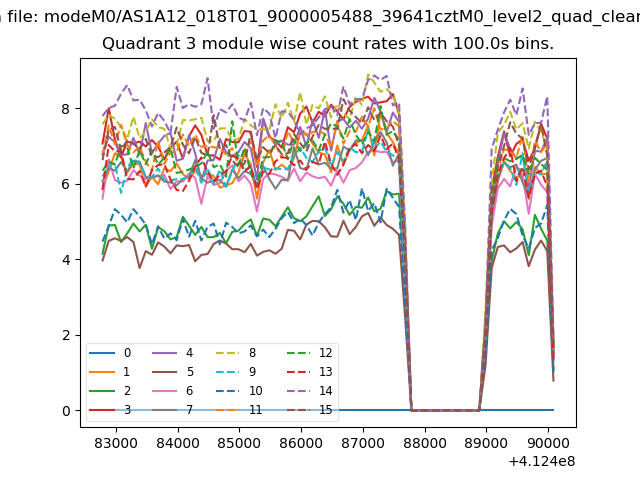
| Module-wise count rates for Quadrant A Data is divided into 100 sec bins |
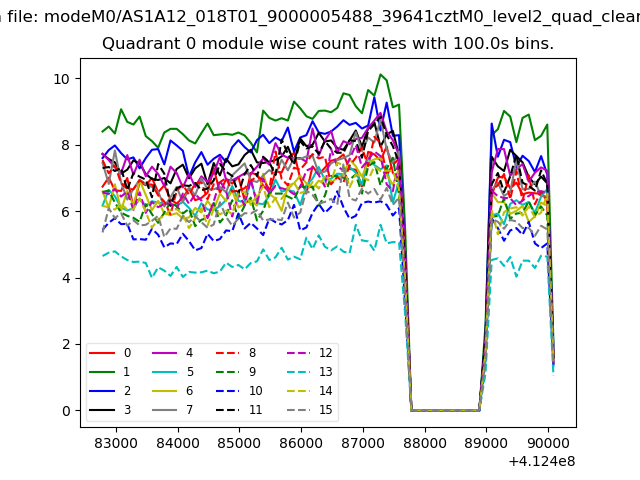 |
 |
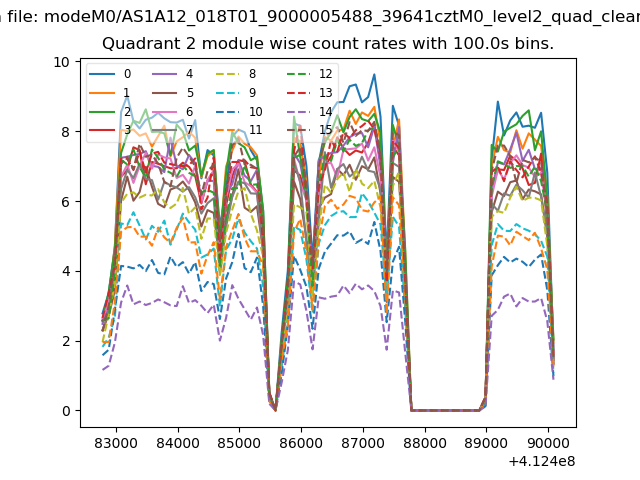
| Module-wise count rates for Quadrant B Data is divided into 100 sec bins |
 |
 |
| Module-wise count rates for Quadrant C Data is divided into 100 sec bins |
 |
 |
| Module-wise count rates for Quadrant D Data is divided into 100 sec bins |
 |
 |
| Parameter | Plot |
|---|---|
| CZT HV Monitor | 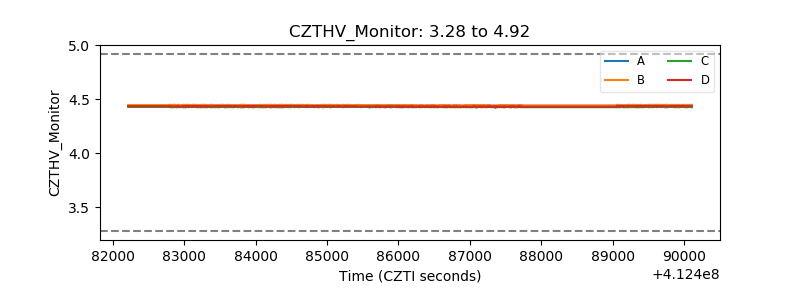 |
| D_VDD | 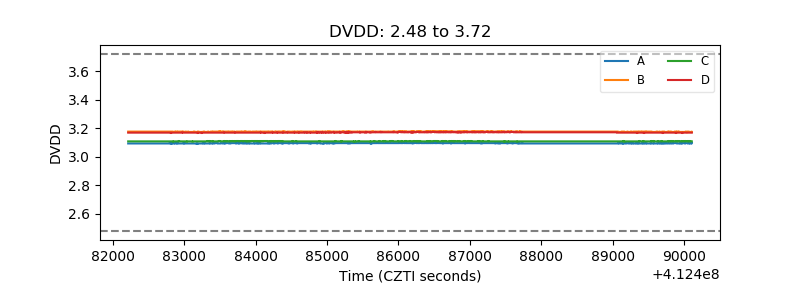 |
| Temperature 1 | 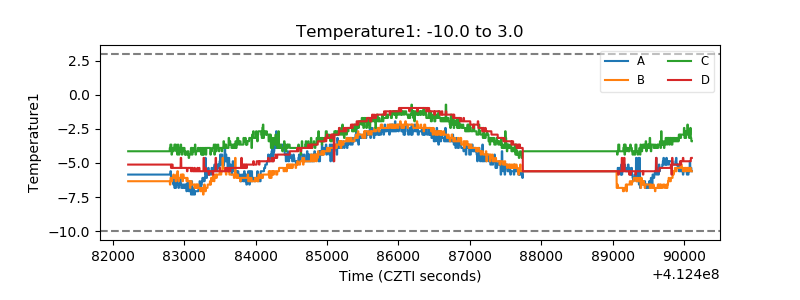 |
| Veto HV Monitor | 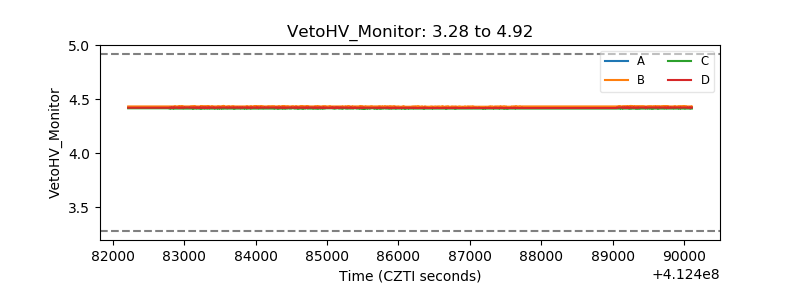 |
| Veto LLD | 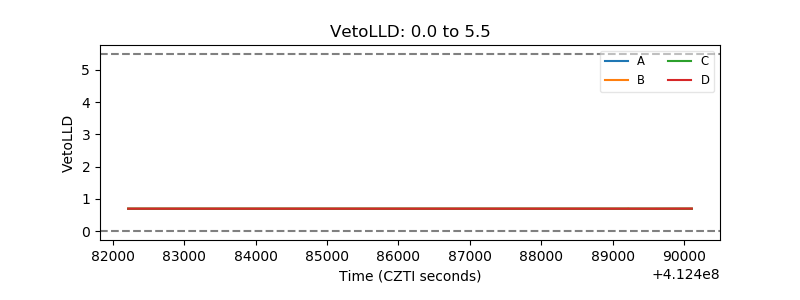 |
| Alpha Counter | 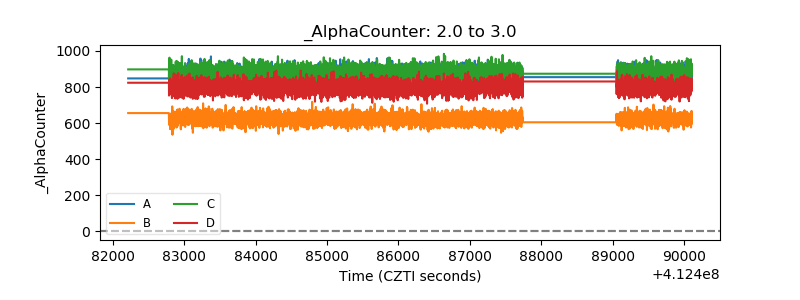 |
| _CPM_Rate | 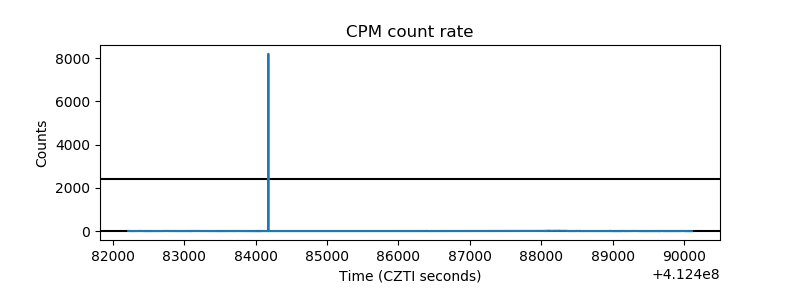 |
| CZT Counter | 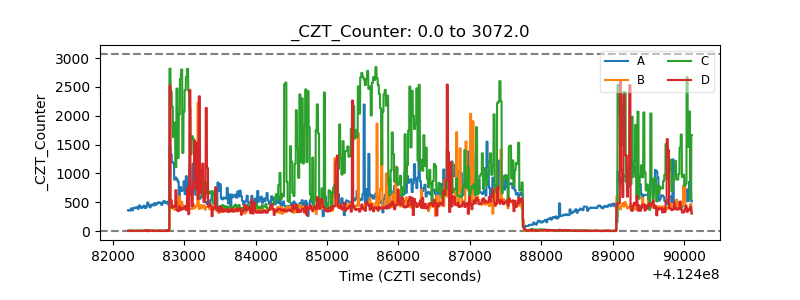 |
| +2.5 Volts monitor | 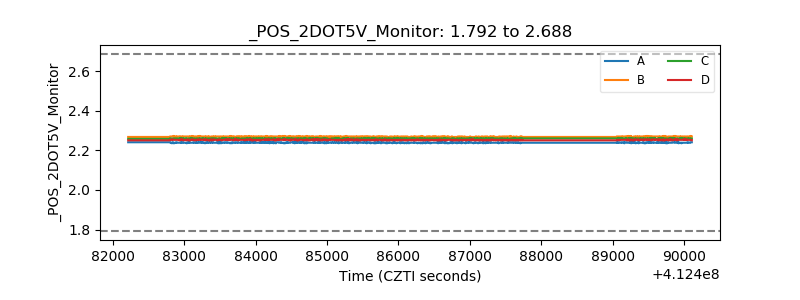 |
| +5 Volts monitor | 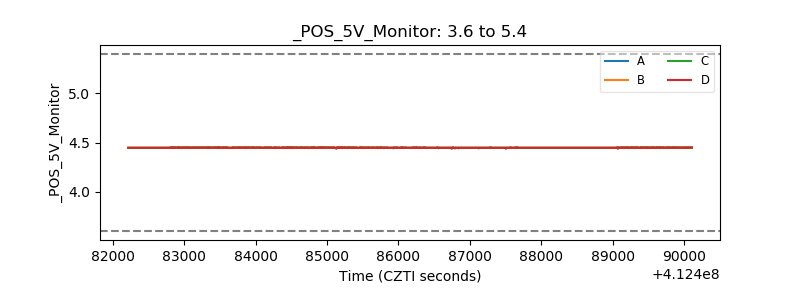 |
| _ROLL_ROT |  |
| _Roll_DEC | 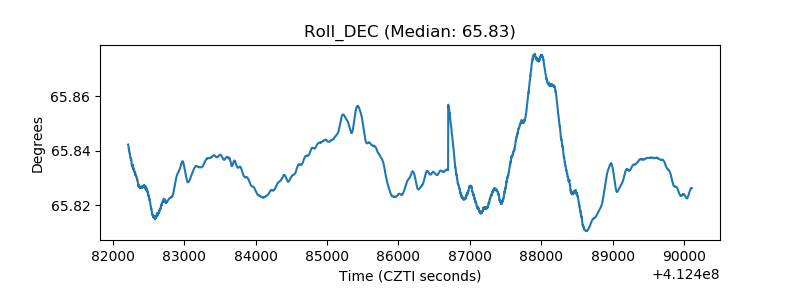 |
| _Roll_RA | 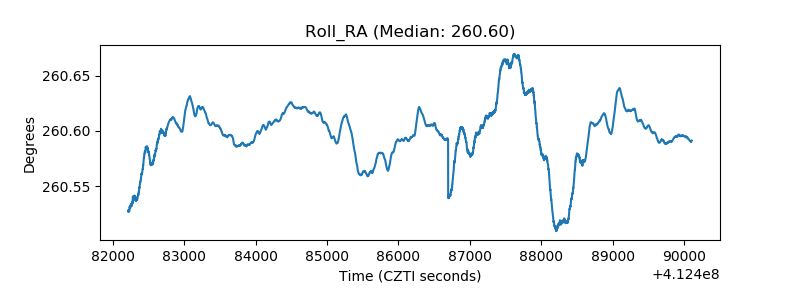 |
| Veto Counter | 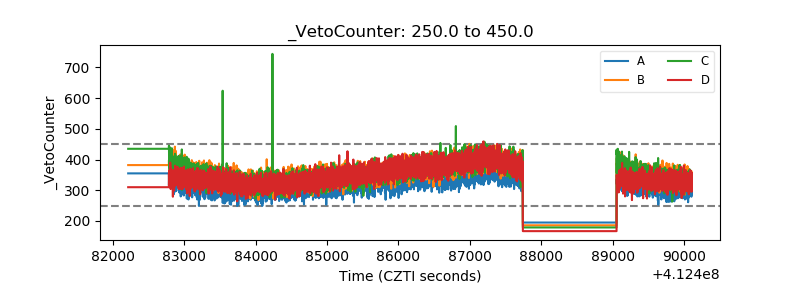 |