| Param | Original file | Final file |
|---|---|---|
| Filename | modeM0/AS1A12_018T01_9000005488_39643cztM0_level2.fits | modeM0/AS1A12_018T01_9000005488_39643cztM0_level2_quad_clean.evt |
| Size (bytes) | 846,089,280 | 164,488,320 |
| Size | 806.9 MB | 156.9 MB |
| Events in quadrant A | 6,943,975 | 1,134,935 |
| Events in quadrant B | 5,156,882 | 1,143,985 |
| Events in quadrant C | 12,137,118 | 980,120 |
| Events in quadrant D | 6,273,880 | 997,718 |
| Mode SS | |||
|---|---|---|---|
| Quadrant | BADHDUFLAG | Total packets | Discarded packets |
| A | 0 | 212 | 0 |
| B | 0 | 212 | 0 |
| C | 0 | 212 | 0 |
| D | 0 | 212 | 0 |
| Mode M0 | |||
|---|---|---|---|
| Quadrant | BADHDUFLAG | Total packets | Discarded packets |
| A | 0 | 28162 | 3 |
| B | 0 | 22941 | 2 |
| C | 0 | 43332 | 2 |
| D | 0 | 26199 | 2 |
| Mode M9 | |||
|---|---|---|---|
| Quadrant | BADHDUFLAG | Total packets | Discarded packets |
| A | 0 | 29 | 0 |
| B | 0 | 29 | 0 |
| C | 0 | 29 | 0 |
| D | 0 | 29 | 0 |
| Quadrant | Total seconds | Saturated seconds | Saturation percentage |
|---|---|---|---|
| A | 10446 | 42 | 0.402068% |
| B | 10446 | 142 | 1.359372% |
| C | 10446 | 1428 | 13.670304% |
| D | 10446 | 274 | 2.623014% |
Noise dominated data is calculated using 1-second bins in cleaned event files. If a bin has >2000 counts, and if more than 50% of those come from <1% of pixels, then it is considered to be noise-dominated and hence unusable.
| Quadrant | # 1 sec bins | Bins with >0 counts | Bins with >2000 counts | High rate bins dominated by noise | Noise dominated (total time) | Noise dominated (detector-on time) | Marked lightcurve |
|---|---|---|---|---|---|---|---|
| A | 13282 | 10448 | 10 | 10 | 0.08% | 0.10% | 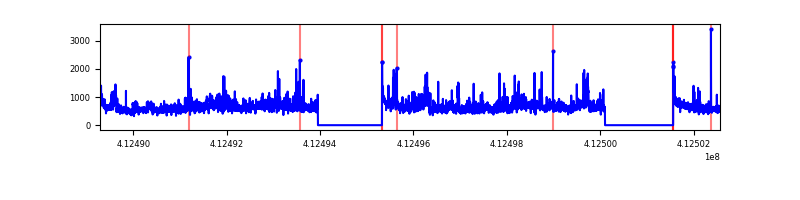 |
| B | 13282 | 10448 | 81 | 81 | 0.61% | 0.78% | 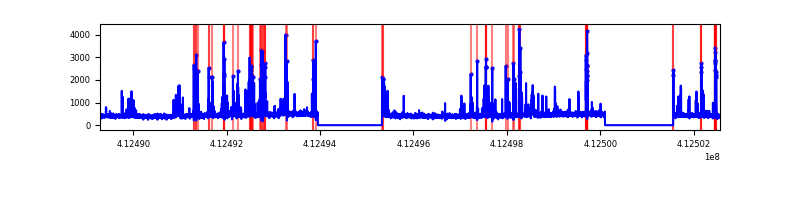 |
| C | 13282 | 10448 | 1334 | 1334 | 10.04% | 12.77% | 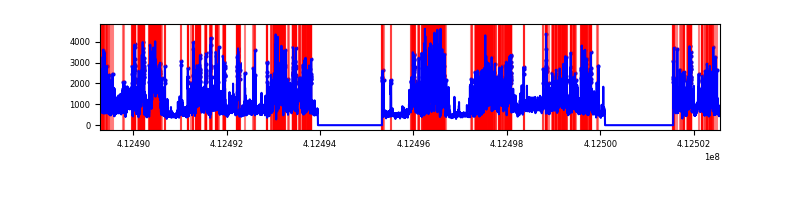 |
| D | 13282 | 10448 | 206 | 206 | 1.55% | 1.97% | 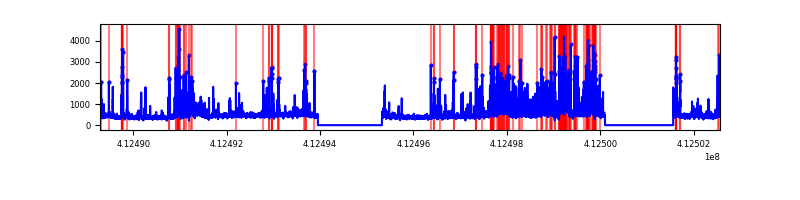 |
Top three noisy pixels from each quadrant. If the there are fewer than three noisy pixels in the level2.evt file, extra rows are filled as -1
| Pixel properties | Quadrant properties | ||||||
|---|---|---|---|---|---|---|---|
| Quadrant | DetID | PixID | Counts | Sigma | Mean | Median | Sigma |
| A | 15 | 222 | 1830236 | 8011.47 | 1123 | 1101 | 228.3 |
| A | 10 | 83 | 721158 | 3153.79 | 1123 | 1101 | 228.3 |
| A | 15 | 254 | 15375 | 62.52 | 1123 | 1101 | 228.3 |
| B | 5 | 172 | 615543 | 2894.48 | 1110 | 1078 | 212.3 |
| B | 5 | 255 | 61314 | 283.75 | 1110 | 1078 | 212.3 |
| B | 5 | 207 | 46734 | 215.07 | 1110 | 1078 | 212.3 |
| C | 15 | 208 | 4259414 | 17582.76 | 1043 | 1050 | 242.2 |
| C | 9 | 187 | 3181607 | 13132.5 | 1043 | 1050 | 242.2 |
| C | 15 | 214 | 411409 | 1694.37 | 1043 | 1050 | 242.2 |
| D | 12 | 227 | 620824 | 2370.41 | 1089 | 1059 | 261.5 |
| D | 2 | 249 | 556976 | 2126.21 | 1089 | 1059 | 261.5 |
| D | 13 | 171 | 426406 | 1626.82 | 1089 | 1059 | 261.5 |
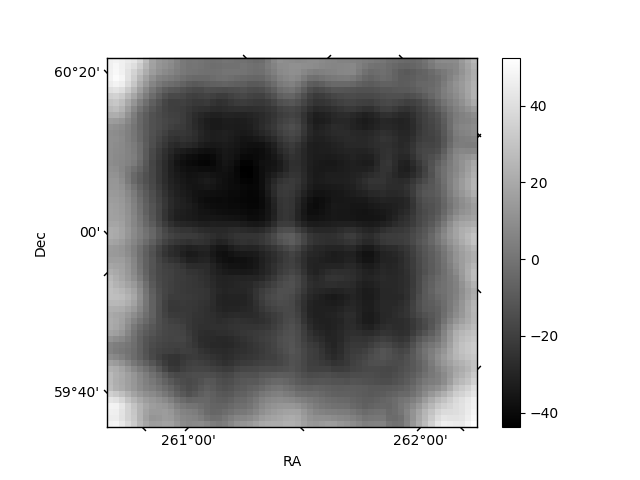
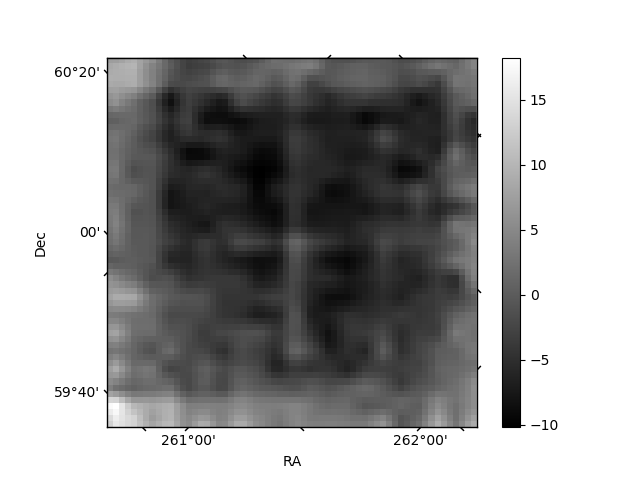
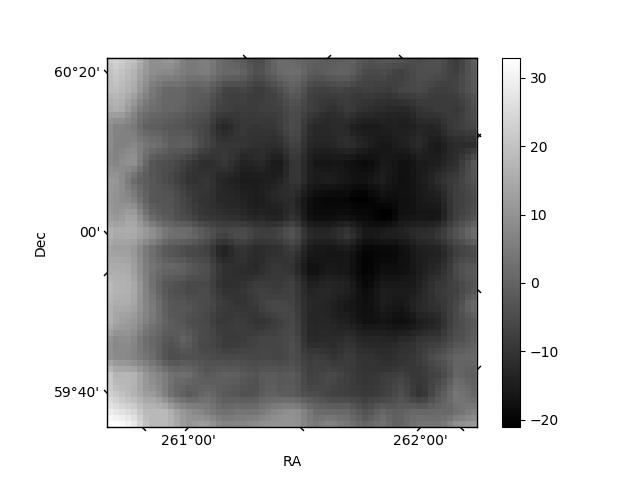
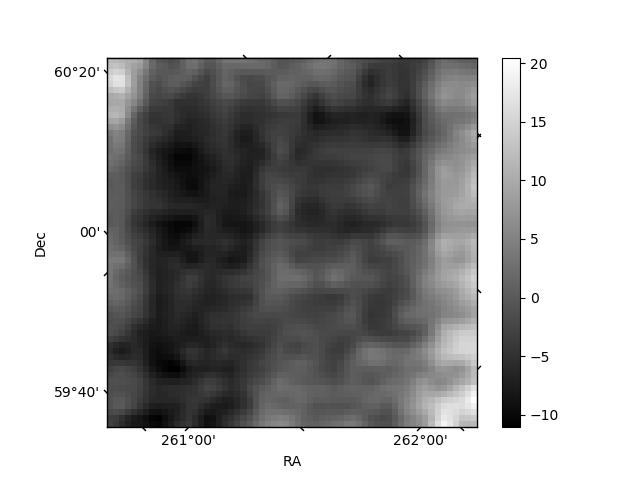
Histogram calculated using DETX and DETY for each event in the final _common_clean file
| Quadrant A | 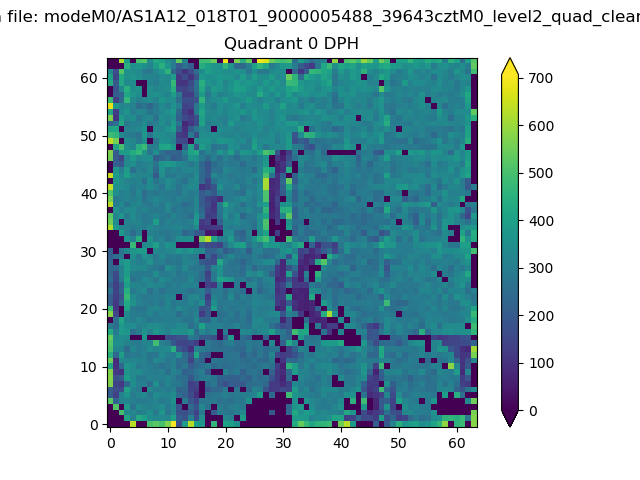 |
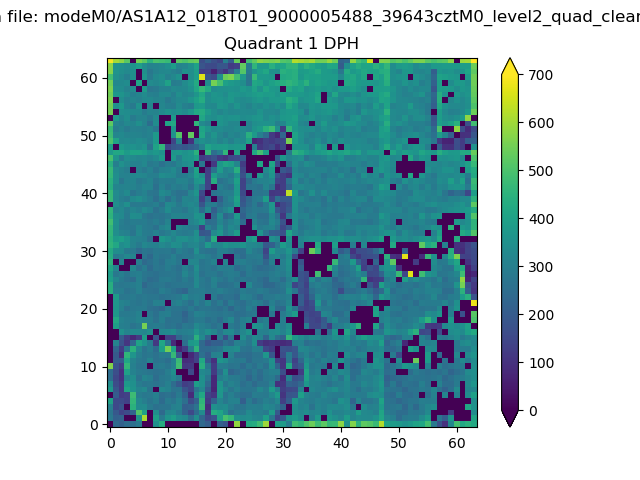 |
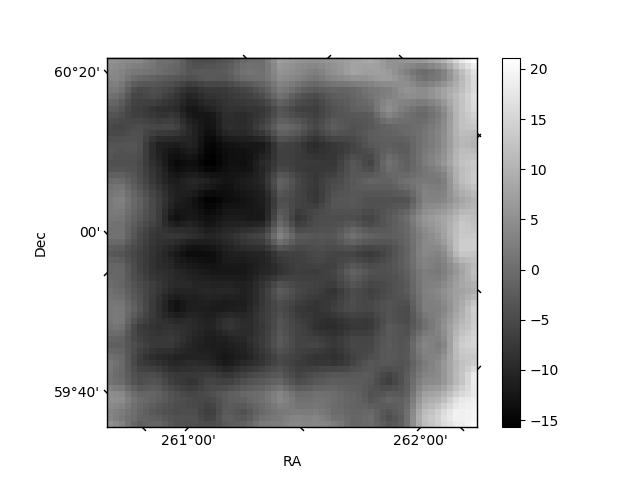
Quadrant B |
|---|---|---|---|
| Quadrant D | 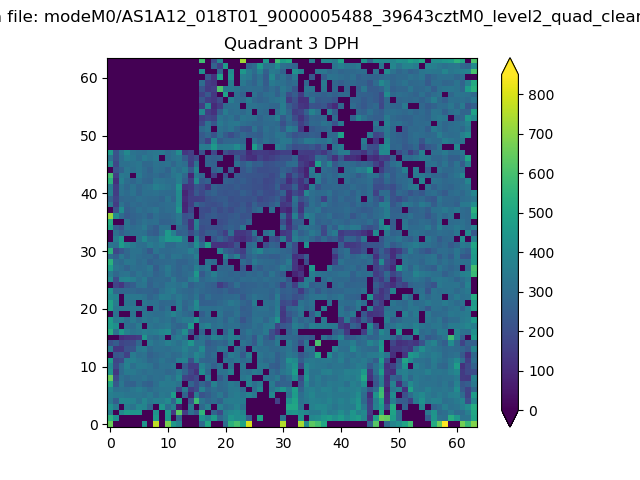 |
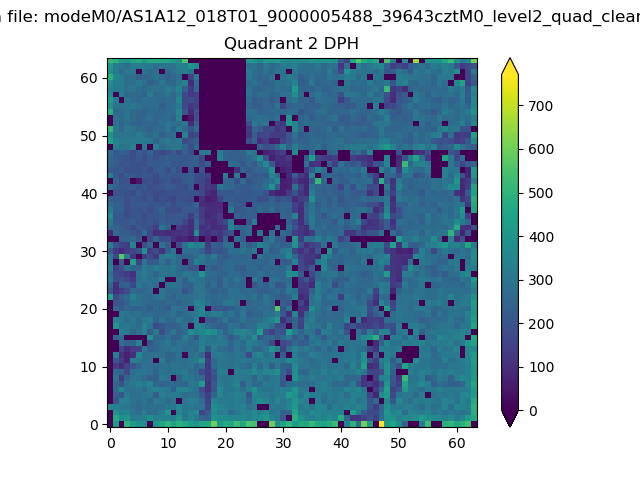 |
Quadrant C |
| Plot type | Count rate plots | Images |
|---|---|---|
| Comparison with Poisson distribution Blue bars denote a histogram of data divided into 1 sec bins. Red curve is a Poisson curve with rate = median count rate of data. |
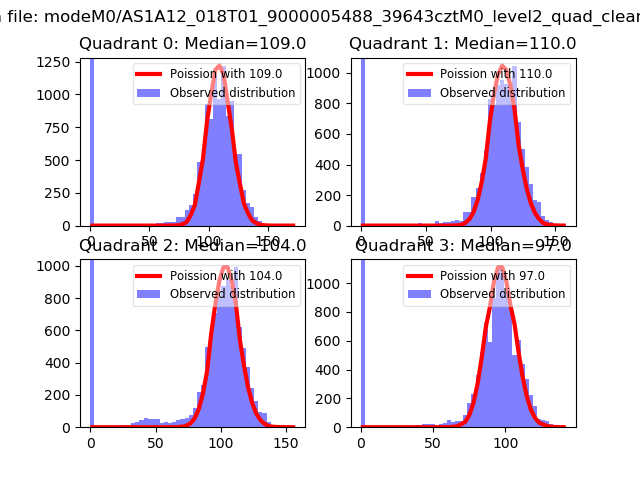 |
 |
| Quadrant-wise count rates Data is divided into 100 sec bins |
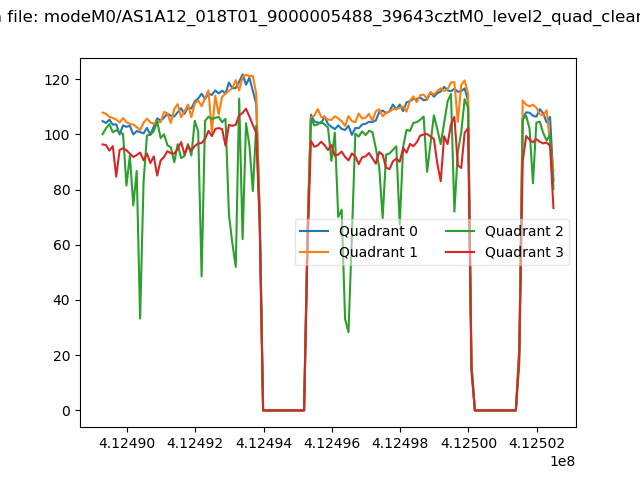 |
|
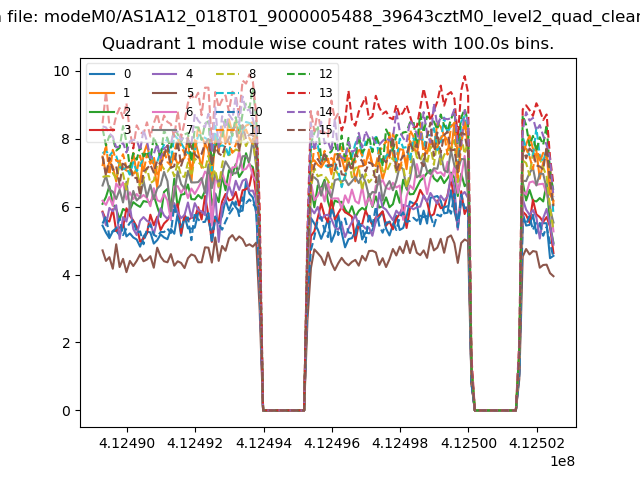
| Module-wise count rates for Quadrant A Data is divided into 100 sec bins |
 |
 |
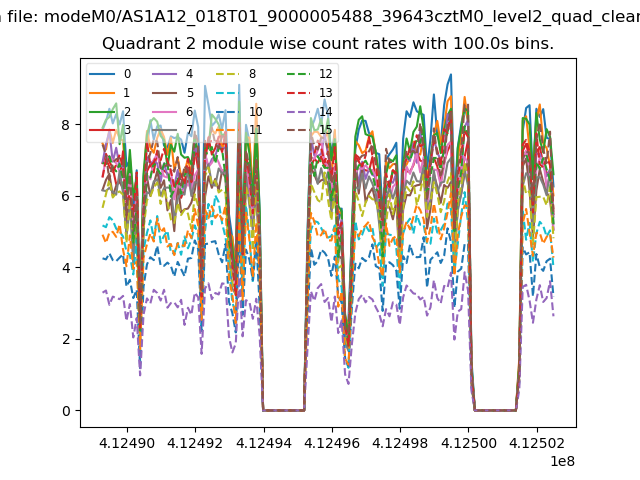
| Module-wise count rates for Quadrant B Data is divided into 100 sec bins |
 |
 |
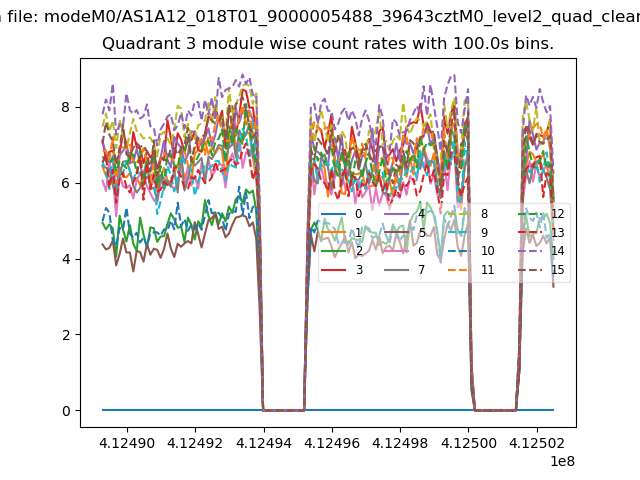
| Module-wise count rates for Quadrant C Data is divided into 100 sec bins |
 |
 |
| Module-wise count rates for Quadrant D Data is divided into 100 sec bins |
 |
 |
| Parameter | Plot |
|---|---|
| CZT HV Monitor | 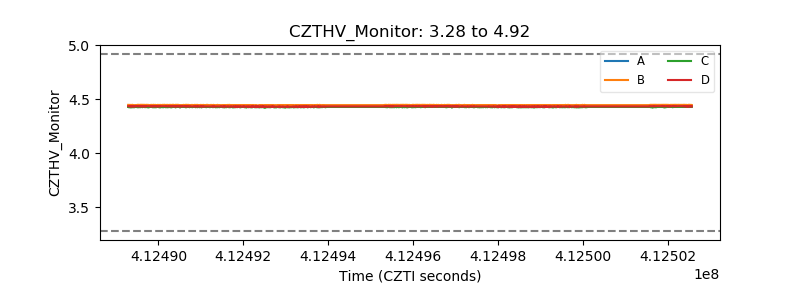 |
| D_VDD | 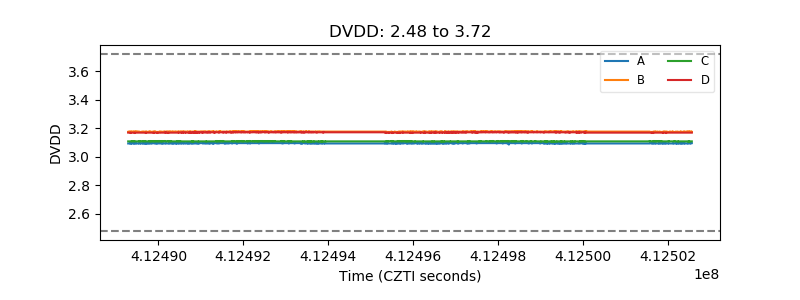 |
| Temperature 1 | 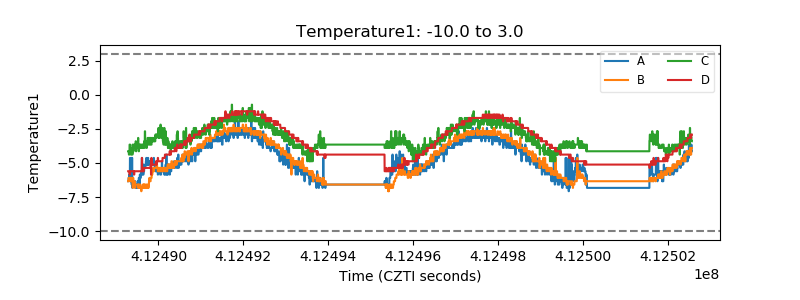 |
| Veto HV Monitor | 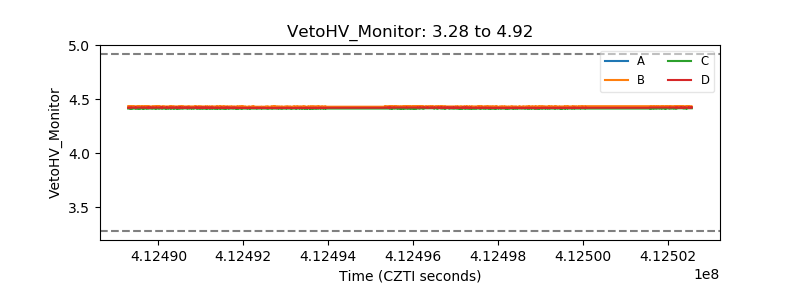 |
| Veto LLD | 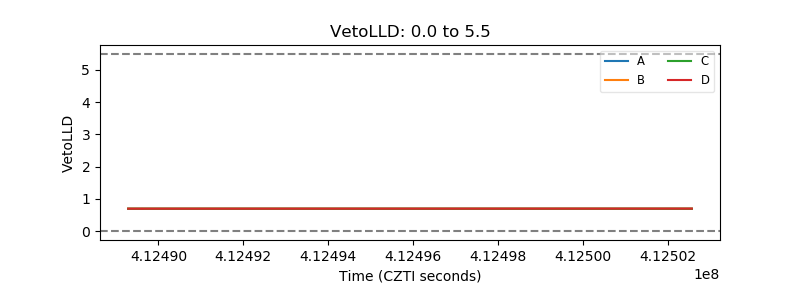 |
| Alpha Counter | 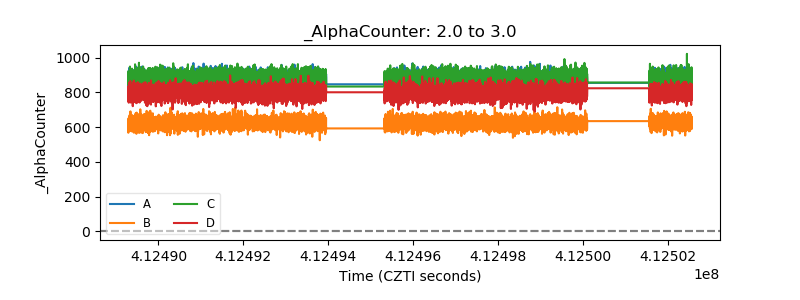 |
| _CPM_Rate | 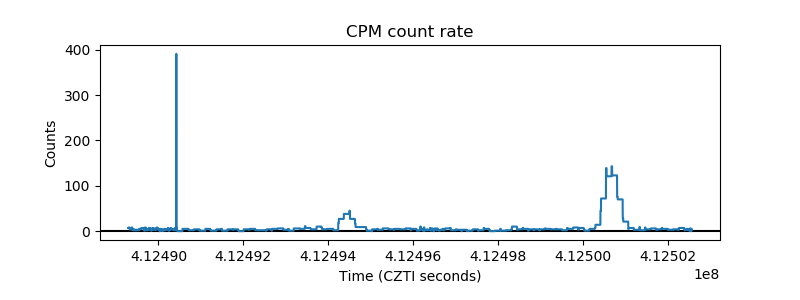 |
| CZT Counter | 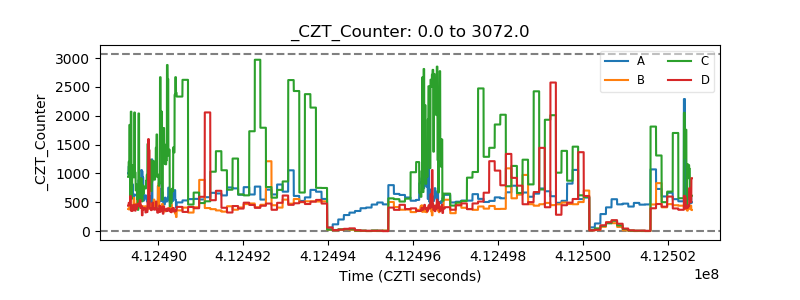 |
| +2.5 Volts monitor | 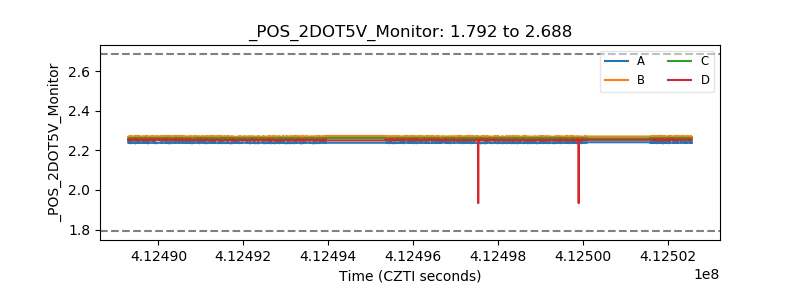 |
| +5 Volts monitor | 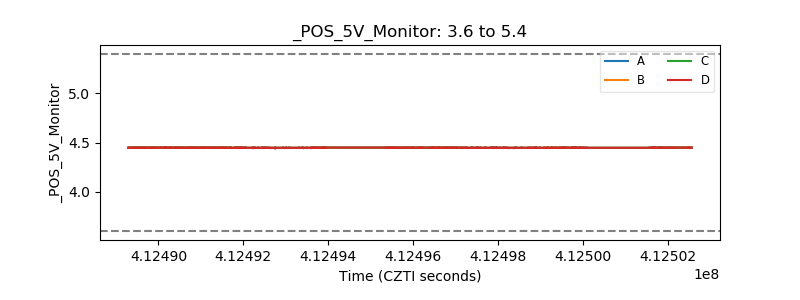 |
| _ROLL_ROT | 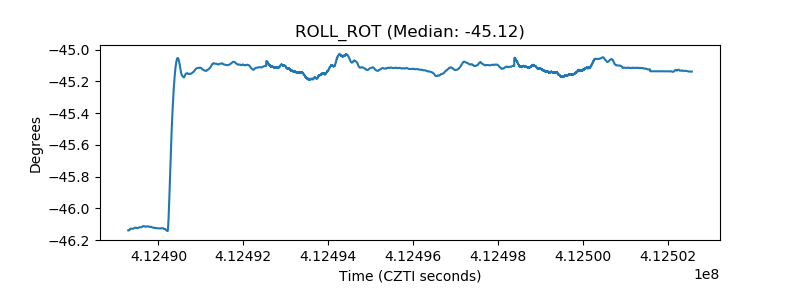 |
| _Roll_DEC | 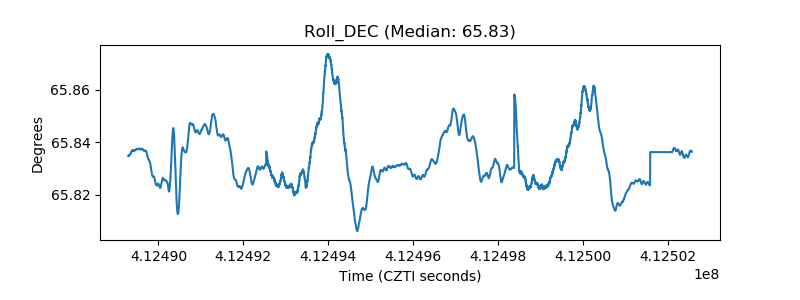 |
| _Roll_RA | 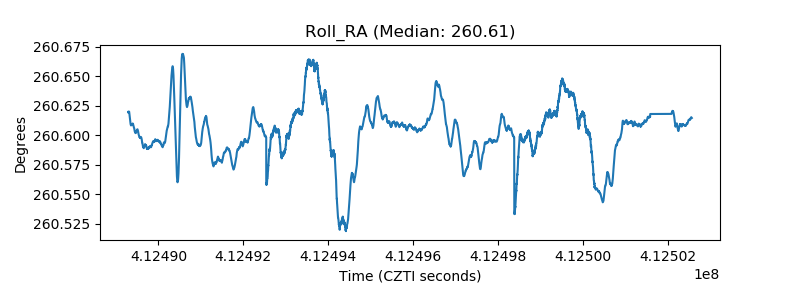 |
| Veto Counter | 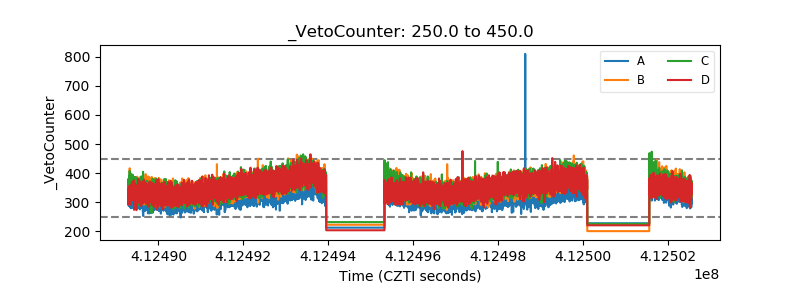 |