| Param | Original file | Final file |
|---|---|---|
| Filename | modeM0/AS1A12_018T01_9000005488_39645cztM0_level2.fits | modeM0/AS1A12_018T01_9000005488_39645cztM0_level2_quad_clean.evt |
| Size (bytes) | 413,953,920 | 90,362,880 |
| Size | 394.8 MB | 86.2 MB |
| Events in quadrant A | 3,642,389 | 619,884 |
| Events in quadrant B | 2,762,272 | 629,969 |
| Events in quadrant C | 4,337,210 | 582,806 |
| Events in quadrant D | 4,157,752 | 522,135 |
| Mode SS | |||
|---|---|---|---|
| Quadrant | BADHDUFLAG | Total packets | Discarded packets |
| A | 0 | 110 | 0 |
| B | 0 | 110 | 0 |
| C | 0 | 110 | 0 |
| D | 0 | 110 | 0 |
| Mode M0 | |||
|---|---|---|---|
| Quadrant | BADHDUFLAG | Total packets | Discarded packets |
| A | 0 | 14309 | 3 |
| B | 0 | 12029 | 2 |
| C | 0 | 16496 | 2 |
| D | 0 | 16090 | 2 |
| Mode M9 | |||
|---|---|---|---|
| Quadrant | BADHDUFLAG | Total packets | Discarded packets |
| A | 0 | 23 | 0 |
| B | 0 | 23 | 0 |
| C | 0 | 23 | 0 |
| D | 0 | 24 | 0 |
| Quadrant | Total seconds | Saturated seconds | Saturation percentage |
|---|---|---|---|
| A | 5452 | 68 | 1.247249% |
| B | 5452 | 68 | 1.247249% |
| C | 5452 | 210 | 3.851798% |
| D | 5452 | 440 | 8.070433% |
Noise dominated data is calculated using 1-second bins in cleaned event files. If a bin has >2000 counts, and if more than 50% of those come from <1% of pixels, then it is considered to be noise-dominated and hence unusable.
| Quadrant | # 1 sec bins | Bins with >0 counts | Bins with >2000 counts | High rate bins dominated by noise | Noise dominated (total time) | Noise dominated (detector-on time) | Marked lightcurve |
|---|---|---|---|---|---|---|---|
| A | 7154 | 5453 | 48 | 48 | 0.67% | 0.88% | 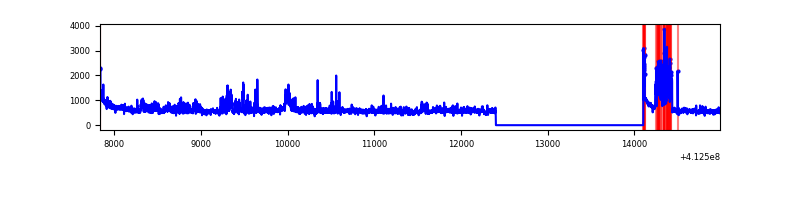 |
| B | 7154 | 5453 | 47 | 47 | 0.66% | 0.86% | 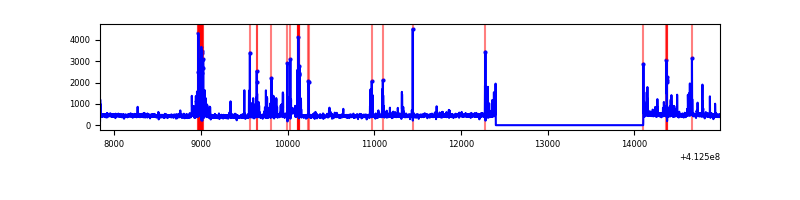 |
| C | 7154 | 5453 | 180 | 180 | 2.52% | 3.30% | 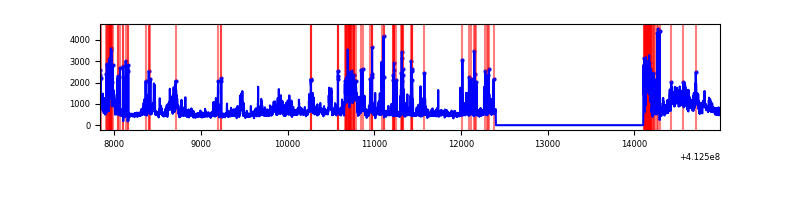 |
| D | 7154 | 5453 | 379 | 379 | 5.30% | 6.95% | 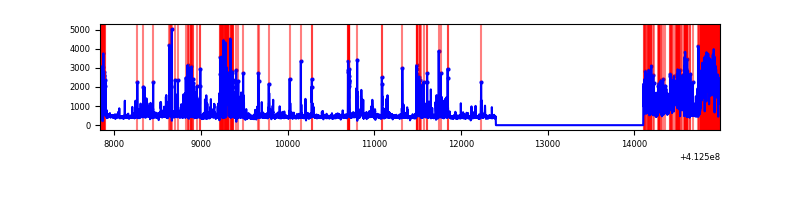 |
Top three noisy pixels from each quadrant. If the there are fewer than three noisy pixels in the level2.evt file, extra rows are filled as -1
| Pixel properties | Quadrant properties | ||||||
|---|---|---|---|---|---|---|---|
| Quadrant | DetID | PixID | Counts | Sigma | Mean | Median | Sigma |
| A | 15 | 222 | 807845 | 6589.57 | 600 | 587 | 122.5 |
| A | 10 | 83 | 451290 | 3679.04 | 600 | 587 | 122.5 |
| A | 13 | 248 | 26941 | 215.13 | 600 | 587 | 122.5 |
| B | 5 | 172 | 360440 | 3148.32 | 592 | 574 | 114.3 |
| B | 5 | 255 | 29962 | 257.1 | 592 | 574 | 114.3 |
| B | 4 | 170 | 15529 | 130.83 | 592 | 574 | 114.3 |
| C | 9 | 187 | 1102703 | 8189.01 | 577 | 580 | 134.6 |
| C | 15 | 208 | 445702 | 3307.35 | 577 | 580 | 134.6 |
| C | 3 | 233 | 300436 | 2228.0 | 577 | 580 | 134.6 |
| D | 12 | 227 | 844439 | 6049.02 | 568 | 551 | 139.5 |
| D | 13 | 249 | 495399 | 3547.09 | 568 | 551 | 139.5 |
| D | 2 | 250 | 205737 | 1470.78 | 568 | 551 | 139.5 |
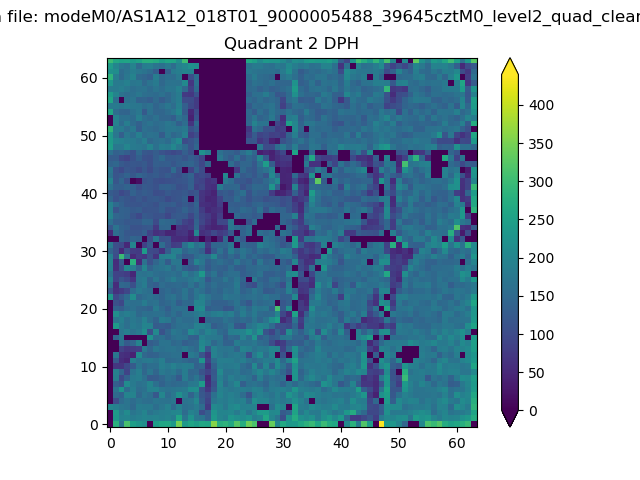
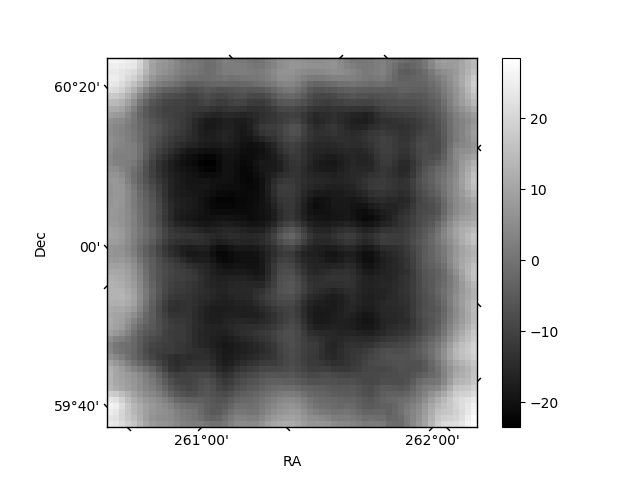
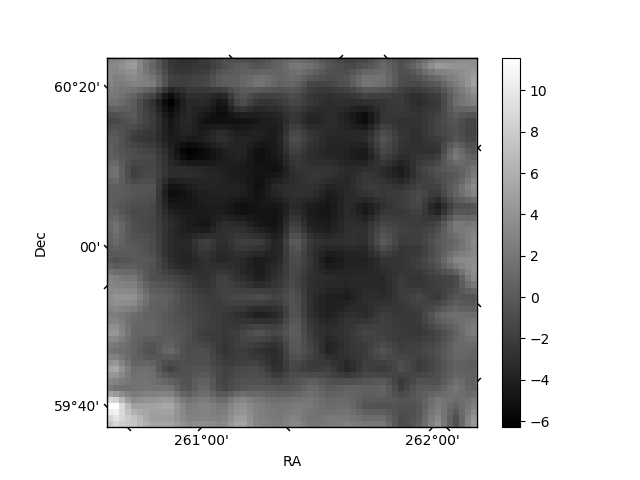
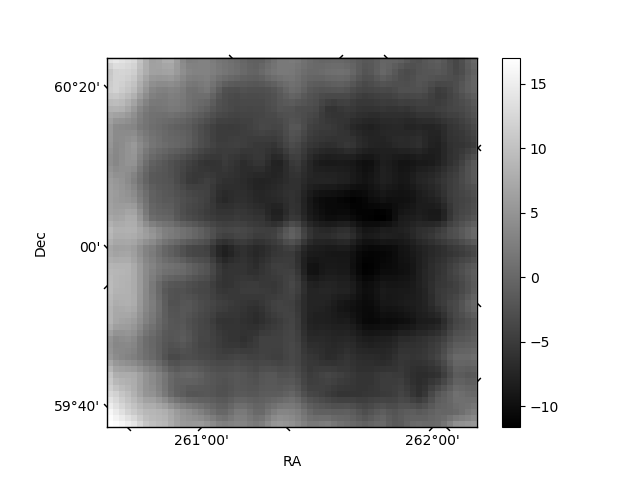
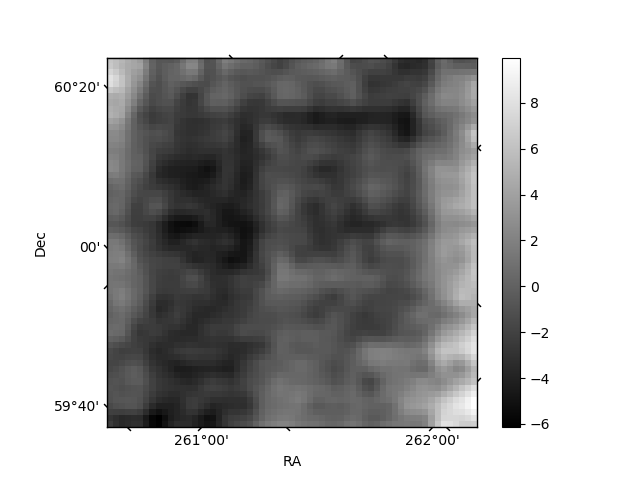
Histogram calculated using DETX and DETY for each event in the final _common_clean file
| Quadrant A | 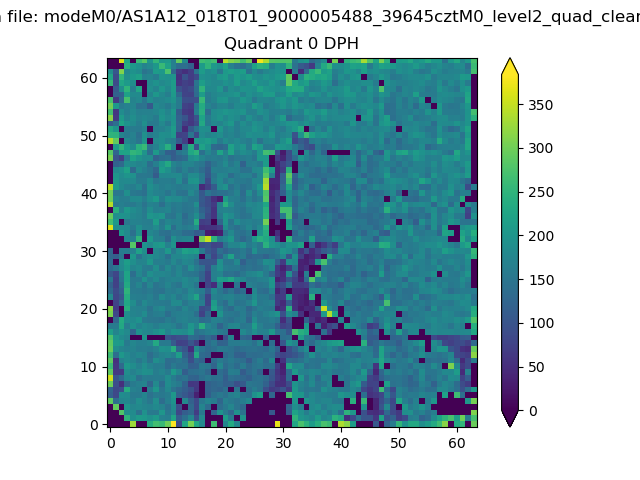 |
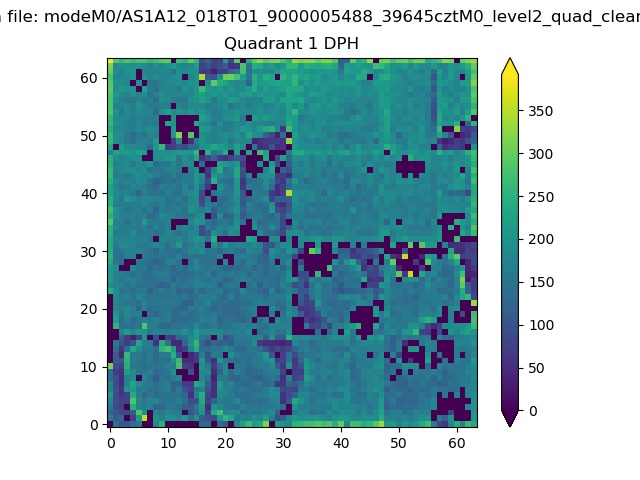 |
Quadrant B |
|---|---|---|---|
| Quadrant D | 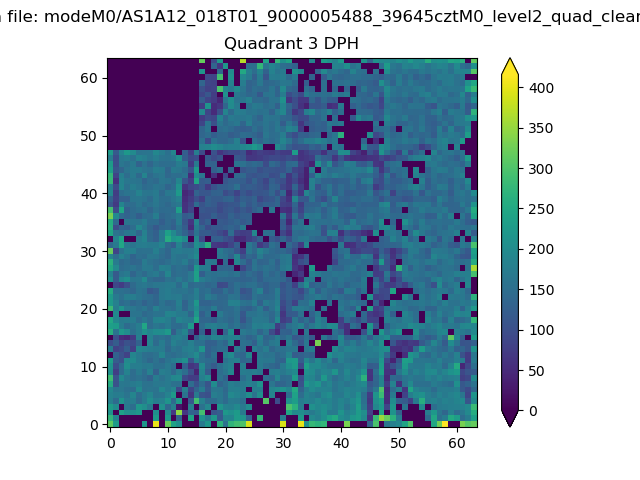 |
 |
Quadrant C |
| Plot type | Count rate plots | Images |
|---|---|---|
| Comparison with Poisson distribution Blue bars denote a histogram of data divided into 1 sec bins. Red curve is a Poisson curve with rate = median count rate of data. |
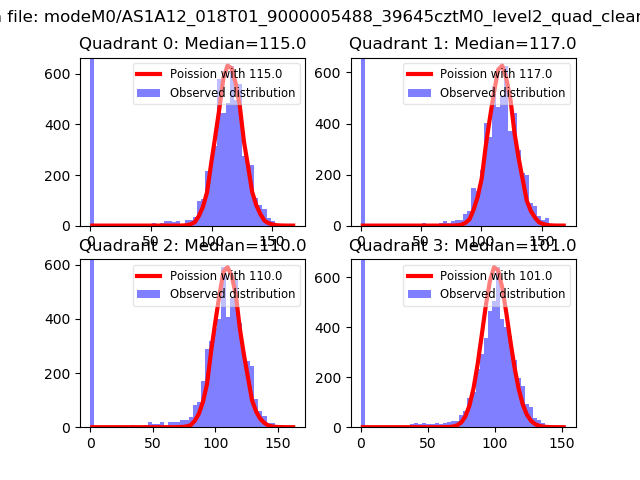 |
 |
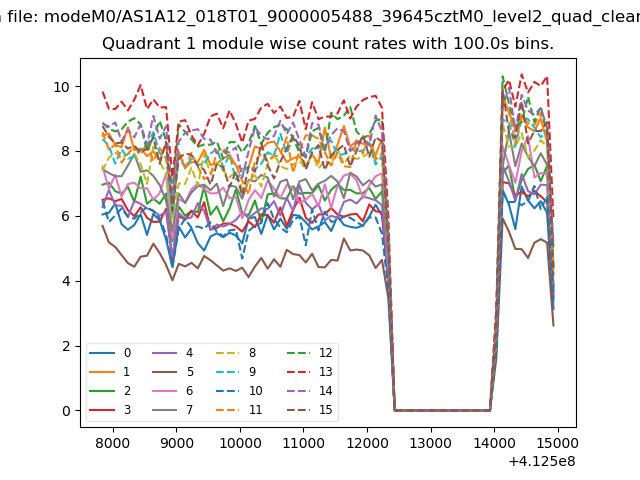
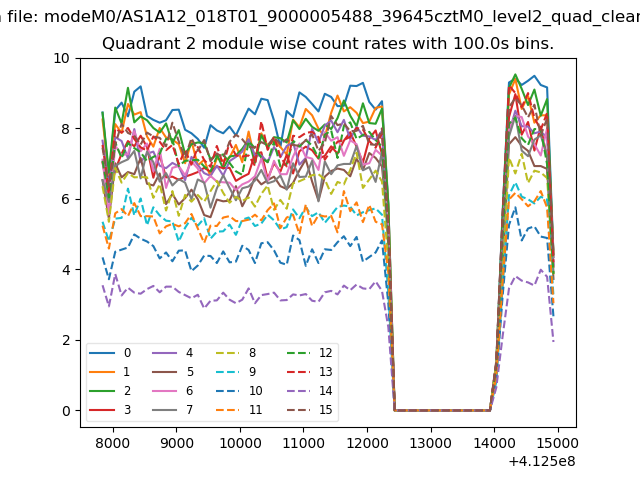
| Quadrant-wise count rates Data is divided into 100 sec bins |
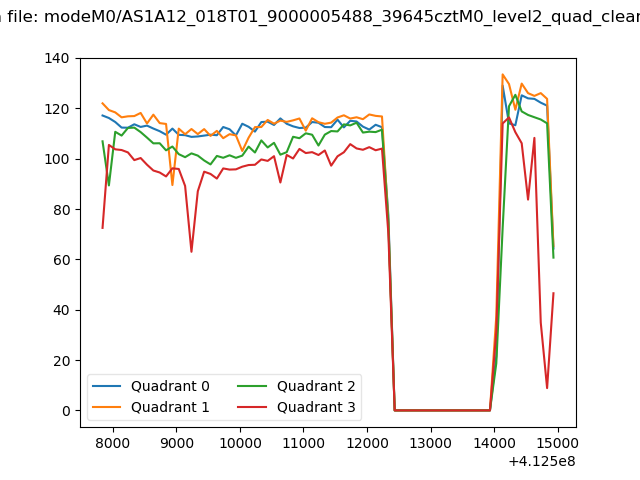 |
|
| Module-wise count rates for Quadrant A Data is divided into 100 sec bins |
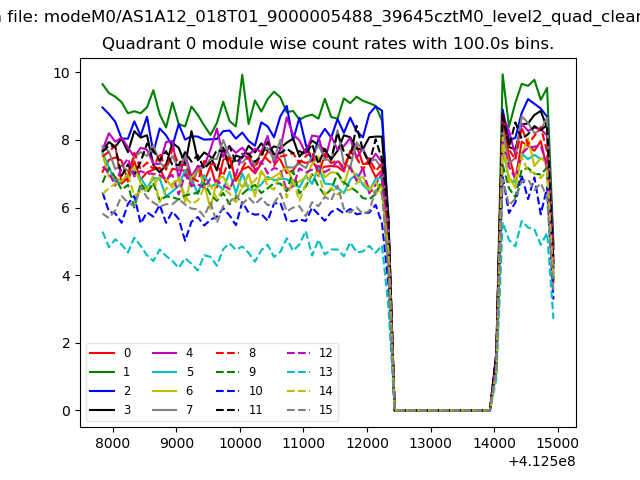 |
 |
| Module-wise count rates for Quadrant B Data is divided into 100 sec bins |
 |
 |
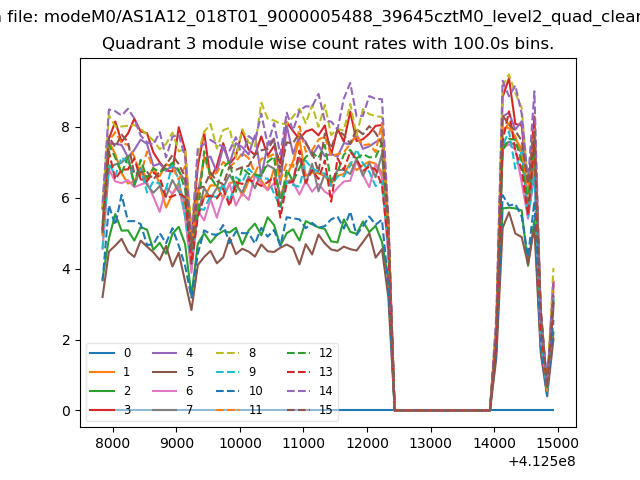
| Module-wise count rates for Quadrant C Data is divided into 100 sec bins |
 |
 |
| Module-wise count rates for Quadrant D Data is divided into 100 sec bins |
 |
 |
| Parameter | Plot |
|---|---|
| CZT HV Monitor | 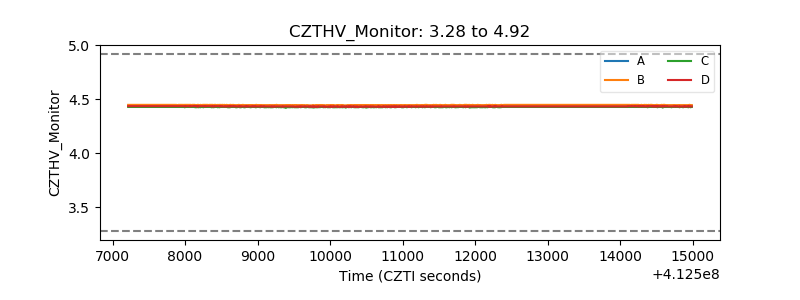 |
| D_VDD | 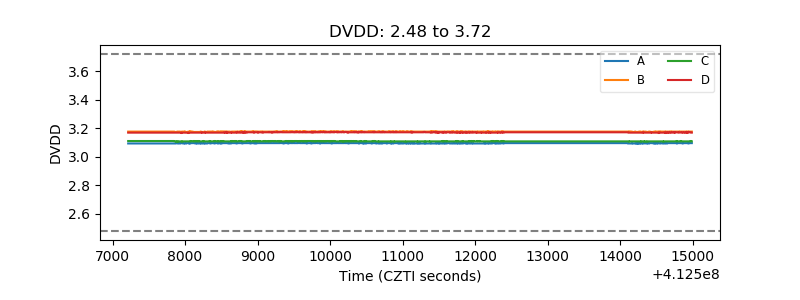 |
| Temperature 1 | 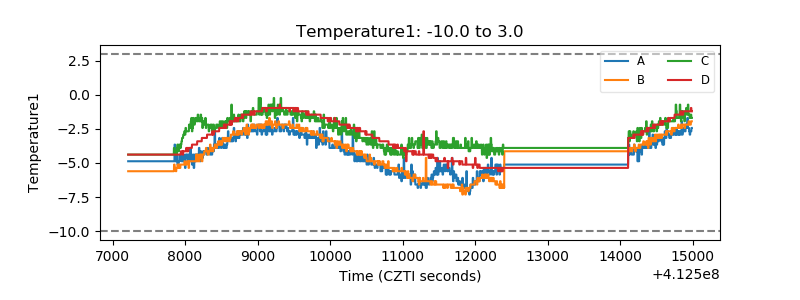 |
| Veto HV Monitor | 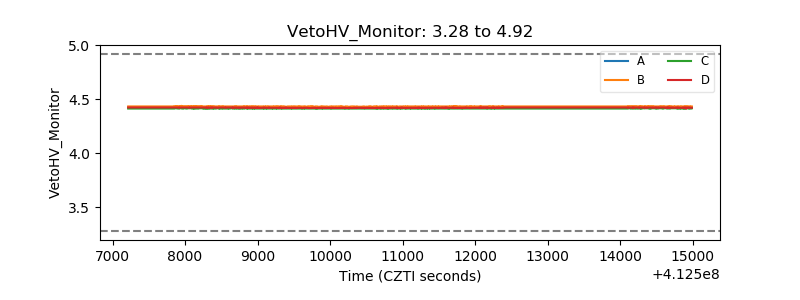 |
| Veto LLD | 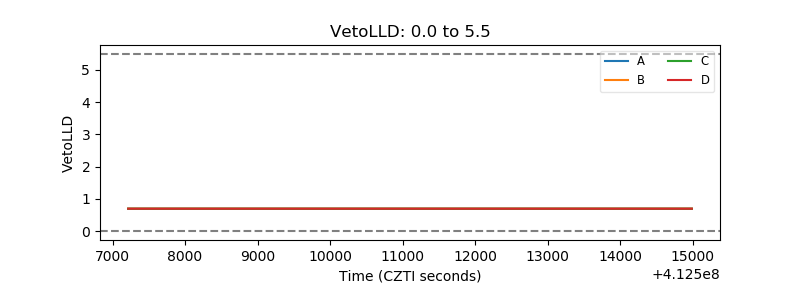 |
| Alpha Counter | 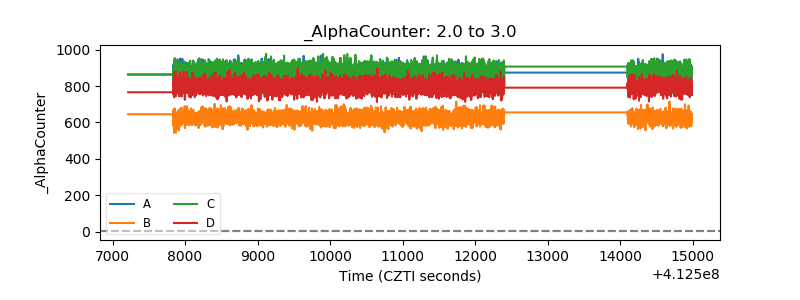 |
| _CPM_Rate | 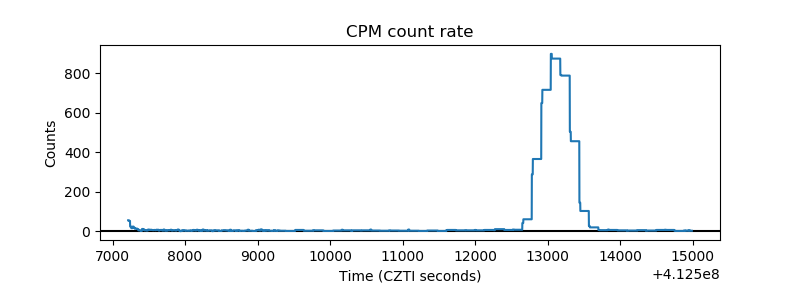 |
| CZT Counter | 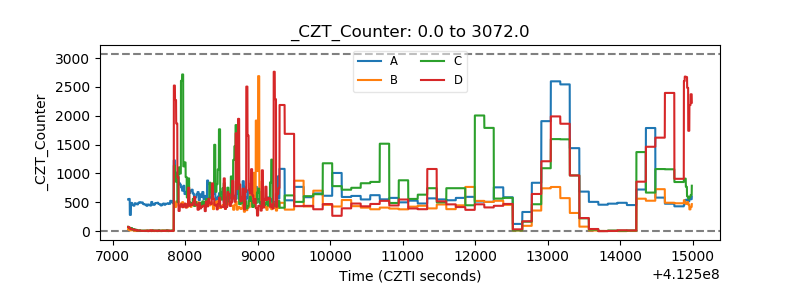 |
| +2.5 Volts monitor | 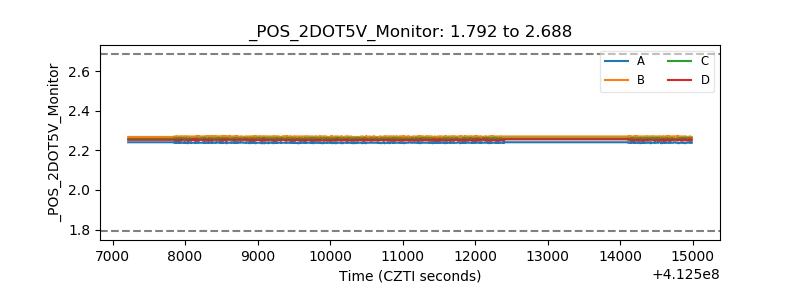 |
| +5 Volts monitor | 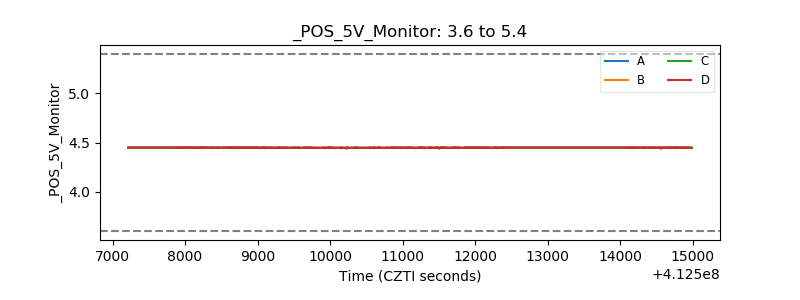 |
| _ROLL_ROT | 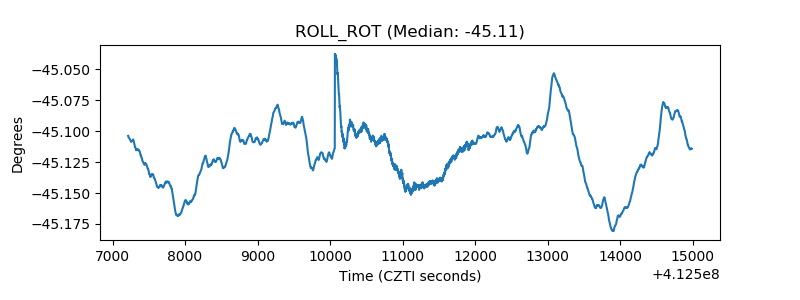 |
| _Roll_DEC | 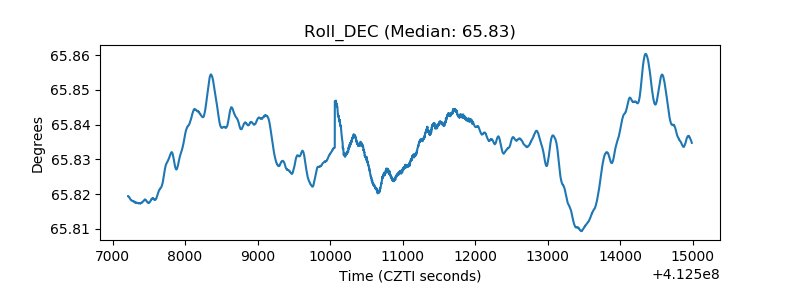 |
| _Roll_RA | 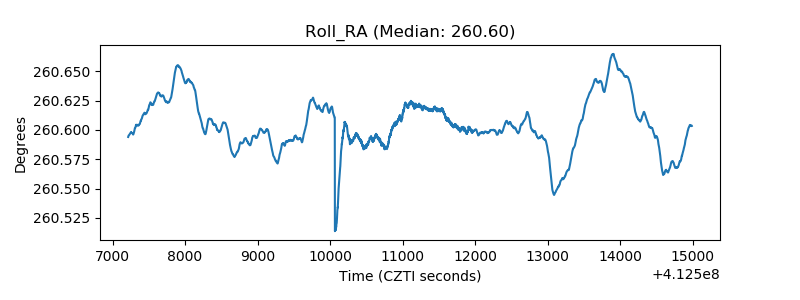 |
| Veto Counter | 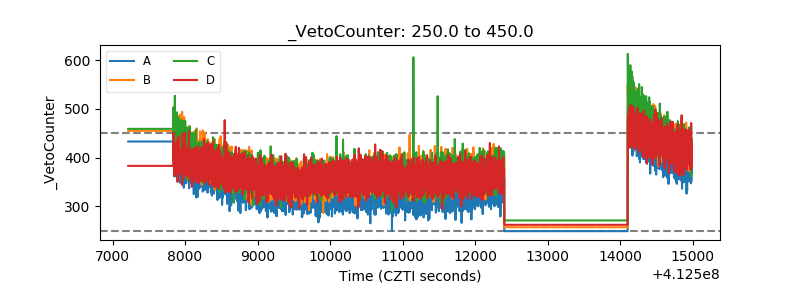 |