| Param | Original file | Final file |
|---|---|---|
| Filename | modeM0/AS1A12_018T01_9000005488_39647cztM0_level2.fits | modeM0/AS1A12_018T01_9000005488_39647cztM0_level2_quad_clean.evt |
| Size (bytes) | 451,604,160 | 89,202,240 |
| Size | 430.7 MB | 85.1 MB |
| Events in quadrant A | 3,952,824 | 620,698 |
| Events in quadrant B | 2,803,473 | 633,212 |
| Events in quadrant C | 4,187,235 | 582,888 |
| Events in quadrant D | 5,369,512 | 499,736 |
| Mode SS | |||
|---|---|---|---|
| Quadrant | BADHDUFLAG | Total packets | Discarded packets |
| A | 0 | 106 | 0 |
| B | 0 | 106 | 0 |
| C | 0 | 106 | 0 |
| D | 0 | 106 | 0 |
| Mode M0 | |||
|---|---|---|---|
| Quadrant | BADHDUFLAG | Total packets | Discarded packets |
| A | 0 | 14943 | 2 |
| B | 0 | 11745 | 1 |
| C | 0 | 15899 | 1 |
| D | 0 | 19506 | 1 |
| Mode M9 | |||
|---|---|---|---|
| Quadrant | BADHDUFLAG | Total packets | Discarded packets |
| A | 0 | 18 | 0 |
| B | 0 | 18 | 0 |
| C | 0 | 18 | 0 |
| D | 0 | 18 | 0 |
| Quadrant | Total seconds | Saturated seconds | Saturation percentage |
|---|---|---|---|
| A | 5203 | 141 | 2.709975% |
| B | 5203 | 66 | 1.268499% |
| C | 5203 | 239 | 4.593504% |
| D | 5203 | 750 | 14.414761% |
Noise dominated data is calculated using 1-second bins in cleaned event files. If a bin has >2000 counts, and if more than 50% of those come from <1% of pixels, then it is considered to be noise-dominated and hence unusable.
| Quadrant | # 1 sec bins | Bins with >0 counts | Bins with >2000 counts | High rate bins dominated by noise | Noise dominated (total time) | Noise dominated (detector-on time) | Marked lightcurve |
|---|---|---|---|---|---|---|---|
| A | 7056 | 5204 | 92 | 92 | 1.30% | 1.77% | 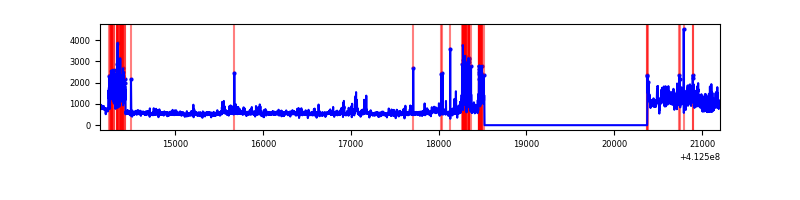 |
| B | 7056 | 5204 | 42 | 42 | 0.60% | 0.81% | 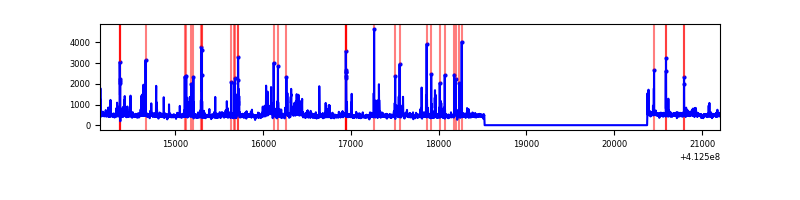 |
| C | 7056 | 5204 | 237 | 237 | 3.36% | 4.55% | 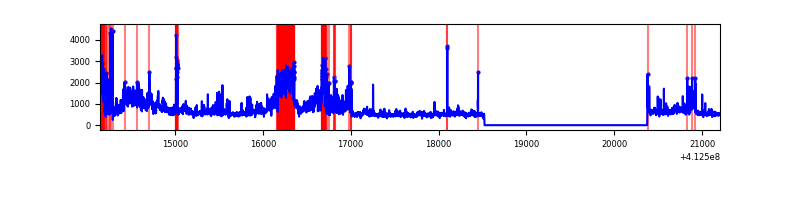 |
| D | 7056 | 5204 | 649 | 649 | 9.20% | 12.47% | 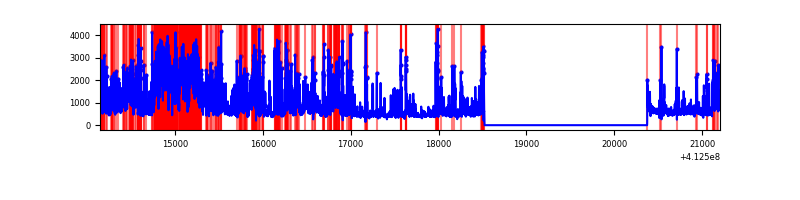 |
Top three noisy pixels from each quadrant. If the there are fewer than three noisy pixels in the level2.evt file, extra rows are filled as -1
| Pixel properties | Quadrant properties | ||||||
|---|---|---|---|---|---|---|---|
| Quadrant | DetID | PixID | Counts | Sigma | Mean | Median | Sigma |
| A | 15 | 222 | 953296 | 8088.8 | 586 | 575 | 117.8 |
| A | 10 | 83 | 418478 | 3548.08 | 586 | 575 | 117.8 |
| A | 15 | 174 | 211541 | 1791.15 | 586 | 575 | 117.8 |
| B | 5 | 172 | 339316 | 3038.15 | 580 | 564 | 111.5 |
| B | 4 | 170 | 58388 | 518.6 | 580 | 564 | 111.5 |
| B | 0 | 230 | 42297 | 374.29 | 580 | 564 | 111.5 |
| C | 9 | 187 | 1648492 | 12607.53 | 565 | 568 | 130.7 |
| C | 15 | 214 | 214542 | 1637.02 | 565 | 568 | 130.7 |
| C | 15 | 208 | 90716 | 689.68 | 565 | 568 | 130.7 |
| D | 12 | 227 | 1744210 | 13108.17 | 550 | 534 | 133.0 |
| D | 13 | 249 | 569504 | 4277.26 | 550 | 534 | 133.0 |
| D | 13 | 171 | 495524 | 3721.11 | 550 | 534 | 133.0 |
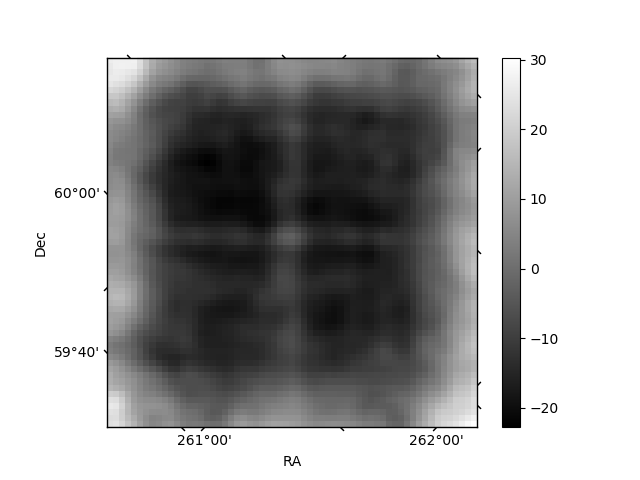
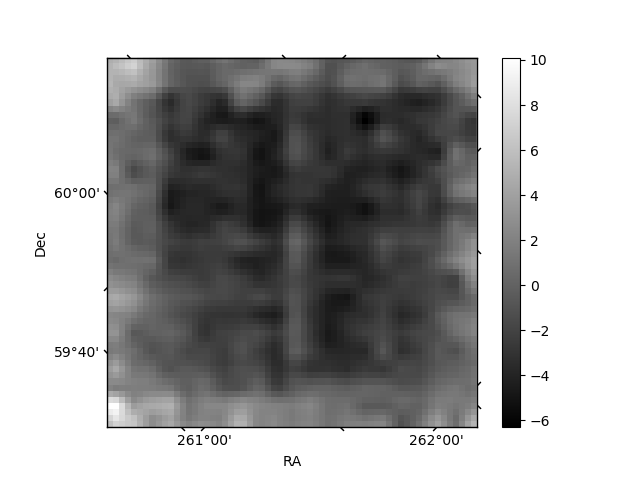
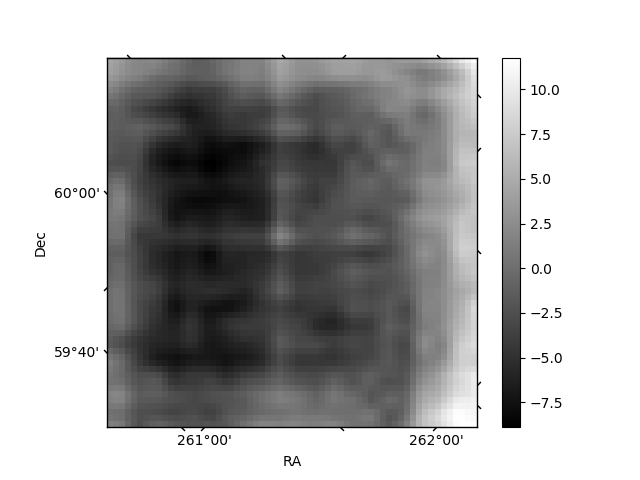
Histogram calculated using DETX and DETY for each event in the final _common_clean file
| Quadrant A | 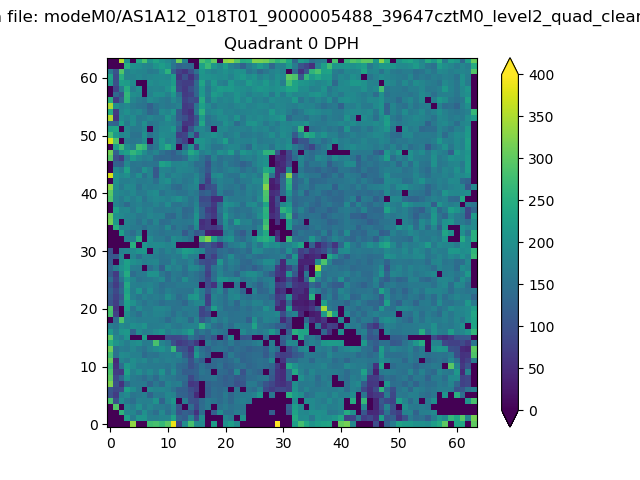 |
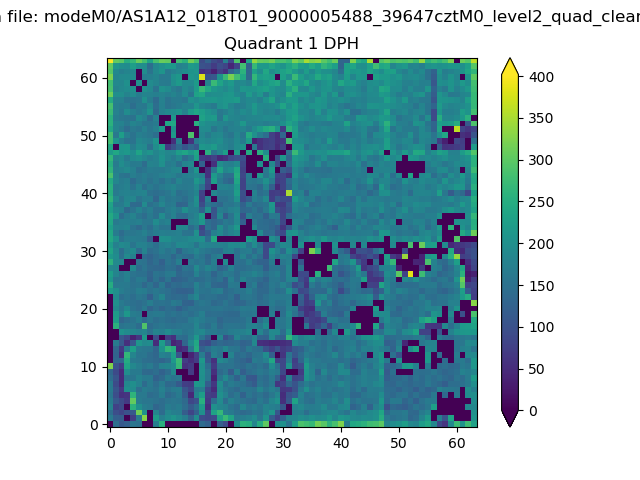 |
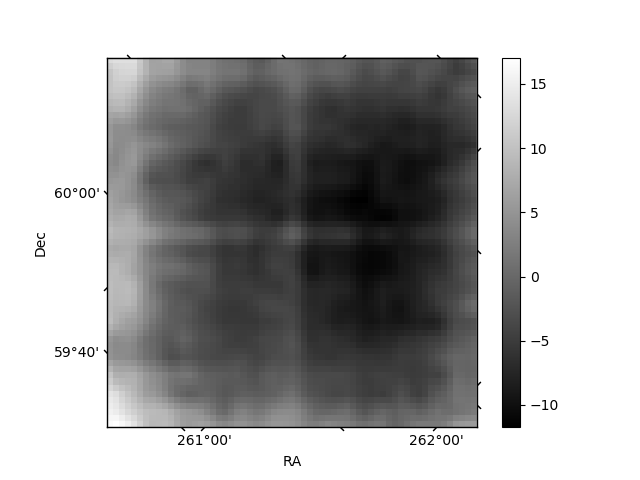
Quadrant B |
|---|---|---|---|
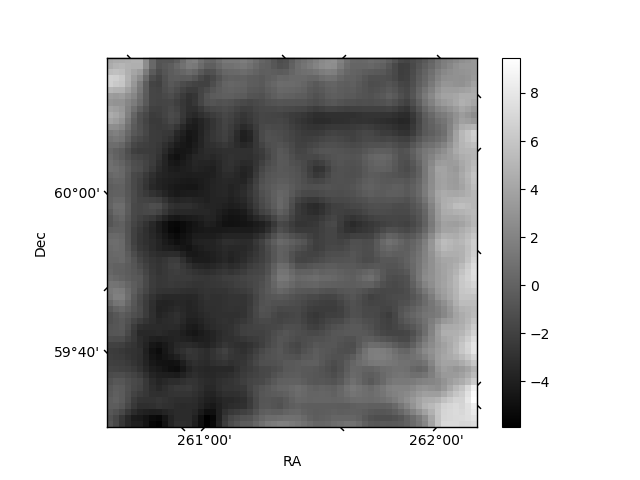
| Quadrant D | 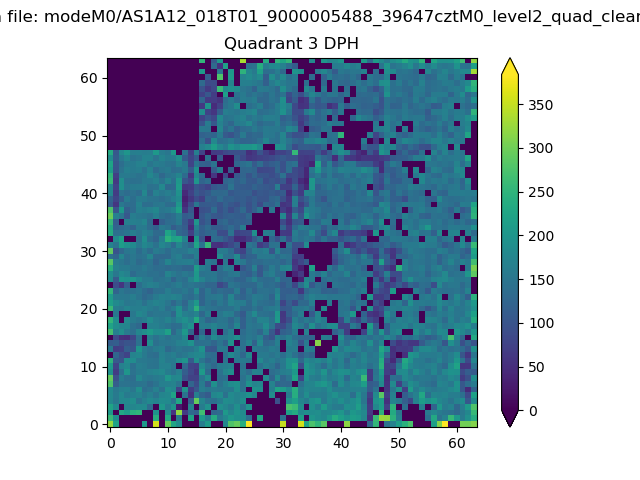 |
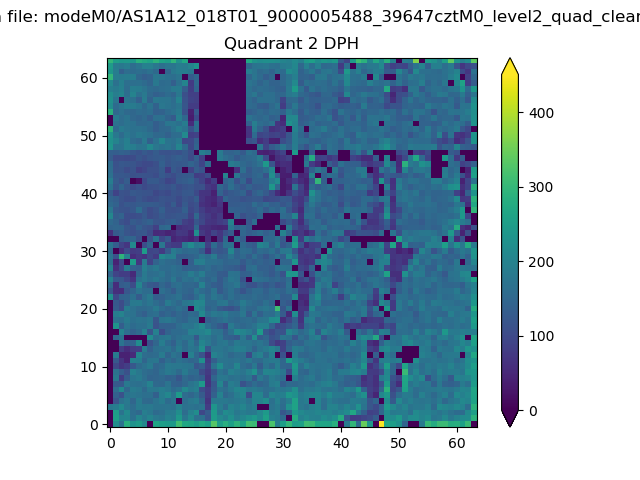 |
Quadrant C |
| Plot type | Count rate plots | Images |
|---|---|---|
| Comparison with Poisson distribution Blue bars denote a histogram of data divided into 1 sec bins. Red curve is a Poisson curve with rate = median count rate of data. |
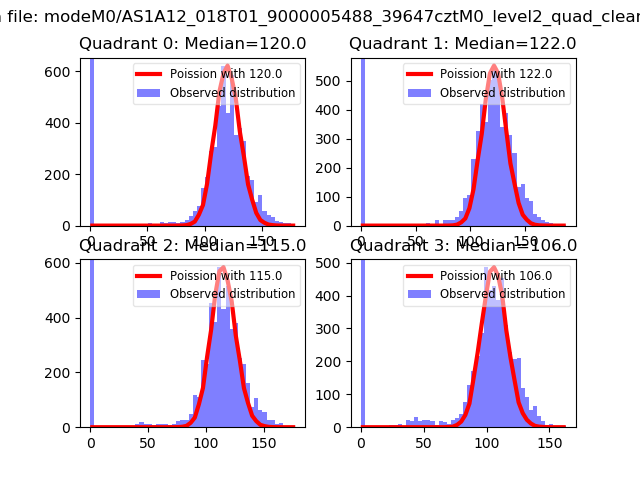 |
 |
| Quadrant-wise count rates Data is divided into 100 sec bins |
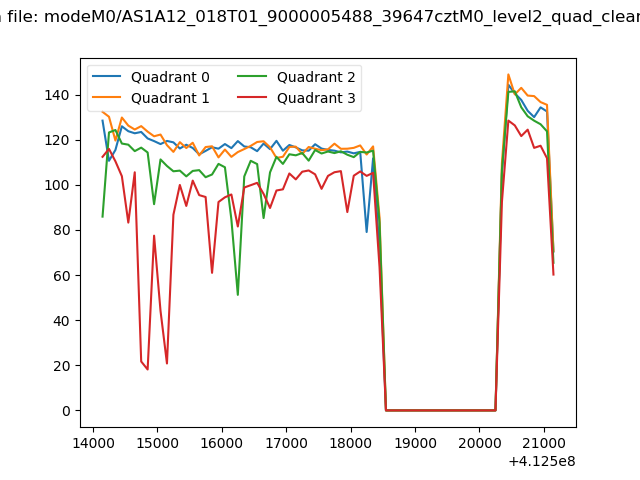 |
|
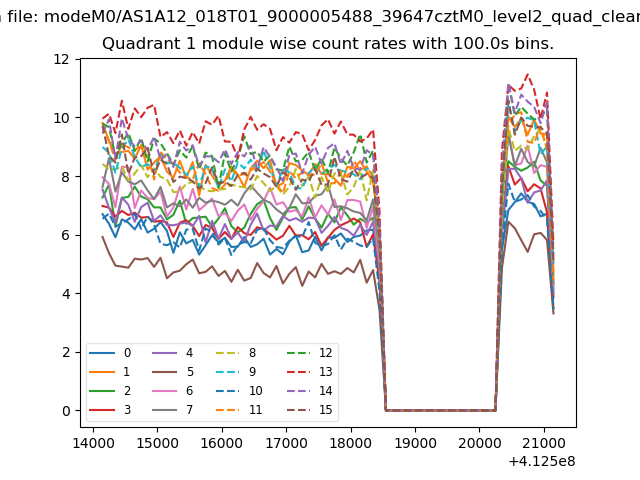
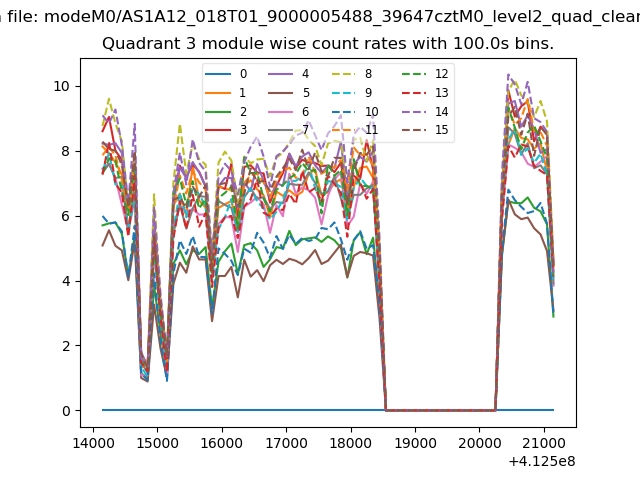
| Module-wise count rates for Quadrant A Data is divided into 100 sec bins |
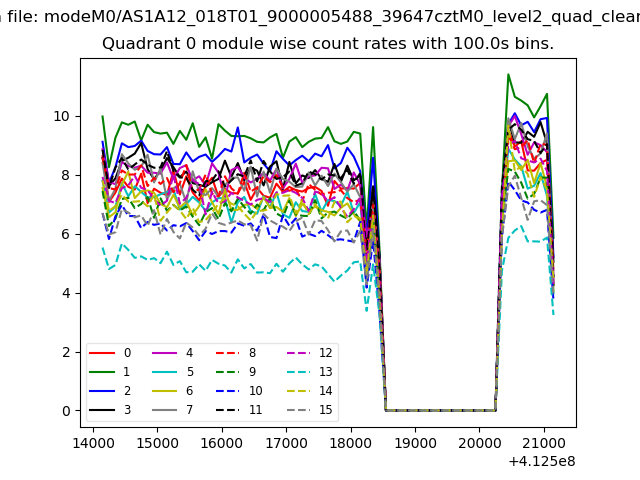 |
 |
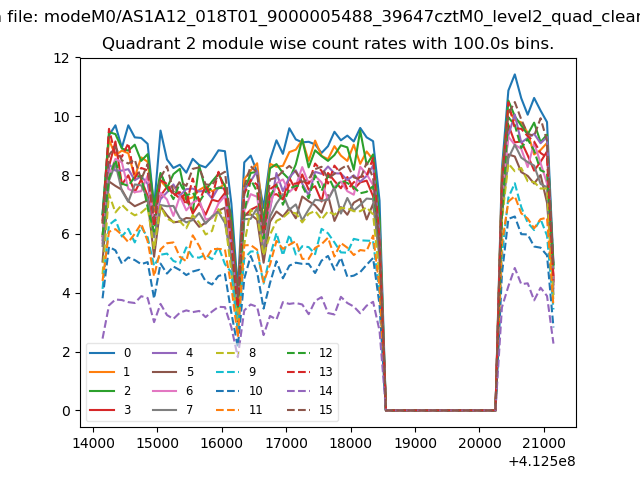
| Module-wise count rates for Quadrant B Data is divided into 100 sec bins |
 |
 |
| Module-wise count rates for Quadrant C Data is divided into 100 sec bins |
 |
 |
| Module-wise count rates for Quadrant D Data is divided into 100 sec bins |
 |
 |
| Parameter | Plot |
|---|---|
| CZT HV Monitor |  |
| D_VDD | 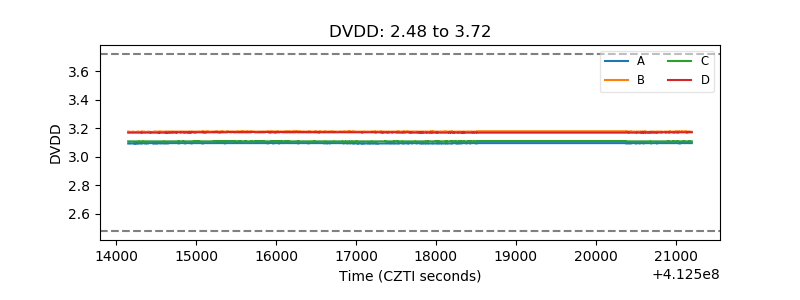 |
| Temperature 1 | 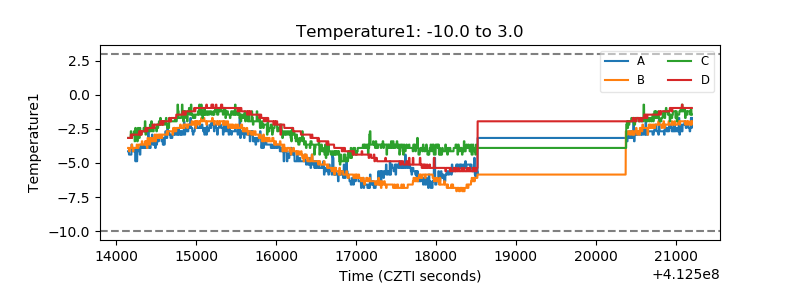 |
| Veto HV Monitor | 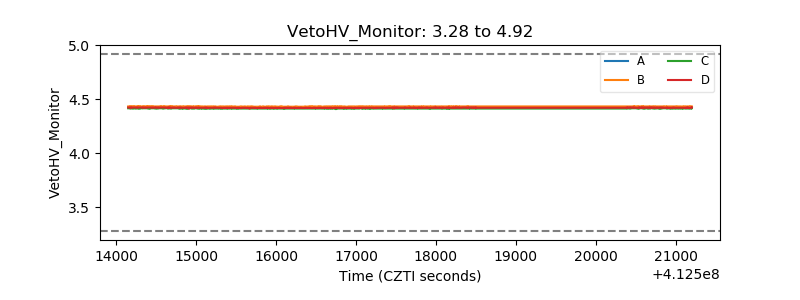 |
| Veto LLD | 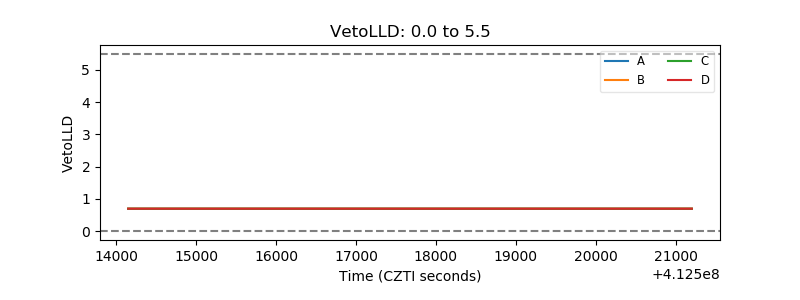 |
| Alpha Counter | 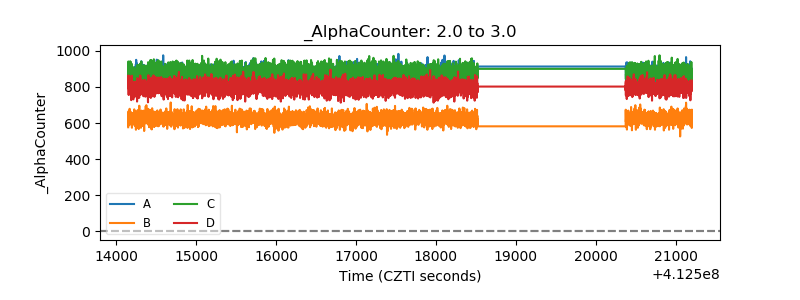 |
| _CPM_Rate | 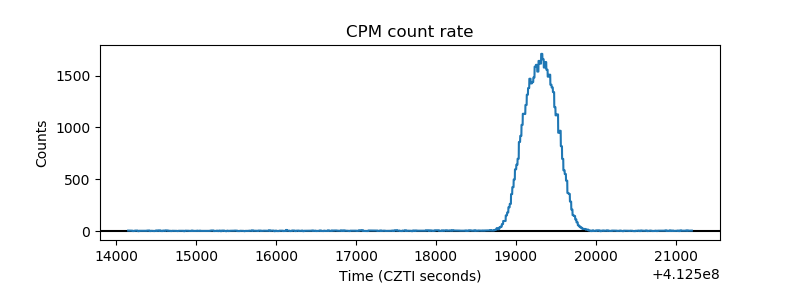 |
| CZT Counter | 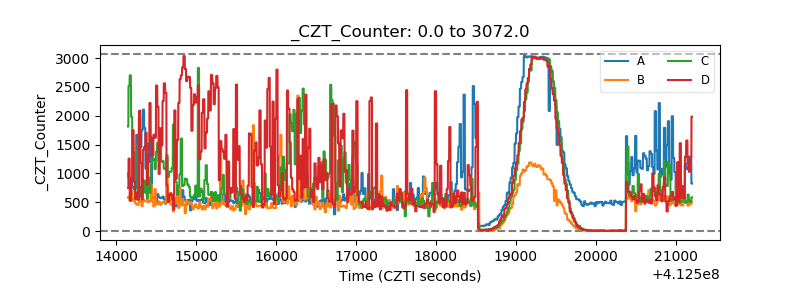 |
| +2.5 Volts monitor | 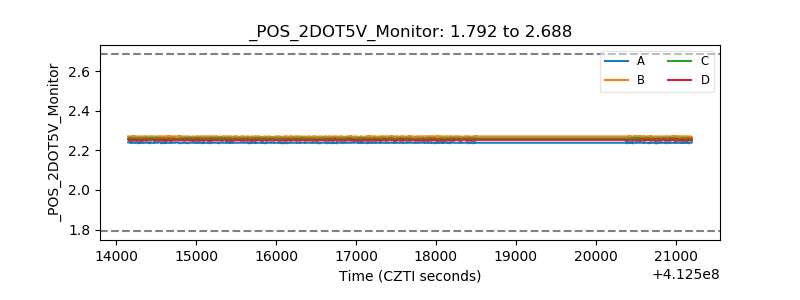 |
| +5 Volts monitor | 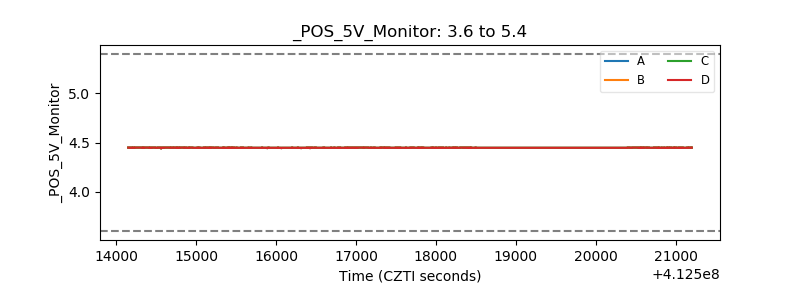 |
| _ROLL_ROT | 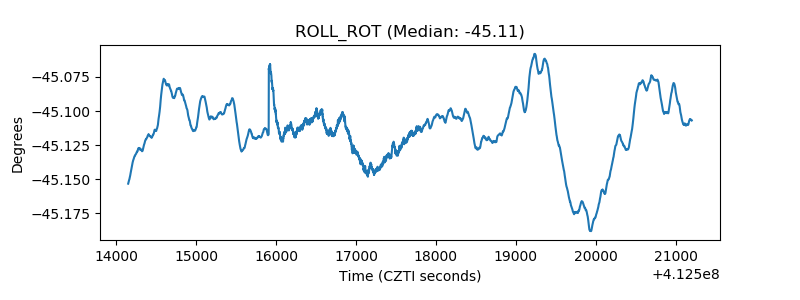 |
| _Roll_DEC | 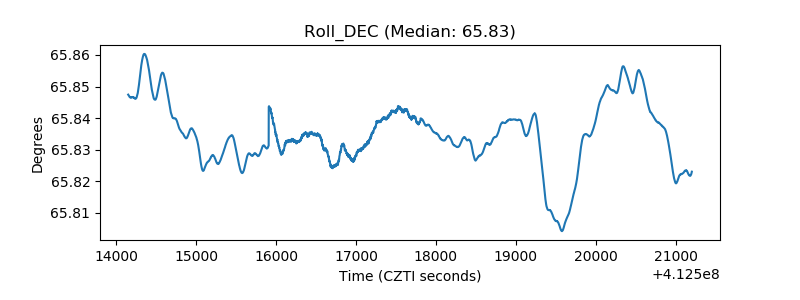 |
| _Roll_RA | 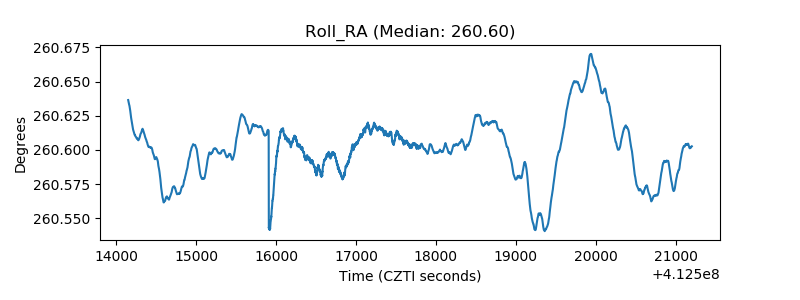 |
| Veto Counter | 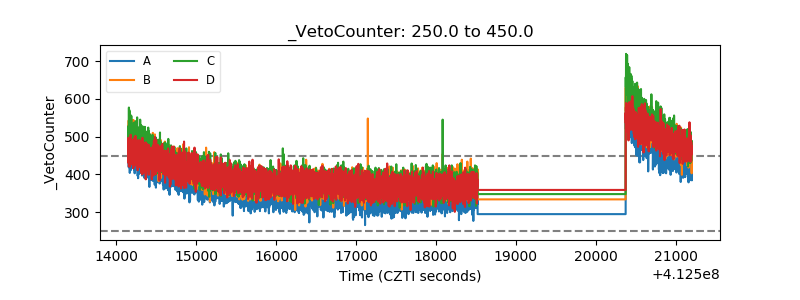 |