| Param | Original file | Final file |
|---|---|---|
| Filename | modeM0/AS1A12_018T01_9000005488_39648cztM0_level2.fits | modeM0/AS1A12_018T01_9000005488_39648cztM0_level2_quad_clean.evt |
| Size (bytes) | 496,336,320 | 98,735,040 |
| Size | 473.3 MB | 94.2 MB |
| Events in quadrant A | 4,206,226 | 687,346 |
| Events in quadrant B | 2,873,014 | 695,398 |
| Events in quadrant C | 4,897,494 | 635,173 |
| Events in quadrant D | 5,978,351 | 594,301 |
| Mode SS | |||
|---|---|---|---|
| Quadrant | BADHDUFLAG | Total packets | Discarded packets |
| A | 0 | 110 | 0 |
| B | 0 | 110 | 0 |
| C | 0 | 110 | 0 |
| D | 0 | 110 | 0 |
| Mode M0 | |||
|---|---|---|---|
| Quadrant | BADHDUFLAG | Total packets | Discarded packets |
| A | 0 | 16317 | 3 |
| B | 0 | 12019 | 2 |
| C | 0 | 18111 | 2 |
| D | 0 | 21557 | 2 |
| Mode M9 | |||
|---|---|---|---|
| Quadrant | BADHDUFLAG | Total packets | Discarded packets |
| A | 0 | 24 | 0 |
| B | 0 | 24 | 0 |
| C | 0 | 24 | 0 |
| D | 0 | 25 | 0 |
| Quadrant | Total seconds | Saturated seconds | Saturation percentage |
|---|---|---|---|
| A | 5393 | 83 | 1.539032% |
| B | 5393 | 77 | 1.427777% |
| C | 5393 | 374 | 6.934916% |
| D | 5393 | 401 | 7.435565% |
Noise dominated data is calculated using 1-second bins in cleaned event files. If a bin has >2000 counts, and if more than 50% of those come from <1% of pixels, then it is considered to be noise-dominated and hence unusable.
| Quadrant | # 1 sec bins | Bins with >0 counts | Bins with >2000 counts | High rate bins dominated by noise | Noise dominated (total time) | Noise dominated (detector-on time) | Marked lightcurve |
|---|---|---|---|---|---|---|---|
| A | 7366 | 5394 | 35 | 35 | 0.48% | 0.65% | 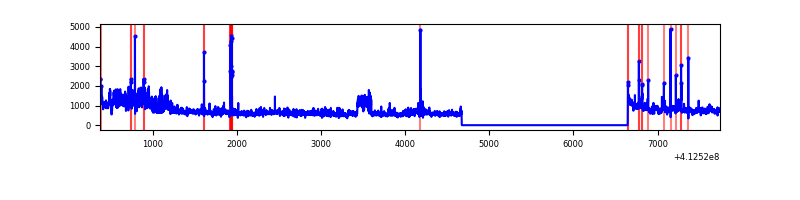 |
| B | 7366 | 5394 | 54 | 54 | 0.73% | 1.00% | 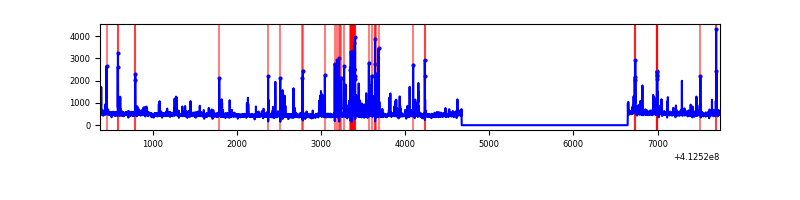 |
| C | 7366 | 5394 | 318 | 318 | 4.32% | 5.90% | 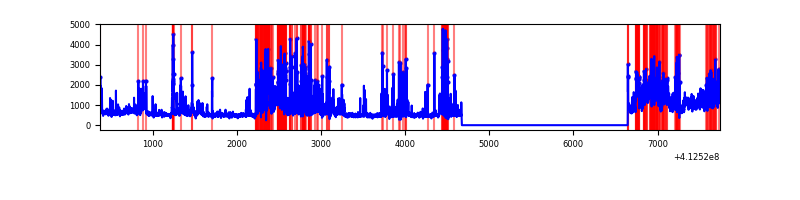 |
| D | 7366 | 5394 | 448 | 448 | 6.08% | 8.31% | 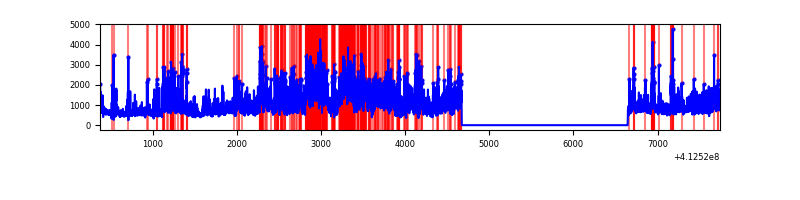 |
Top three noisy pixels from each quadrant. If the there are fewer than three noisy pixels in the level2.evt file, extra rows are filled as -1
| Pixel properties | Quadrant properties | ||||||
|---|---|---|---|---|---|---|---|
| Quadrant | DetID | PixID | Counts | Sigma | Mean | Median | Sigma |
| A | 15 | 222 | 1162754 | 9274.38 | 630 | 618 | 125.3 |
| A | 10 | 83 | 465300 | 3708.38 | 630 | 618 | 125.3 |
| A | 9 | 143 | 100290 | 795.43 | 630 | 618 | 125.3 |
| B | 5 | 172 | 234475 | 1980.61 | 622 | 606 | 118.1 |
| B | 10 | 246 | 115196 | 970.45 | 622 | 606 | 118.1 |
| B | 5 | 255 | 52754 | 441.64 | 622 | 606 | 118.1 |
| C | 9 | 187 | 1227080 | 8789.31 | 606 | 610 | 139.5 |
| C | 15 | 208 | 1032696 | 7396.28 | 606 | 610 | 139.5 |
| C | 15 | 214 | 221612 | 1583.78 | 606 | 610 | 139.5 |
| D | 12 | 227 | 2857977 | 19351.39 | 609 | 593 | 147.7 |
| D | 13 | 249 | 326491 | 2207.11 | 609 | 593 | 147.7 |
| D | 12 | 233 | 122915 | 828.41 | 609 | 593 | 147.7 |
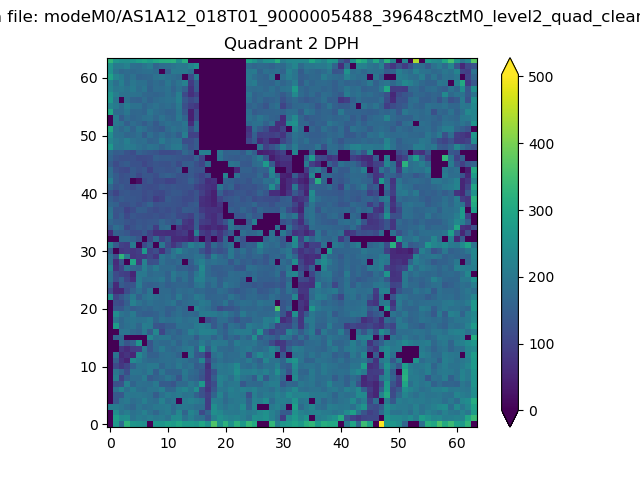
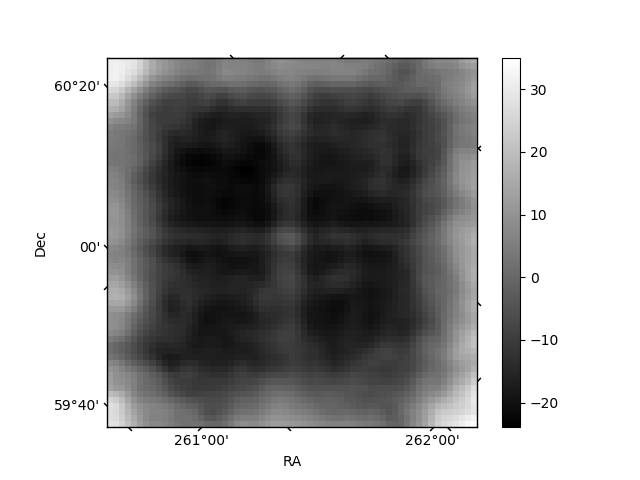
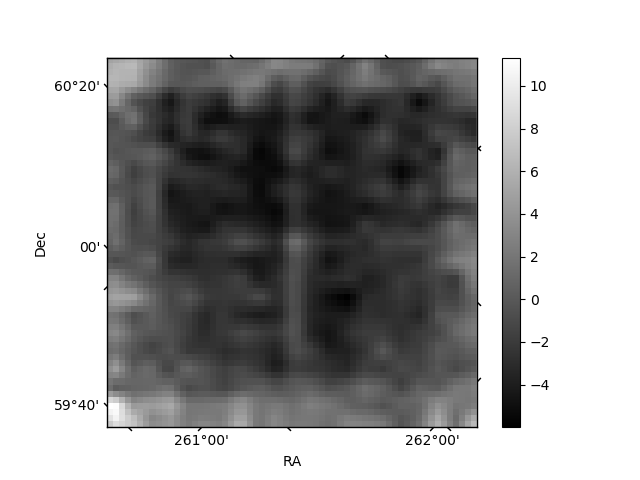
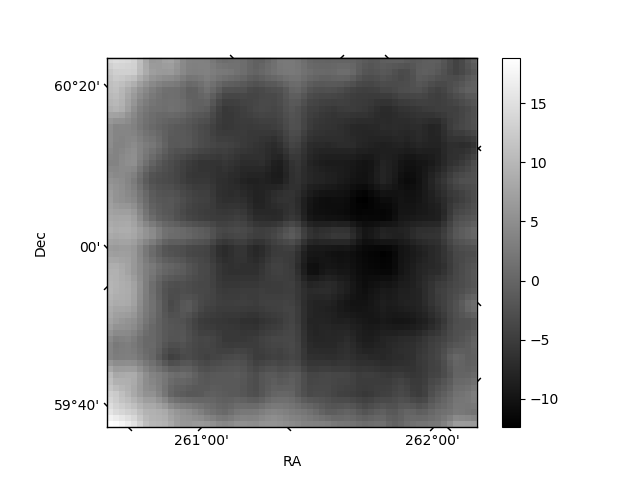
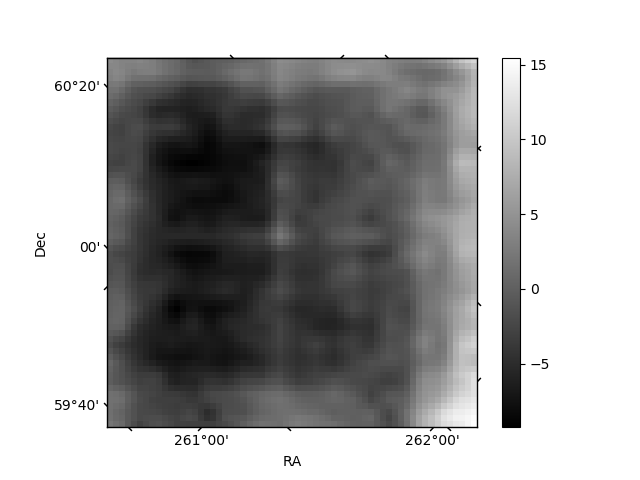
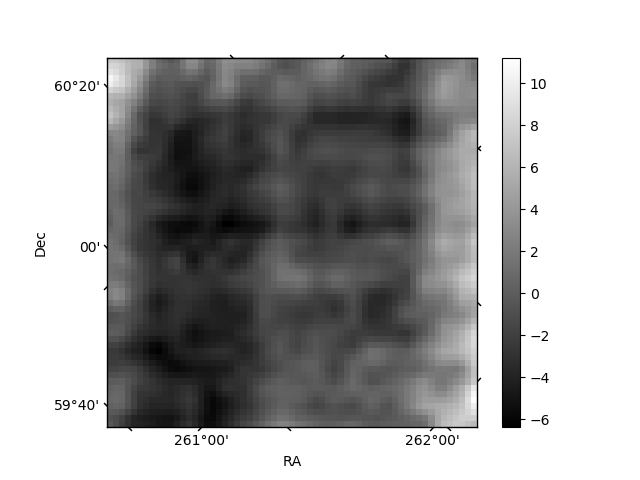
Histogram calculated using DETX and DETY for each event in the final _common_clean file
| Quadrant A | 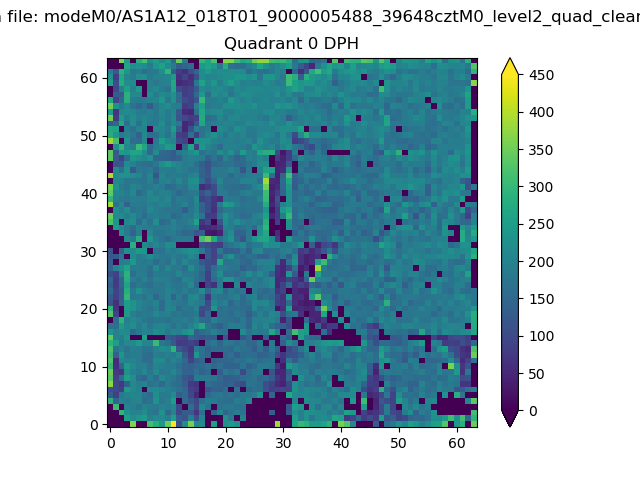 |
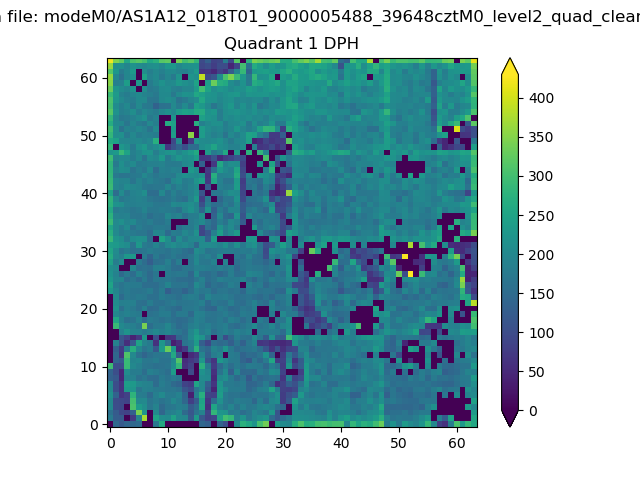 |
Quadrant B |
|---|---|---|---|
| Quadrant D | 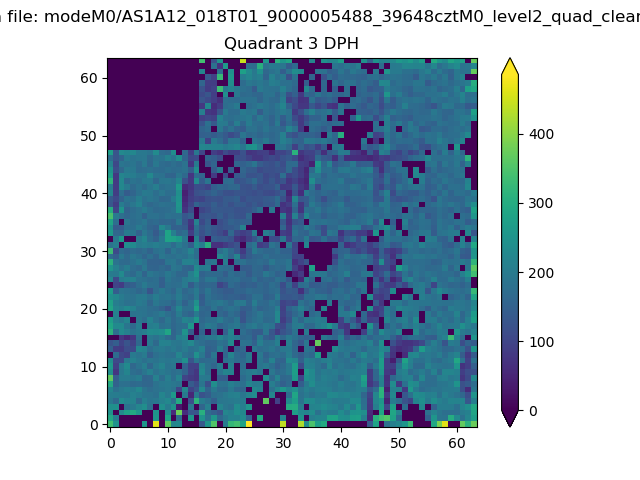 |
 |
Quadrant C |
| Plot type | Count rate plots | Images |
|---|---|---|
| Comparison with Poisson distribution Blue bars denote a histogram of data divided into 1 sec bins. Red curve is a Poisson curve with rate = median count rate of data. |
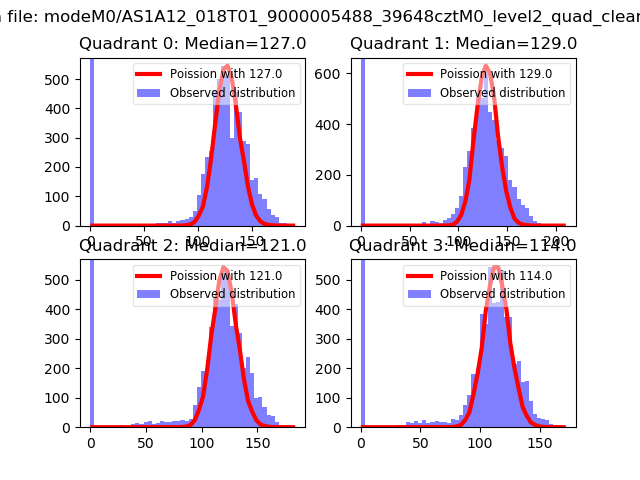 |
 |
| Quadrant-wise count rates Data is divided into 100 sec bins |
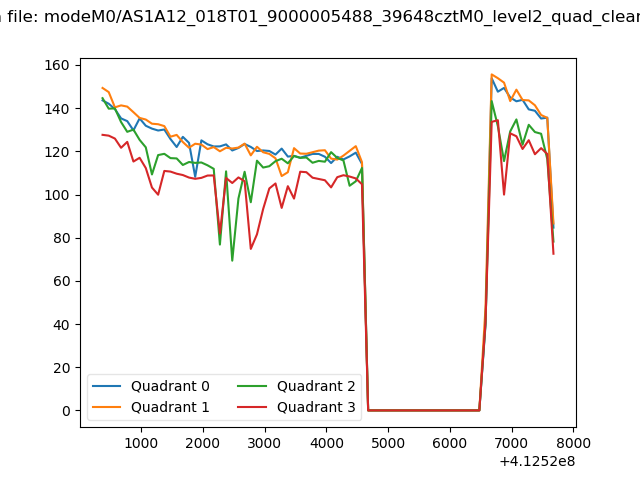 |
|
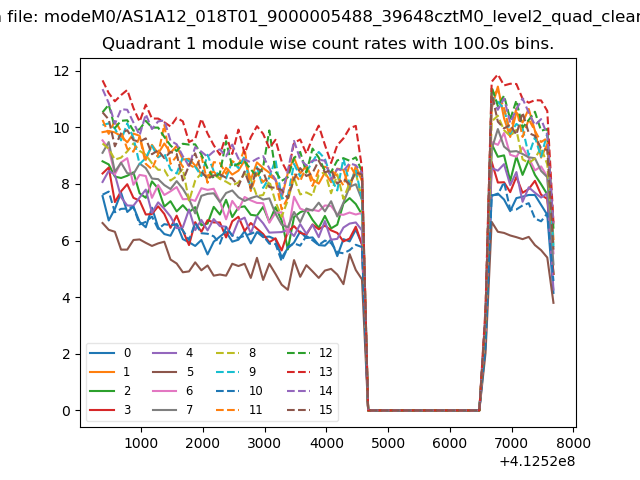
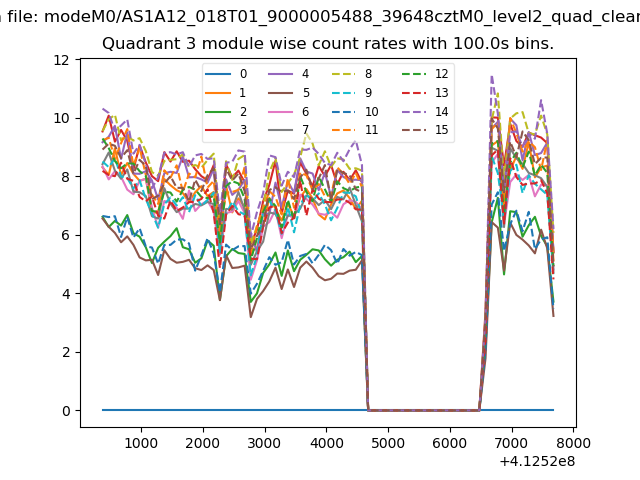
| Module-wise count rates for Quadrant A Data is divided into 100 sec bins |
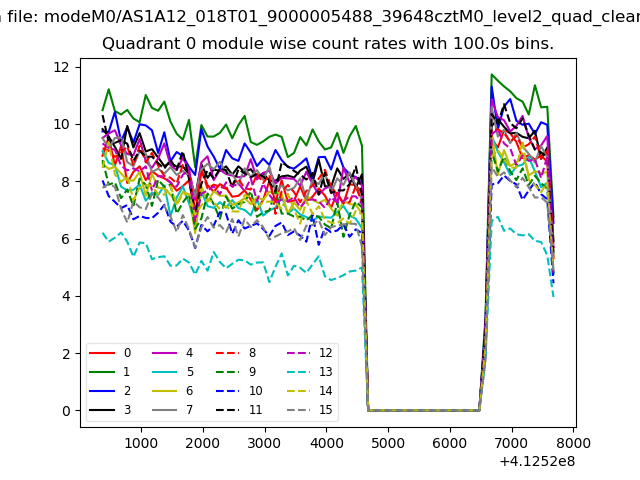 |
 |
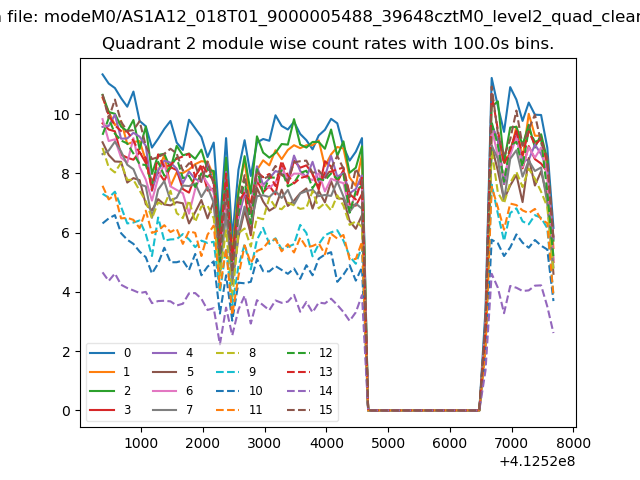
| Module-wise count rates for Quadrant B Data is divided into 100 sec bins |
 |
 |
| Module-wise count rates for Quadrant C Data is divided into 100 sec bins |
 |
 |
| Module-wise count rates for Quadrant D Data is divided into 100 sec bins |
 |
 |
| Parameter | Plot |
|---|---|
| CZT HV Monitor | 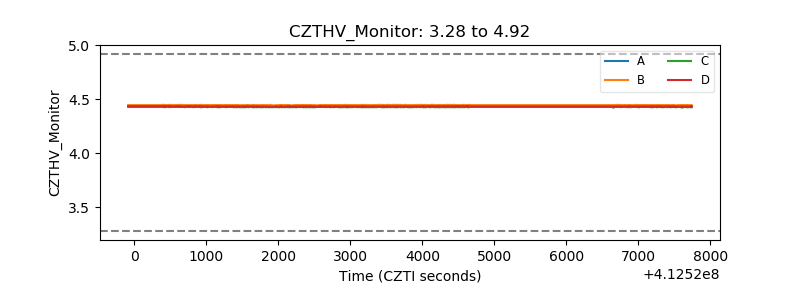 |
| D_VDD | 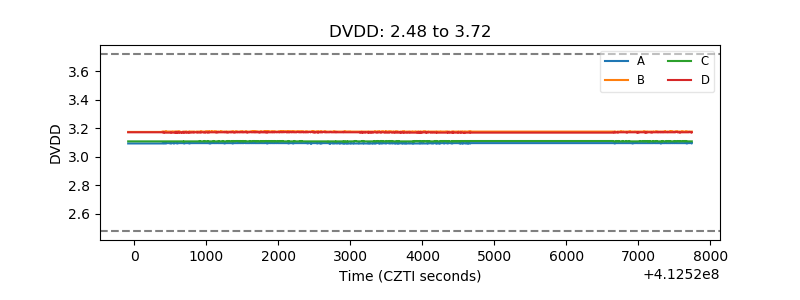 |
| Temperature 1 | 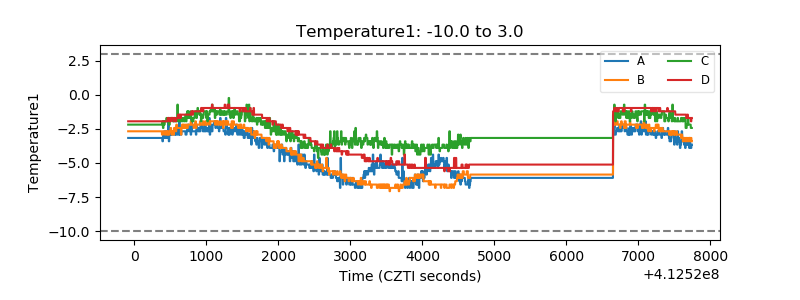 |
| Veto HV Monitor | 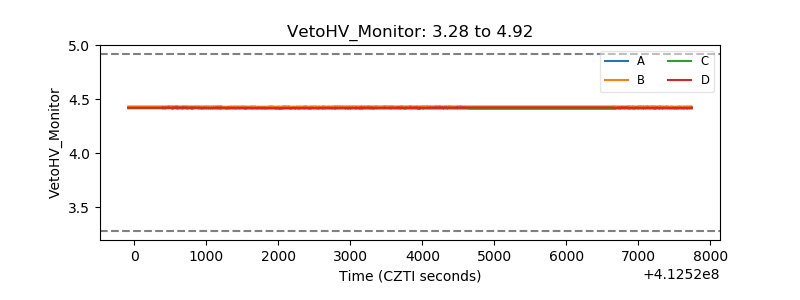 |
| Veto LLD | 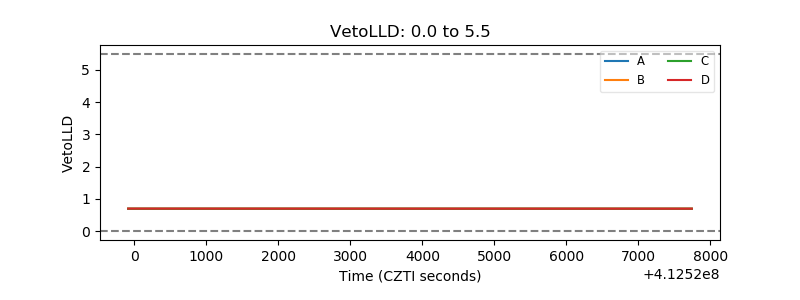 |
| Alpha Counter | 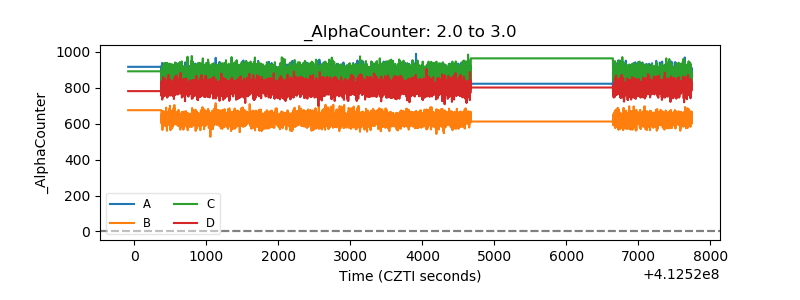 |
| _CPM_Rate | 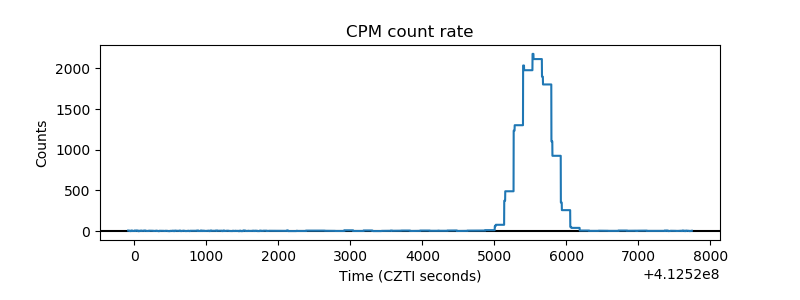 |
| CZT Counter | 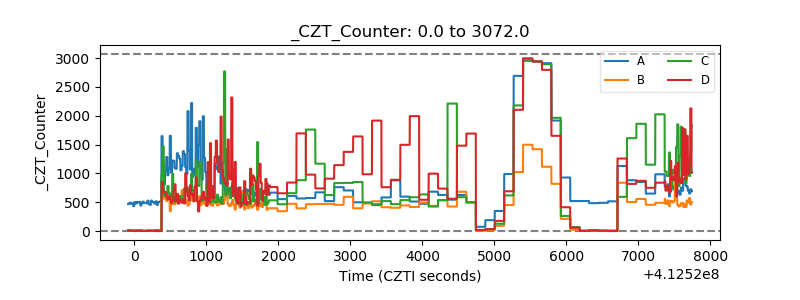 |
| +2.5 Volts monitor | 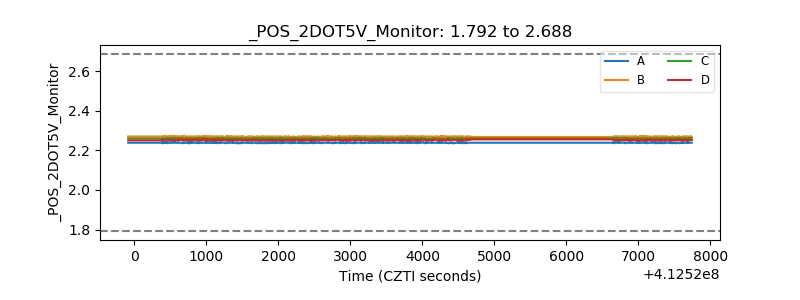 |
| +5 Volts monitor | 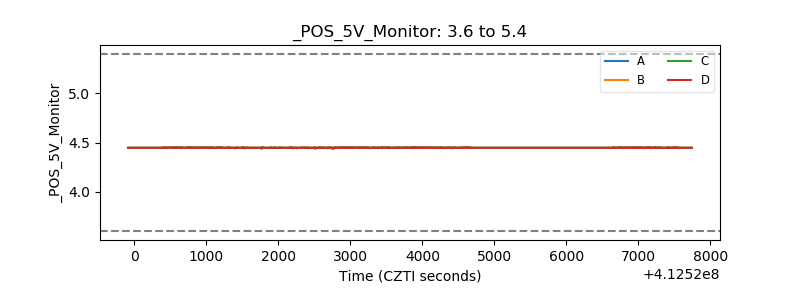 |
| _ROLL_ROT | 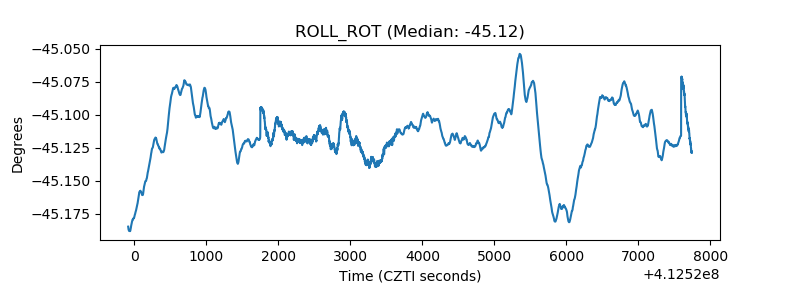 |
| _Roll_DEC | 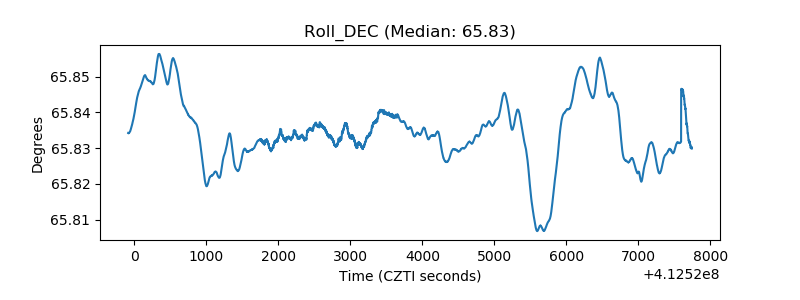 |
| _Roll_RA | 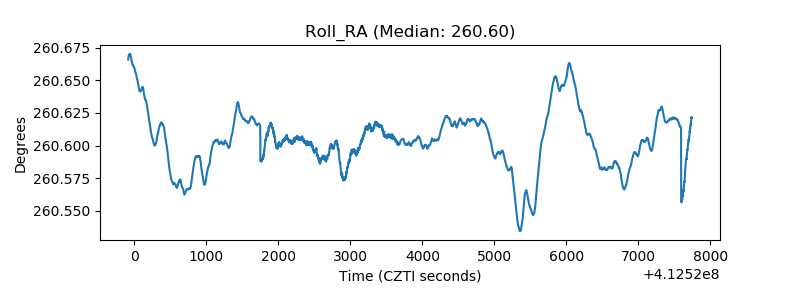 |
| Veto Counter | 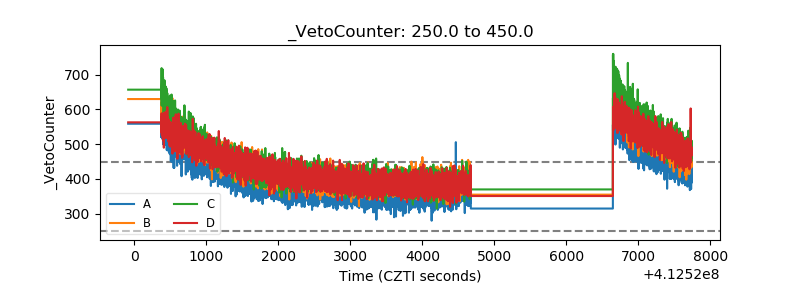 |