| Param | Original file | Final file |
|---|---|---|
| Filename | modeM0/AS1A12_018T01_9000005488_39649cztM0_level2.fits | modeM0/AS1A12_018T01_9000005488_39649cztM0_level2_quad_clean.evt |
| Size (bytes) | 479,355,840 | 96,405,120 |
| Size | 457.1 MB | 91.9 MB |
| Events in quadrant A | 4,396,488 | 669,336 |
| Events in quadrant B | 2,768,826 | 677,998 |
| Events in quadrant C | 5,615,862 | 623,902 |
| Events in quadrant D | 4,567,851 | 590,244 |
| Mode SS | |||
|---|---|---|---|
| Quadrant | BADHDUFLAG | Total packets | Discarded packets |
| A | 0 | 104 | 0 |
| B | 0 | 104 | 0 |
| C | 0 | 104 | 0 |
| D | 0 | 104 | 0 |
| Mode M0 | |||
|---|---|---|---|
| Quadrant | BADHDUFLAG | Total packets | Discarded packets |
| A | 0 | 16919 | 3 |
| B | 0 | 11474 | 2 |
| C | 0 | 20236 | 2 |
| D | 0 | 17180 | 2 |
| Mode M9 | |||
|---|---|---|---|
| Quadrant | BADHDUFLAG | Total packets | Discarded packets |
| A | 0 | 21 | 0 |
| B | 0 | 21 | 0 |
| C | 0 | 21 | 0 |
| D | 0 | 21 | 0 |
| Quadrant | Total seconds | Saturated seconds | Saturation percentage |
|---|---|---|---|
| A | 5107 | 68 | 1.331506% |
| B | 5107 | 75 | 1.468573% |
| C | 5107 | 384 | 7.519091% |
| D | 5107 | 189 | 3.700803% |
Noise dominated data is calculated using 1-second bins in cleaned event files. If a bin has >2000 counts, and if more than 50% of those come from <1% of pixels, then it is considered to be noise-dominated and hence unusable.
| Quadrant | # 1 sec bins | Bins with >0 counts | Bins with >2000 counts | High rate bins dominated by noise | Noise dominated (total time) | Noise dominated (detector-on time) | Marked lightcurve |
|---|---|---|---|---|---|---|---|
| A | 7201 | 5108 | 35 | 35 | 0.49% | 0.69% | 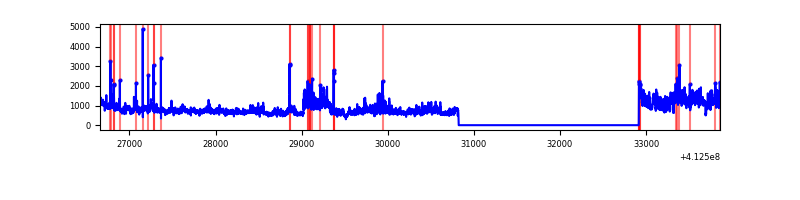 |
| B | 7201 | 5108 | 51 | 51 | 0.71% | 1.00% | 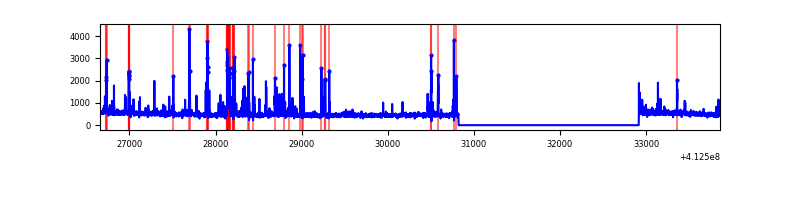 |
| C | 7201 | 5108 | 359 | 359 | 4.99% | 7.03% | 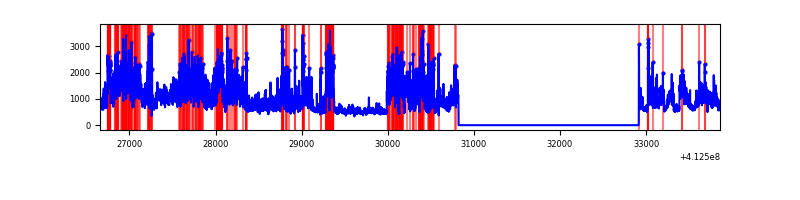 |
| D | 7201 | 5108 | 182 | 182 | 2.53% | 3.56% | 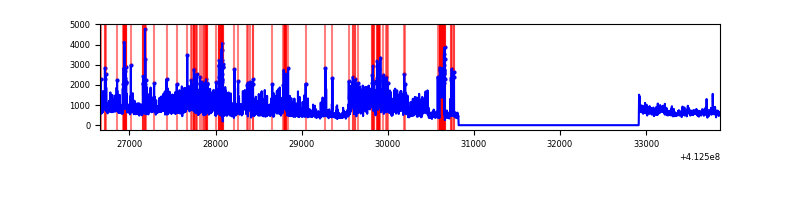 |
Top three noisy pixels from each quadrant. If the there are fewer than three noisy pixels in the level2.evt file, extra rows are filled as -1
| Pixel properties | Quadrant properties | ||||||
|---|---|---|---|---|---|---|---|
| Quadrant | DetID | PixID | Counts | Sigma | Mean | Median | Sigma |
| A | 15 | 222 | 1467360 | 12161.05 | 602 | 591 | 120.6 |
| A | 10 | 83 | 439373 | 3637.96 | 602 | 591 | 120.6 |
| A | 15 | 174 | 77563 | 638.18 | 602 | 591 | 120.6 |
| B | 5 | 172 | 165607 | 1475.01 | 597 | 583 | 111.9 |
| B | 10 | 246 | 138452 | 1232.3 | 597 | 583 | 111.9 |
| B | 5 | 255 | 85673 | 760.55 | 597 | 583 | 111.9 |
| C | 15 | 208 | 1668430 | 12292.7 | 587 | 591 | 135.7 |
| C | 9 | 187 | 1409009 | 10380.66 | 587 | 591 | 135.7 |
| C | 15 | 214 | 209697 | 1541.2 | 587 | 591 | 135.7 |
| D | 12 | 227 | 1670461 | 11852.08 | 588 | 575 | 140.9 |
| D | 13 | 249 | 308309 | 2184.15 | 588 | 575 | 140.9 |
| D | 13 | 174 | 83973 | 591.92 | 588 | 575 | 140.9 |
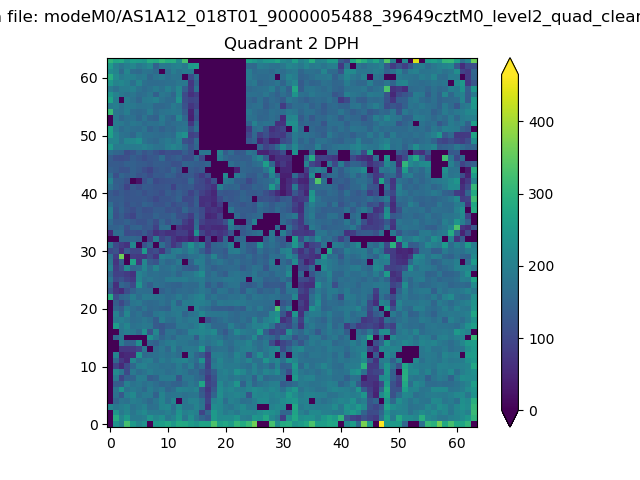
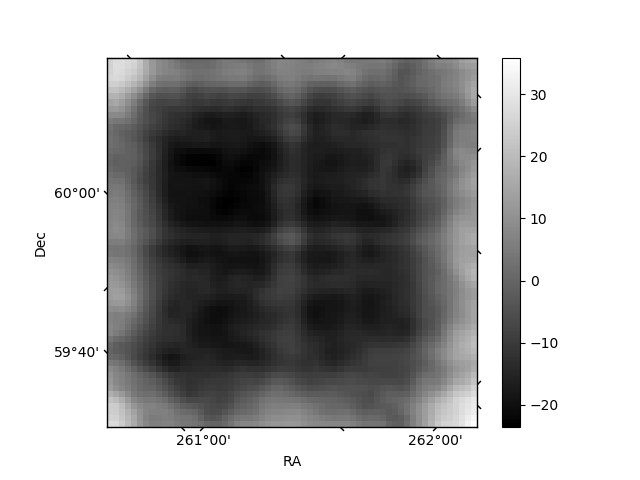
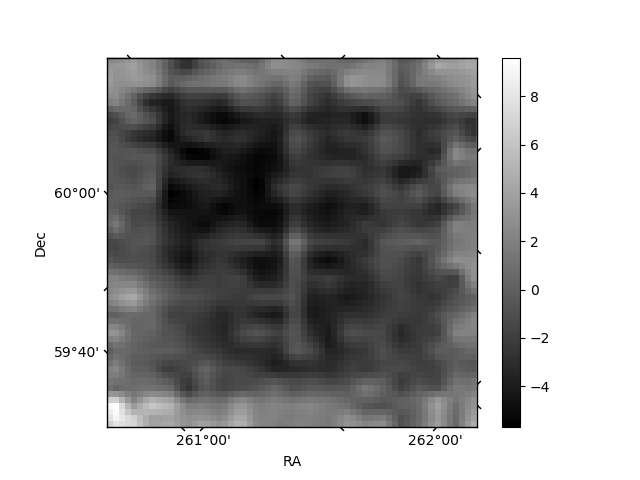
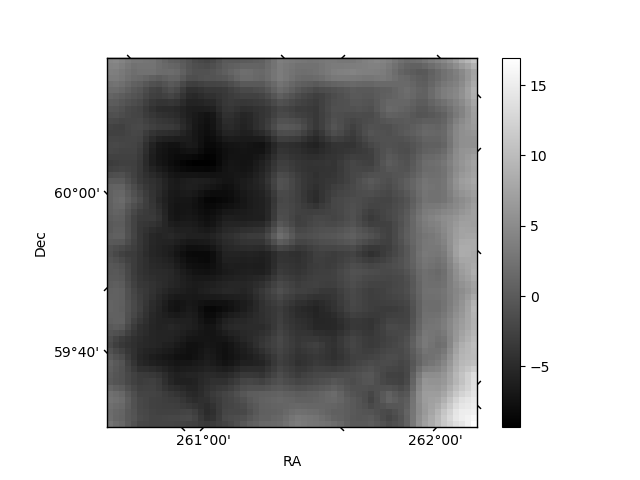
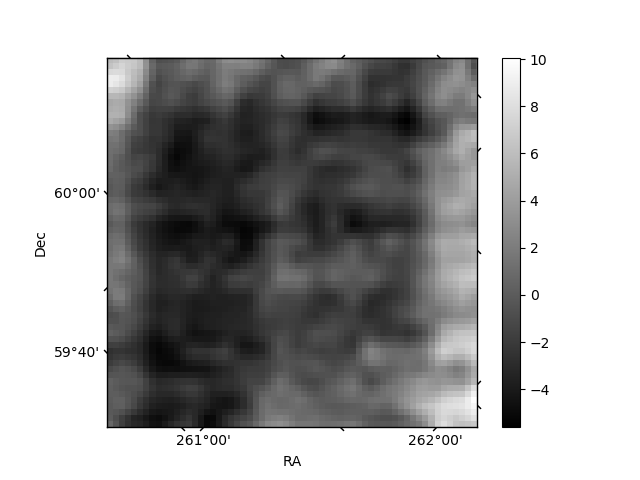
Histogram calculated using DETX and DETY for each event in the final _common_clean file
| Quadrant A | 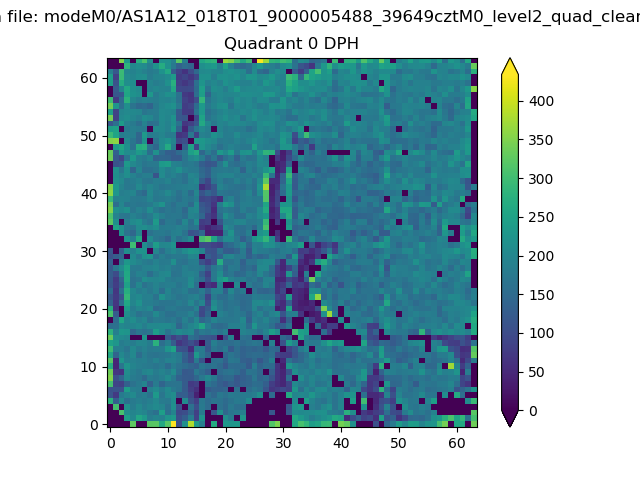 |
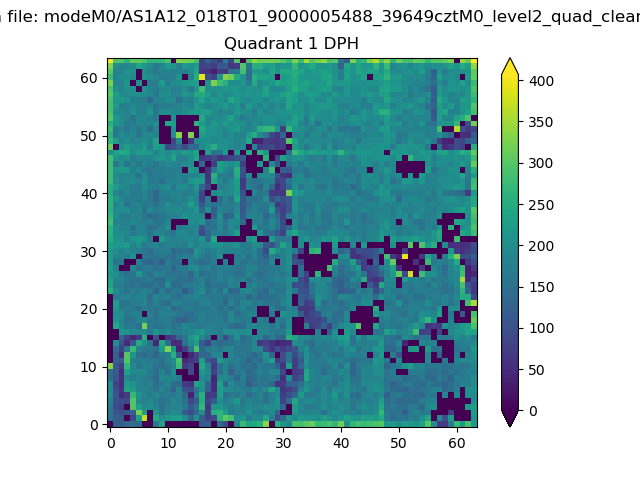 |
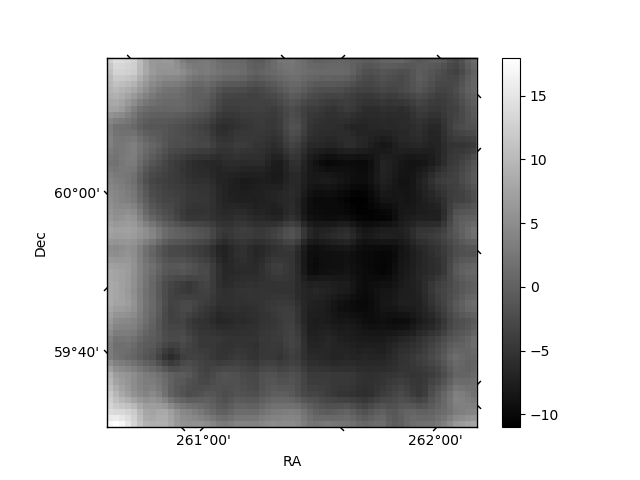
Quadrant B |
|---|---|---|---|
| Quadrant D | 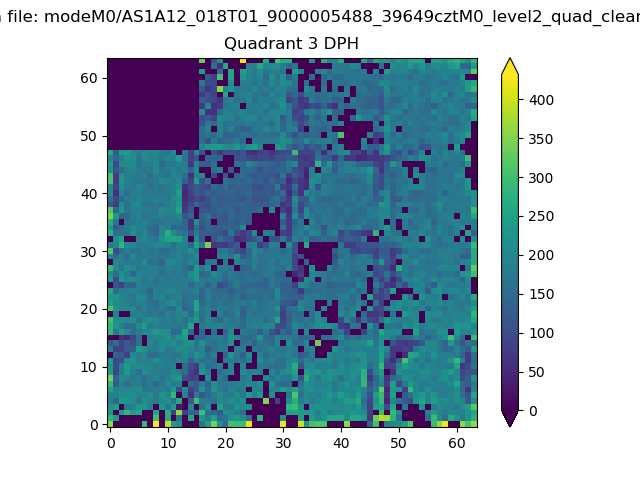 |
 |
Quadrant C |
| Plot type | Count rate plots | Images |
|---|---|---|
| Comparison with Poisson distribution Blue bars denote a histogram of data divided into 1 sec bins. Red curve is a Poisson curve with rate = median count rate of data. |
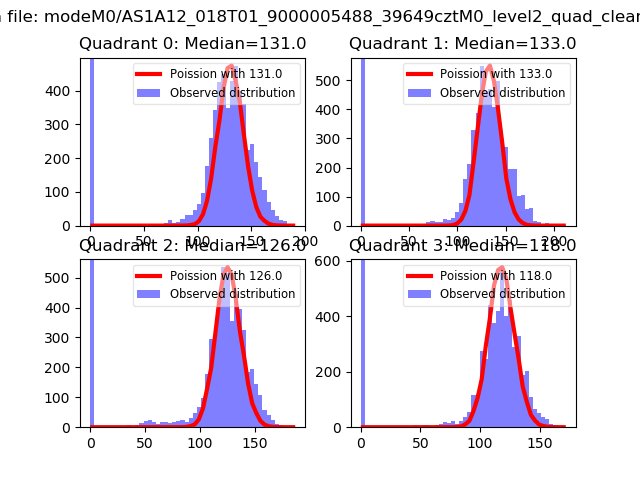 |
 |
| Quadrant-wise count rates Data is divided into 100 sec bins |
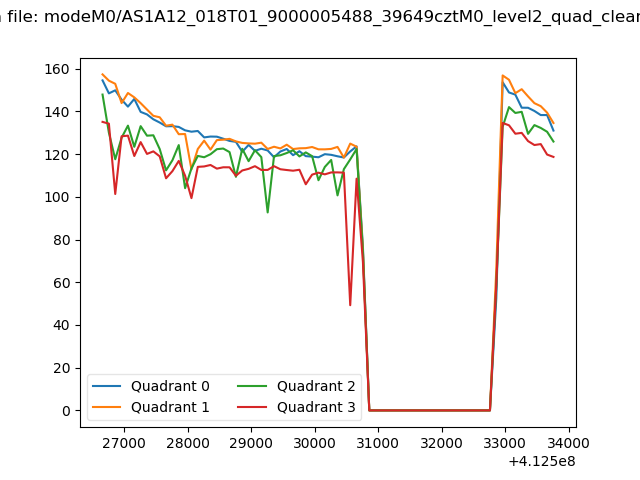 |
|
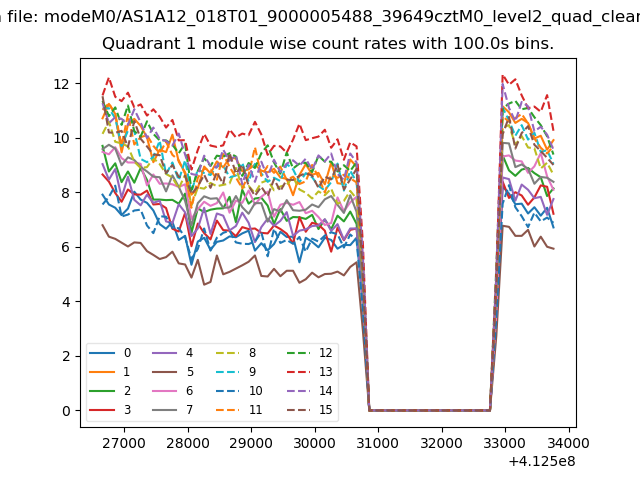
| Module-wise count rates for Quadrant A Data is divided into 100 sec bins |
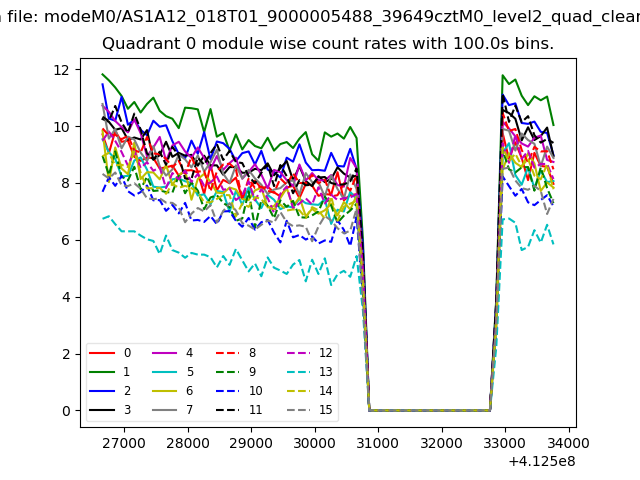 |
 |
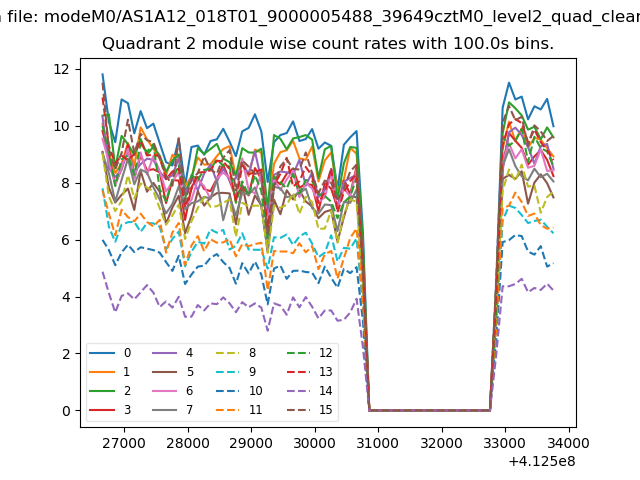
| Module-wise count rates for Quadrant B Data is divided into 100 sec bins |
 |
 |
| Module-wise count rates for Quadrant C Data is divided into 100 sec bins |
 |
 |
| Module-wise count rates for Quadrant D Data is divided into 100 sec bins |
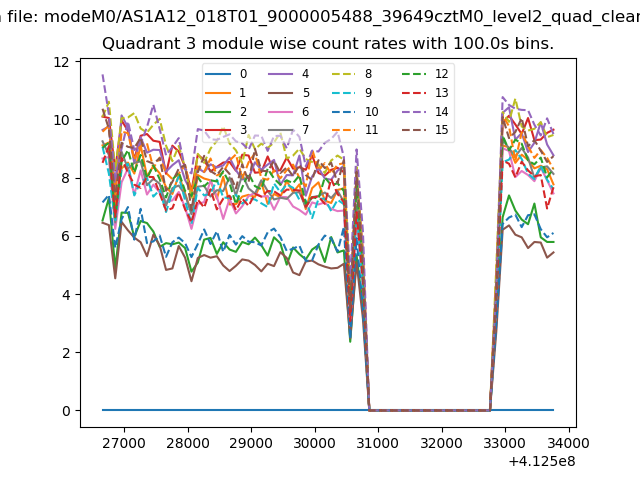 |
 |
| Parameter | Plot |
|---|---|
| CZT HV Monitor |  |
| D_VDD | 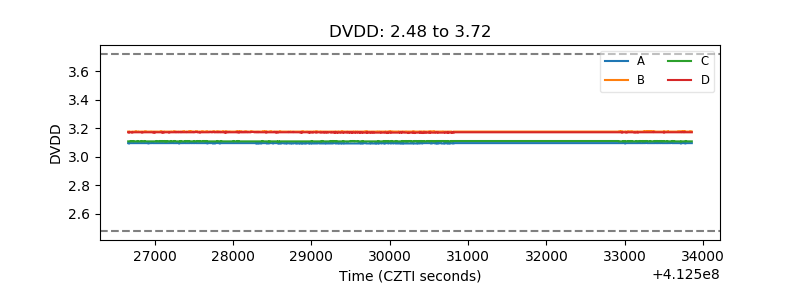 |
| Temperature 1 | 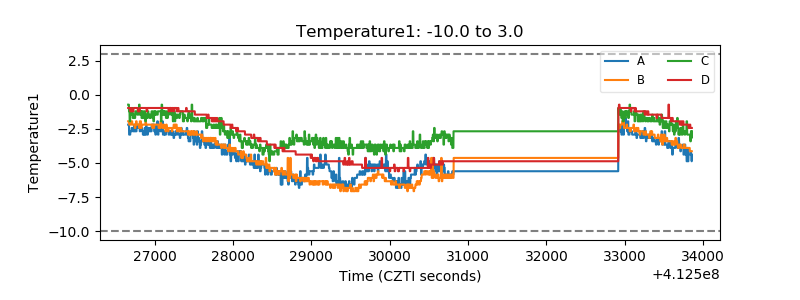 |
| Veto HV Monitor | 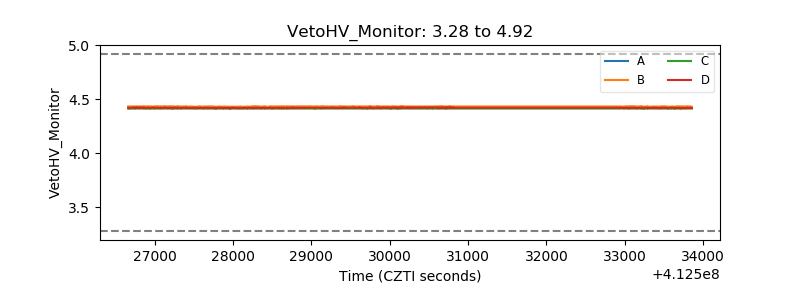 |
| Veto LLD | 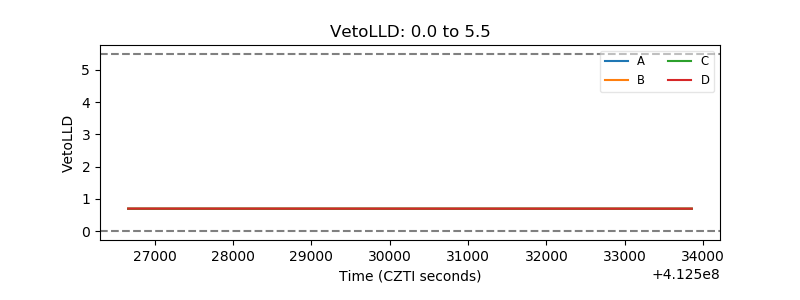 |
| Alpha Counter | 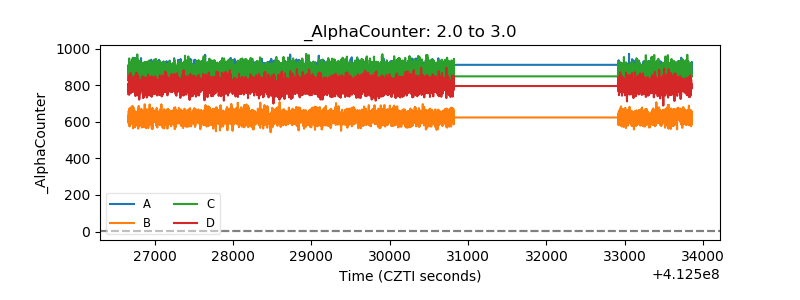 |
| _CPM_Rate | 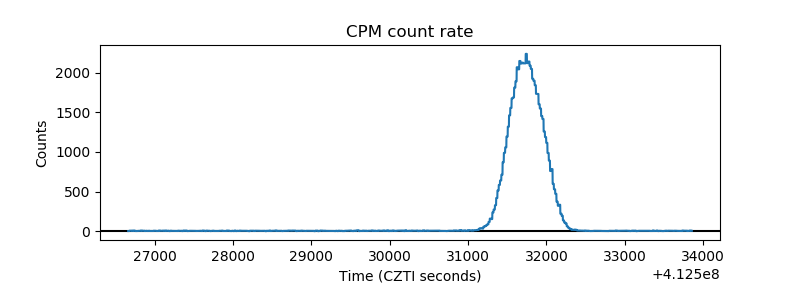 |
| CZT Counter | 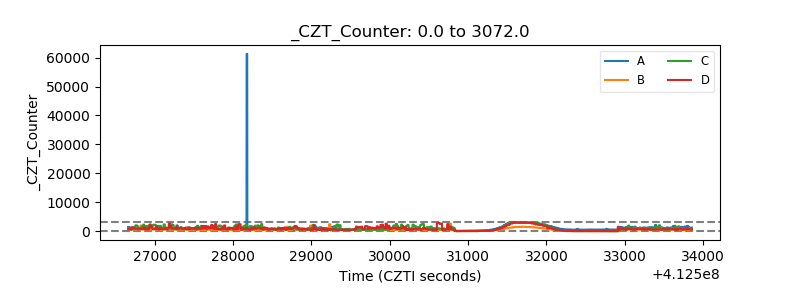 |
| +2.5 Volts monitor | 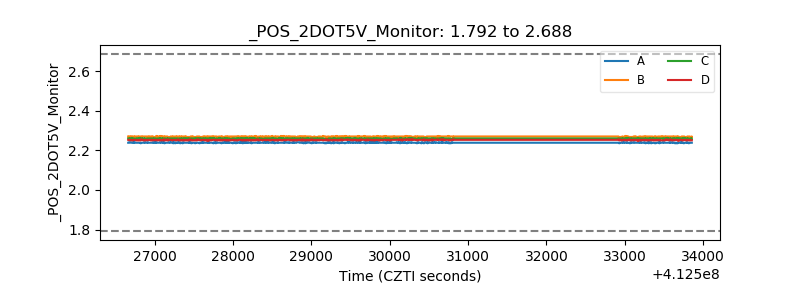 |
| +5 Volts monitor | 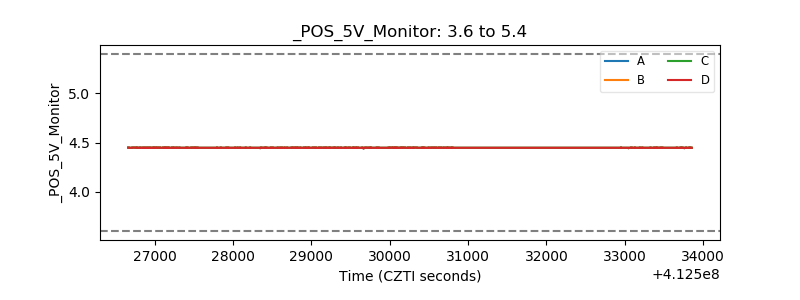 |
| _ROLL_ROT | 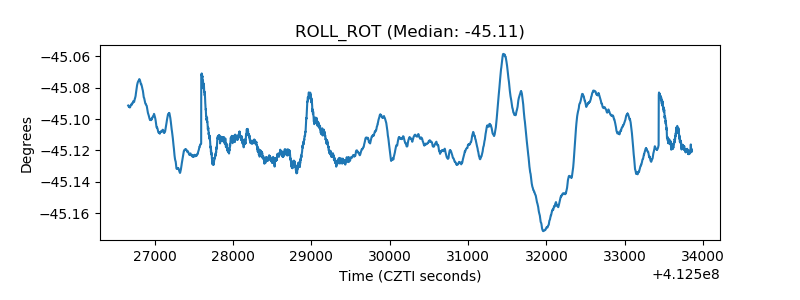 |
| _Roll_DEC | 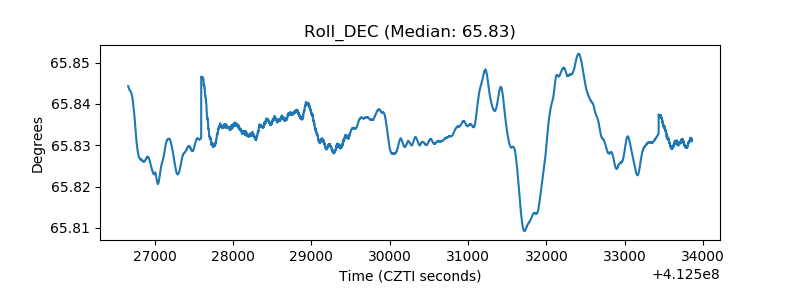 |
| _Roll_RA | 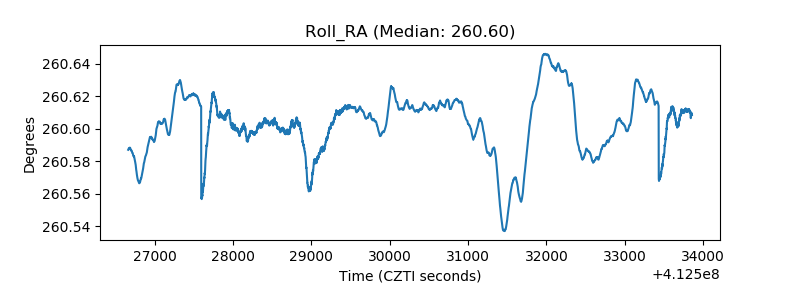 |
| Veto Counter | 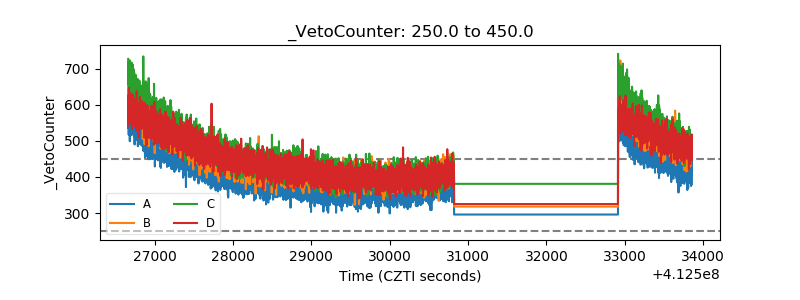 |