| Param | Original file | Final file |
|---|---|---|
| Filename | modeM0/AS1A12_018T01_9000005488_39650cztM0_level2.fits | modeM0/AS1A12_018T01_9000005488_39650cztM0_level2_quad_clean.evt |
| Size (bytes) | 454,043,520 | 89,277,120 |
| Size | 433.0 MB | 85.1 MB |
| Events in quadrant A | 4,011,308 | 633,342 |
| Events in quadrant B | 3,196,697 | 620,000 |
| Events in quadrant C | 6,145,152 | 529,970 |
| Events in quadrant D | 3,070,318 | 573,545 |
| Mode SS | |||
|---|---|---|---|
| Quadrant | BADHDUFLAG | Total packets | Discarded packets |
| A | 0 | 100 | 0 |
| B | 0 | 100 | 0 |
| C | 0 | 100 | 0 |
| D | 0 | 100 | 0 |
| Mode M0 | |||
|---|---|---|---|
| Quadrant | BADHDUFLAG | Total packets | Discarded packets |
| A | 0 | 15106 | 3 |
| B | 0 | 12679 | 2 |
| C | 0 | 21806 | 2 |
| D | 0 | 12705 | 2 |
| Mode M9 | |||
|---|---|---|---|
| Quadrant | BADHDUFLAG | Total packets | Discarded packets |
| A | 0 | 26 | 0 |
| B | 0 | 26 | 0 |
| C | 0 | 26 | 0 |
| D | 0 | 27 | 0 |
| Quadrant | Total seconds | Saturated seconds | Saturation percentage |
|---|---|---|---|
| A | 4944 | 76 | 1.537217% |
| B | 4944 | 282 | 5.703883% |
| C | 4944 | 966 | 19.538835% |
| D | 4944 | 89 | 1.800162% |
Noise dominated data is calculated using 1-second bins in cleaned event files. If a bin has >2000 counts, and if more than 50% of those come from <1% of pixels, then it is considered to be noise-dominated and hence unusable.
| Quadrant | # 1 sec bins | Bins with >0 counts | Bins with >2000 counts | High rate bins dominated by noise | Noise dominated (total time) | Noise dominated (detector-on time) | Marked lightcurve |
|---|---|---|---|---|---|---|---|
| A | 7096 | 4945 | 44 | 44 | 0.62% | 0.89% | 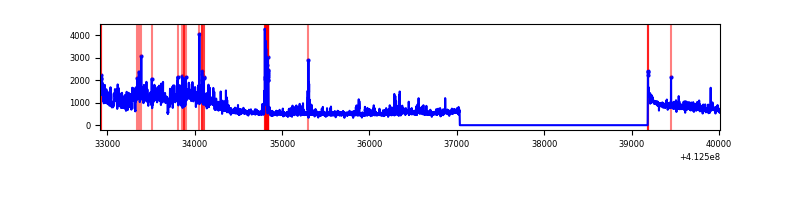 |
| B | 7096 | 4945 | 226 | 226 | 3.18% | 4.57% | 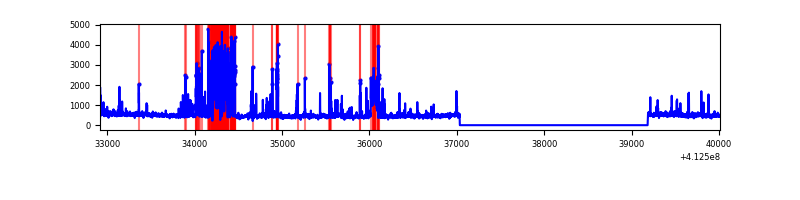 |
| C | 7096 | 4945 | 877 | 877 | 12.36% | 17.74% | 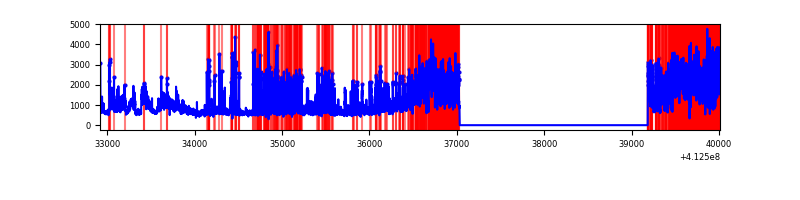 |
| D | 7096 | 4945 | 75 | 75 | 1.06% | 1.52% | 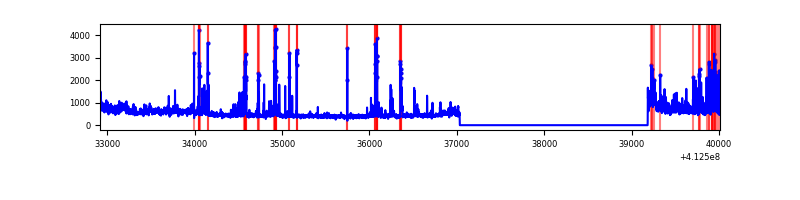 |
Top three noisy pixels from each quadrant. If the there are fewer than three noisy pixels in the level2.evt file, extra rows are filled as -1
| Pixel properties | Quadrant properties | ||||||
|---|---|---|---|---|---|---|---|
| Quadrant | DetID | PixID | Counts | Sigma | Mean | Median | Sigma |
| A | 15 | 222 | 1291165 | 11226.56 | 570 | 561 | 115.0 |
| A | 10 | 83 | 438685 | 3811.1 | 570 | 561 | 115.0 |
| A | 9 | 143 | 59385 | 511.69 | 570 | 561 | 115.0 |
| B | 5 | 172 | 911894 | 8664.04 | 559 | 545 | 105.2 |
| B | 5 | 255 | 30692 | 286.6 | 559 | 545 | 105.2 |
| B | 10 | 246 | 18225 | 168.08 | 559 | 545 | 105.2 |
| C | 15 | 208 | 2958487 | 24039.16 | 533 | 538 | 123.0 |
| C | 9 | 187 | 777230 | 6312.15 | 533 | 538 | 123.0 |
| C | 15 | 214 | 194824 | 1578.96 | 533 | 538 | 123.0 |
| D | 13 | 249 | 272232 | 1992.69 | 567 | 552 | 136.3 |
| D | 12 | 227 | 259440 | 1898.87 | 567 | 552 | 136.3 |
| D | 12 | 233 | 129847 | 948.34 | 567 | 552 | 136.3 |
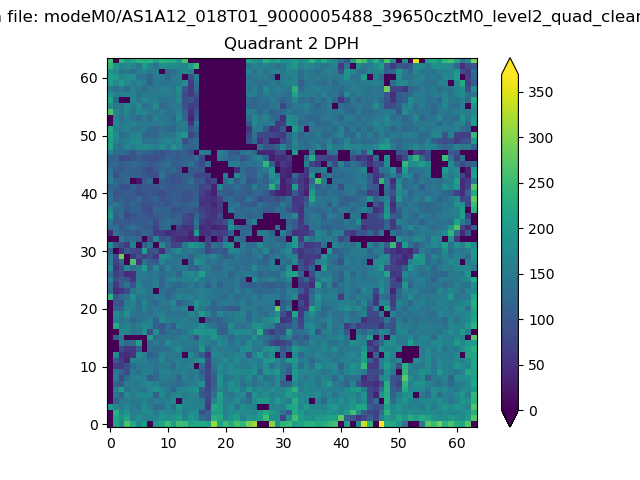
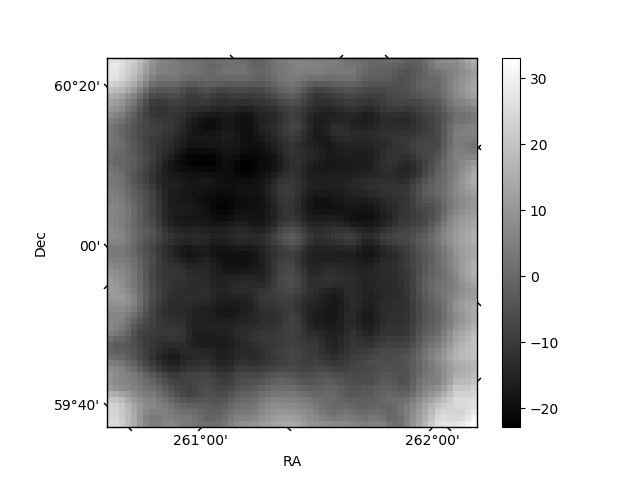
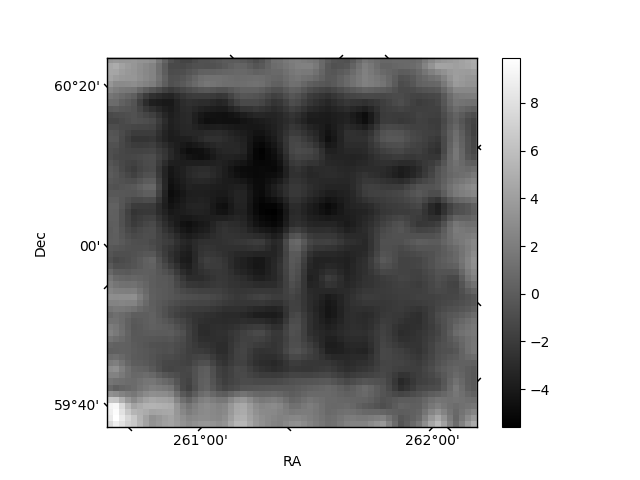
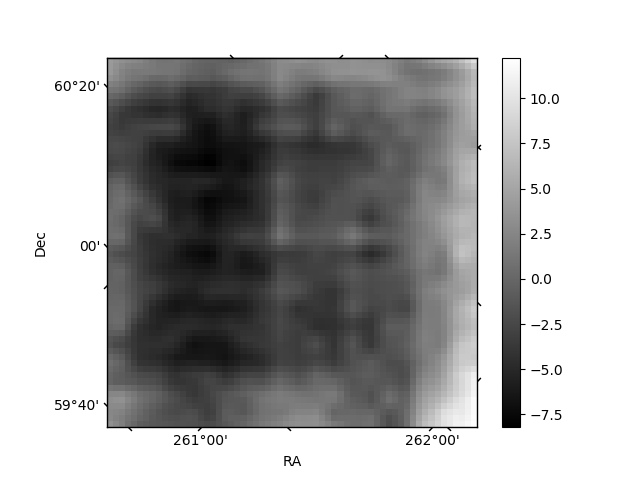
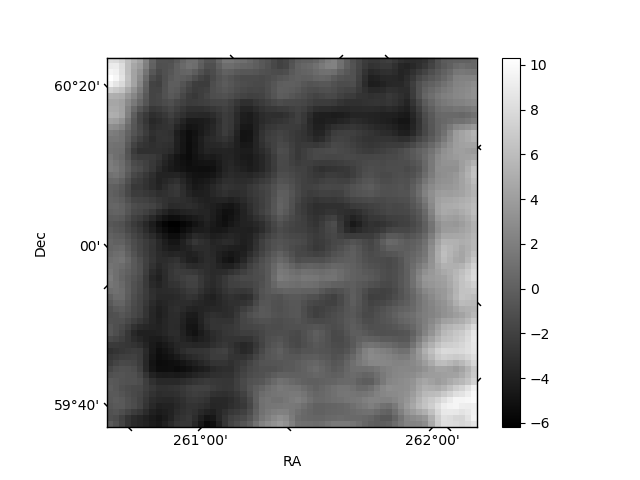
Histogram calculated using DETX and DETY for each event in the final _common_clean file
| Quadrant A | 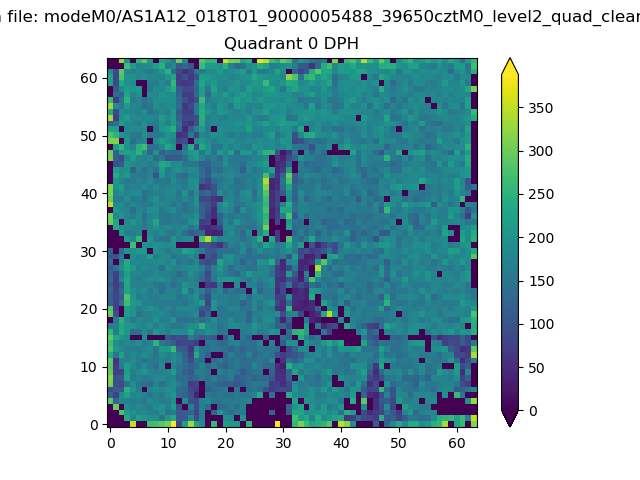 |
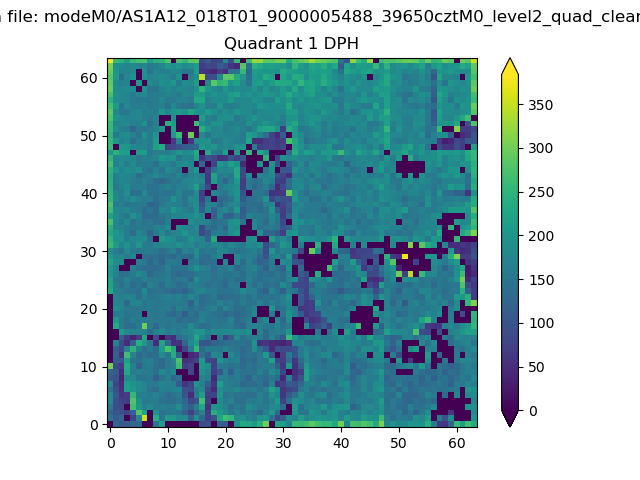 |
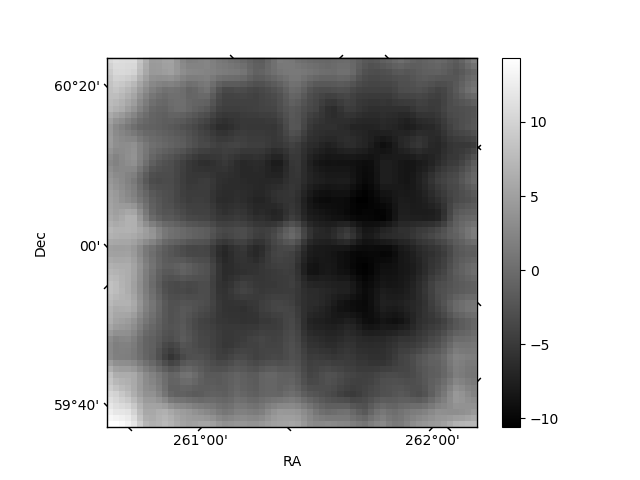
Quadrant B |
|---|---|---|---|
| Quadrant D | 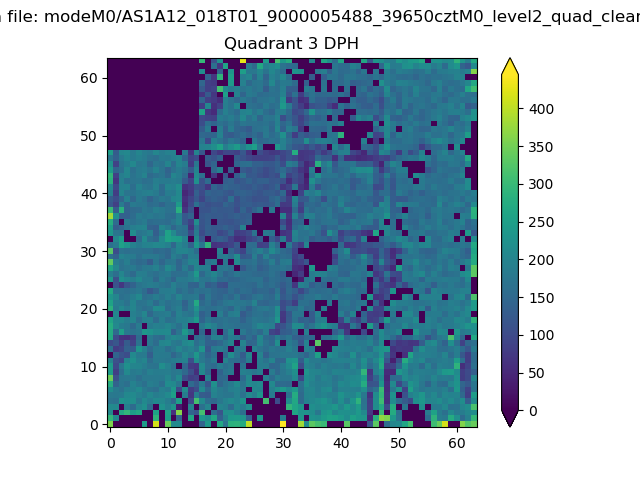 |
 |
Quadrant C |
| Plot type | Count rate plots | Images |
|---|---|---|
| Comparison with Poisson distribution Blue bars denote a histogram of data divided into 1 sec bins. Red curve is a Poisson curve with rate = median count rate of data. |
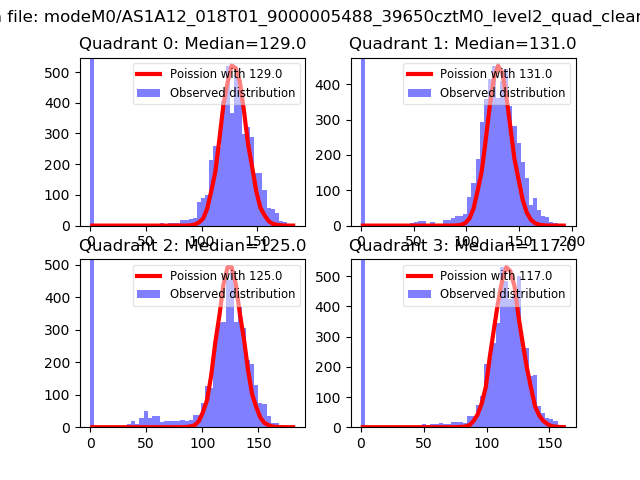 |
 |
| Quadrant-wise count rates Data is divided into 100 sec bins |
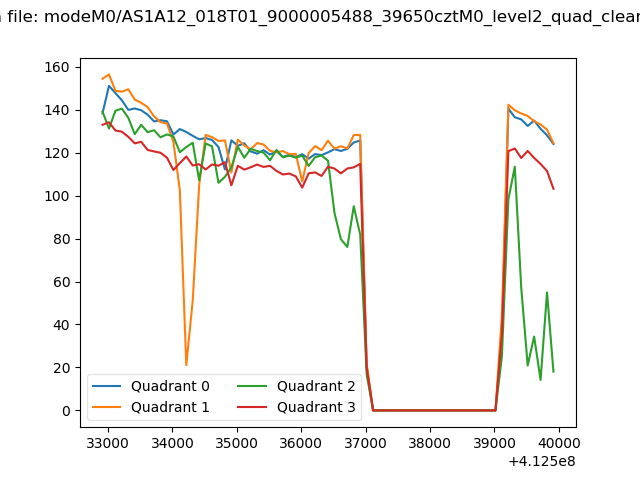 |
|
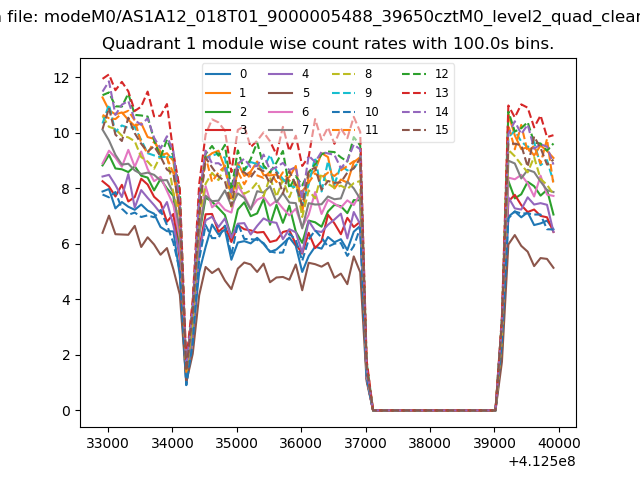
| Module-wise count rates for Quadrant A Data is divided into 100 sec bins |
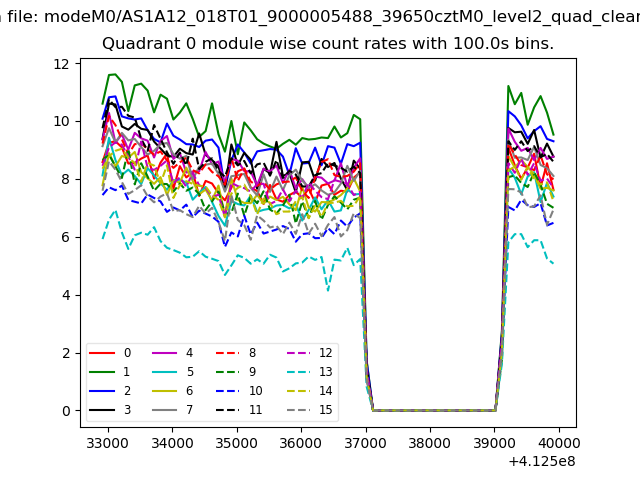 |
 |
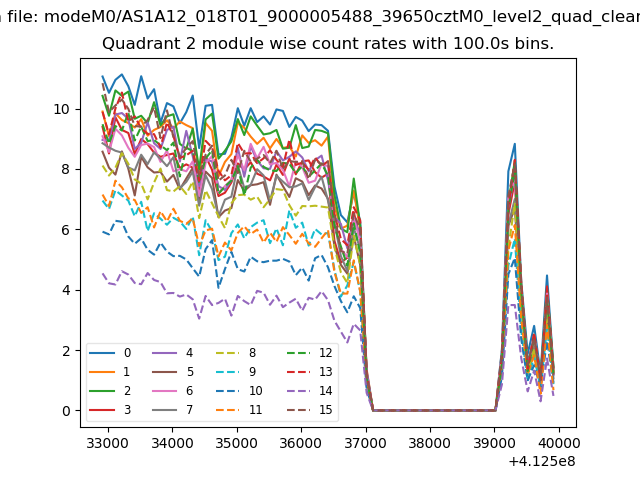
| Module-wise count rates for Quadrant B Data is divided into 100 sec bins |
 |
 |
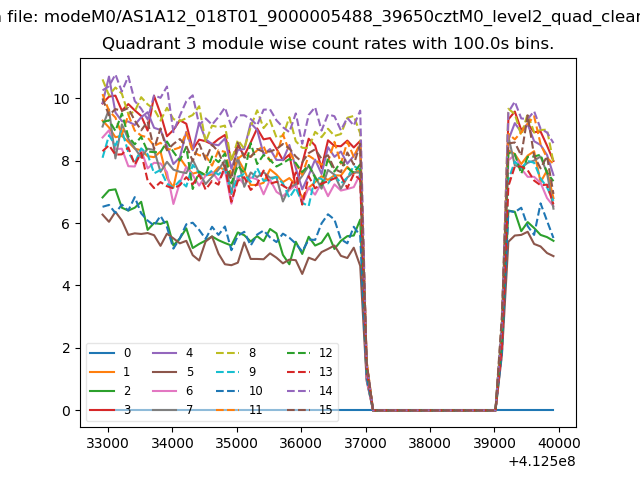
| Module-wise count rates for Quadrant C Data is divided into 100 sec bins |
 |
 |
| Module-wise count rates for Quadrant D Data is divided into 100 sec bins |
 |
 |
| Parameter | Plot |
|---|---|
| CZT HV Monitor | 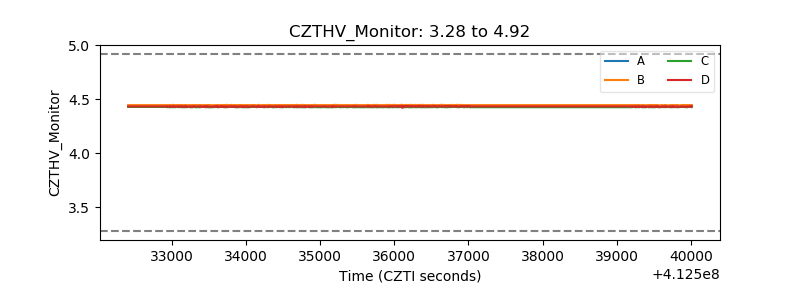 |
| D_VDD | 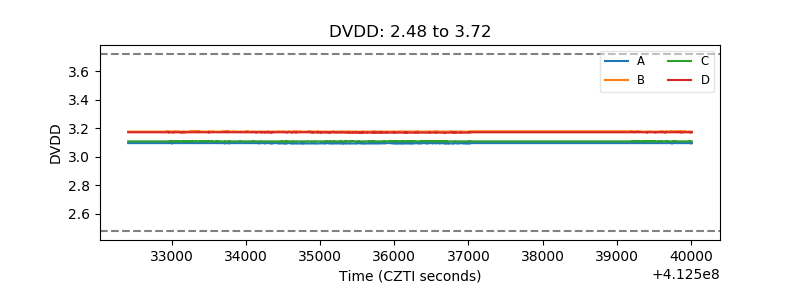 |
| Temperature 1 | 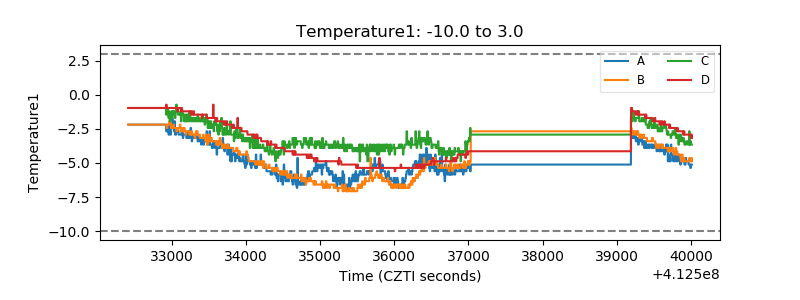 |
| Veto HV Monitor | 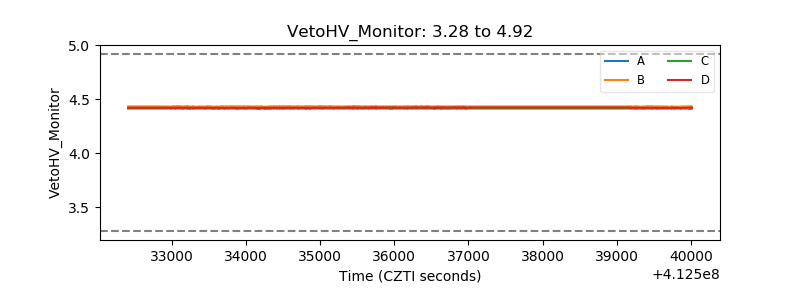 |
| Veto LLD | 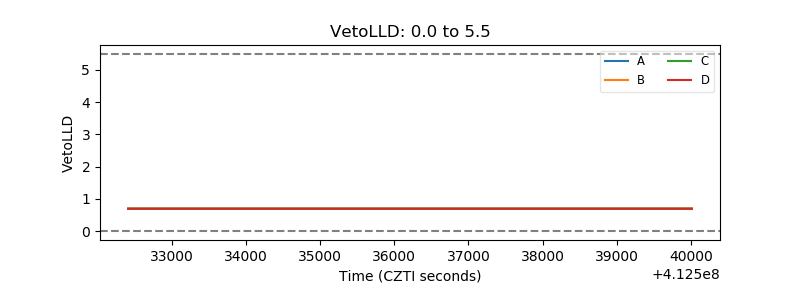 |
| Alpha Counter | 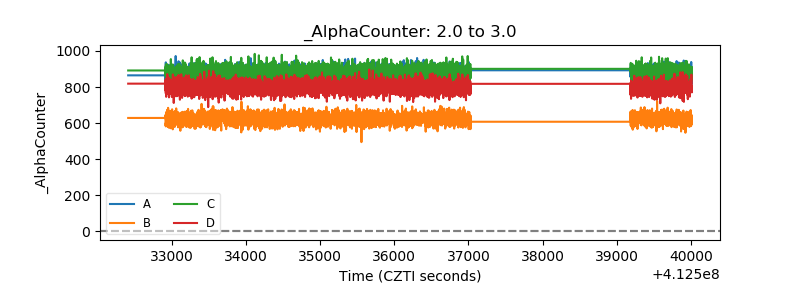 |
| _CPM_Rate | 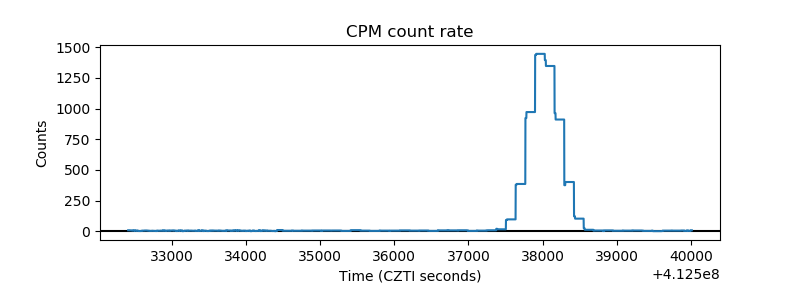 |
| CZT Counter | 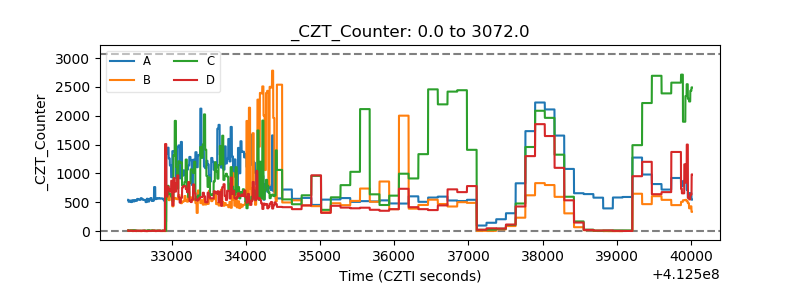 |
| +2.5 Volts monitor | 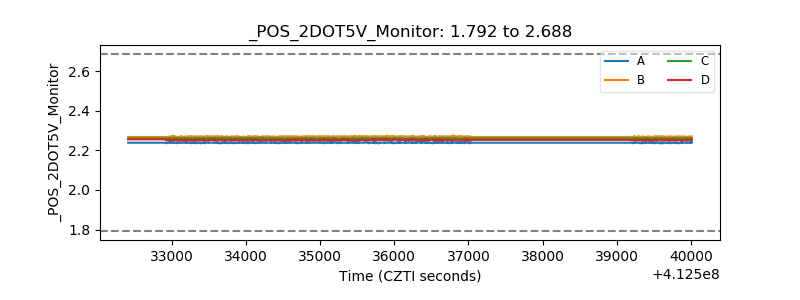 |
| +5 Volts monitor |  |
| _ROLL_ROT | 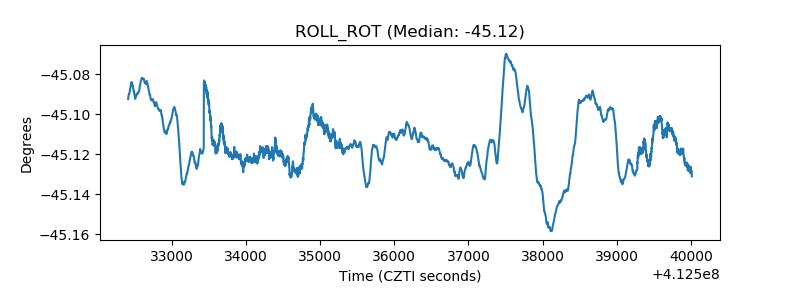 |
| _Roll_DEC | 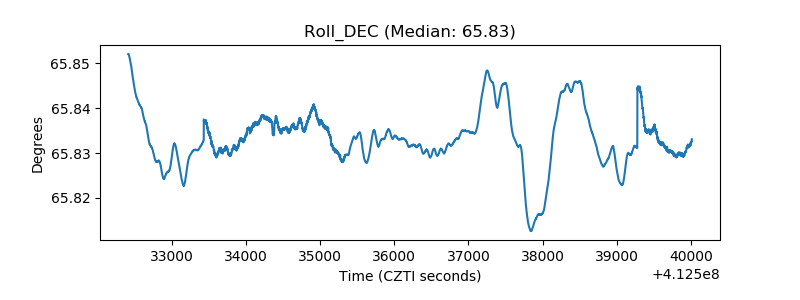 |
| _Roll_RA | 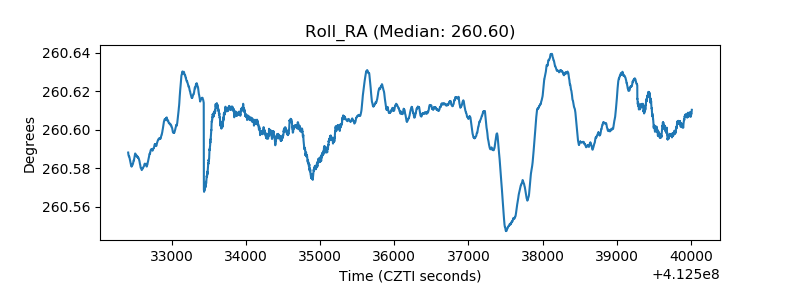 |
| Veto Counter | 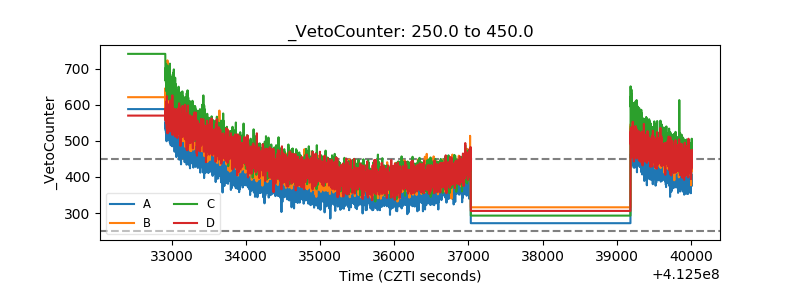 |