| Param | Original file | Final file |
|---|---|---|
| Filename | modeM0/AS1A12_018T01_9000005488_39651cztM0_level2.fits | modeM0/AS1A12_018T01_9000005488_39651cztM0_level2_quad_clean.evt |
| Size (bytes) | 444,818,880 | 86,114,880 |
| Size | 424.2 MB | 82.1 MB |
| Events in quadrant A | 3,640,697 | 599,016 |
| Events in quadrant B | 2,343,926 | 615,785 |
| Events in quadrant C | 5,614,071 | 502,900 |
| Events in quadrant D | 4,480,523 | 540,565 |
| Mode SS | |||
|---|---|---|---|
| Quadrant | BADHDUFLAG | Total packets | Discarded packets |
| A | 0 | 102 | 0 |
| B | 0 | 102 | 0 |
| C | 0 | 102 | 0 |
| D | 0 | 102 | 0 |
| Mode M0 | |||
|---|---|---|---|
| Quadrant | BADHDUFLAG | Total packets | Discarded packets |
| A | 0 | 14292 | 3 |
| B | 0 | 10363 | 2 |
| C | 0 | 20125 | 2 |
| D | 0 | 16844 | 2 |
| Mode M9 | |||
|---|---|---|---|
| Quadrant | BADHDUFLAG | Total packets | Discarded packets |
| A | 0 | 30 | 0 |
| B | 0 | 30 | 0 |
| C | 0 | 30 | 0 |
| D | 0 | 31 | 0 |
| Quadrant | Total seconds | Saturated seconds | Saturation percentage |
|---|---|---|---|
| A | 4981 | 60 | 1.204577% |
| B | 4981 | 28 | 0.562136% |
| C | 4981 | 921 | 18.490263% |
| D | 4981 | 191 | 3.834571% |
Noise dominated data is calculated using 1-second bins in cleaned event files. If a bin has >2000 counts, and if more than 50% of those come from <1% of pixels, then it is considered to be noise-dominated and hence unusable.
| Quadrant | # 1 sec bins | Bins with >0 counts | Bins with >2000 counts | High rate bins dominated by noise | Noise dominated (total time) | Noise dominated (detector-on time) | Marked lightcurve |
|---|---|---|---|---|---|---|---|
| A | 7103 | 4982 | 46 | 46 | 0.65% | 0.92% | 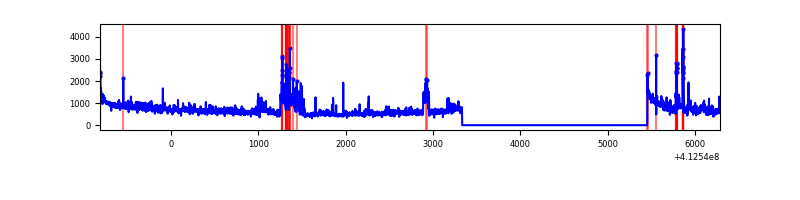 |
| B | 7103 | 4982 | 13 | 13 | 0.18% | 0.26% | 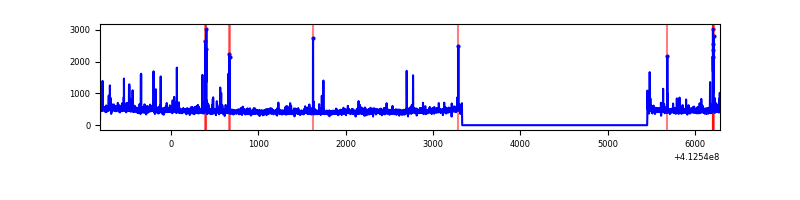 |
| C | 7103 | 4982 | 777 | 777 | 10.94% | 15.60% | 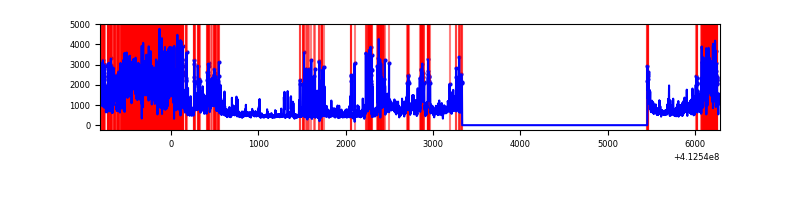 |
| D | 7103 | 4982 | 171 | 171 | 2.41% | 3.43% | 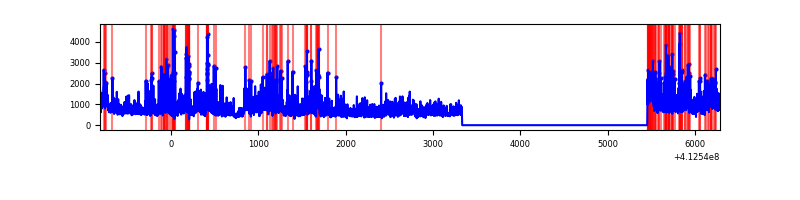 |
Top three noisy pixels from each quadrant. If the there are fewer than three noisy pixels in the level2.evt file, extra rows are filled as -1
| Pixel properties | Quadrant properties | ||||||
|---|---|---|---|---|---|---|---|
| Quadrant | DetID | PixID | Counts | Sigma | Mean | Median | Sigma |
| A | 15 | 222 | 1039748 | 9396.55 | 550 | 539 | 110.6 |
| A | 10 | 83 | 436652 | 3943.34 | 550 | 539 | 110.6 |
| A | 13 | 6 | 13391 | 116.21 | 550 | 539 | 110.6 |
| B | 15 | 32 | 47413 | 442.09 | 553 | 539 | 106.0 |
| B | 5 | 255 | 44574 | 415.32 | 553 | 539 | 106.0 |
| B | 0 | 230 | 21109 | 194.01 | 553 | 539 | 106.0 |
| C | 15 | 208 | 2073379 | 17584.32 | 512 | 515 | 117.9 |
| C | 9 | 187 | 1246638 | 10570.99 | 512 | 515 | 117.9 |
| C | 15 | 214 | 195238 | 1651.86 | 512 | 515 | 117.9 |
| D | 12 | 227 | 1766776 | 13544.73 | 539 | 524 | 130.4 |
| D | 13 | 171 | 190158 | 1454.23 | 539 | 524 | 130.4 |
| D | 12 | 233 | 128575 | 981.98 | 539 | 524 | 130.4 |
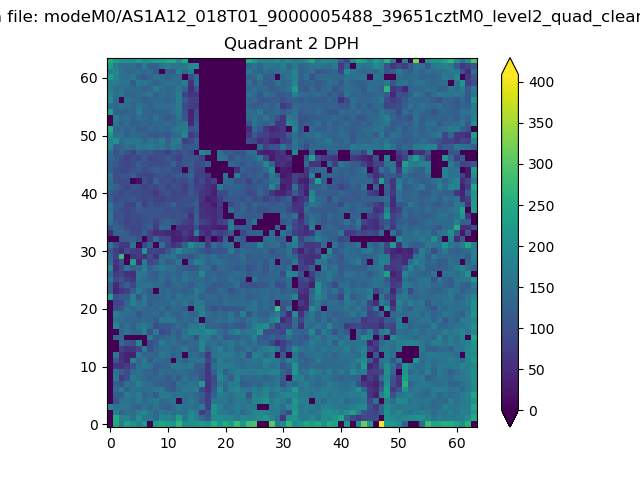
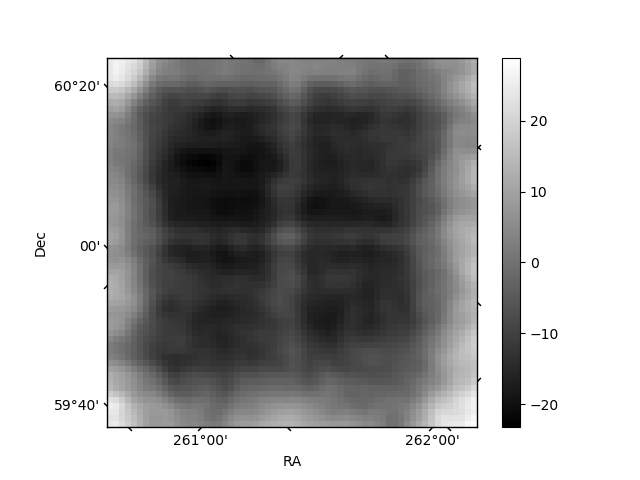
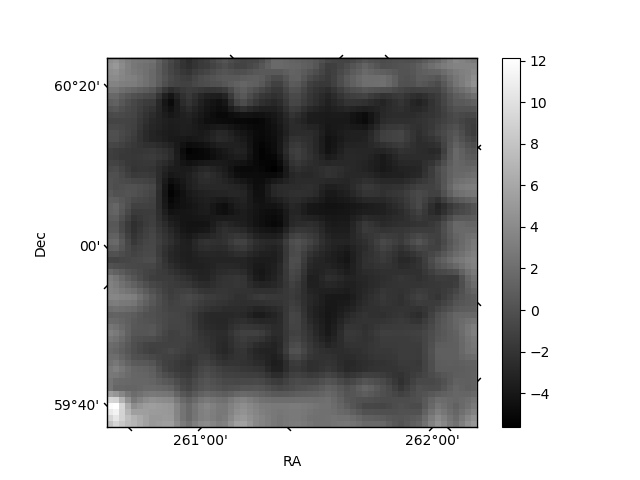
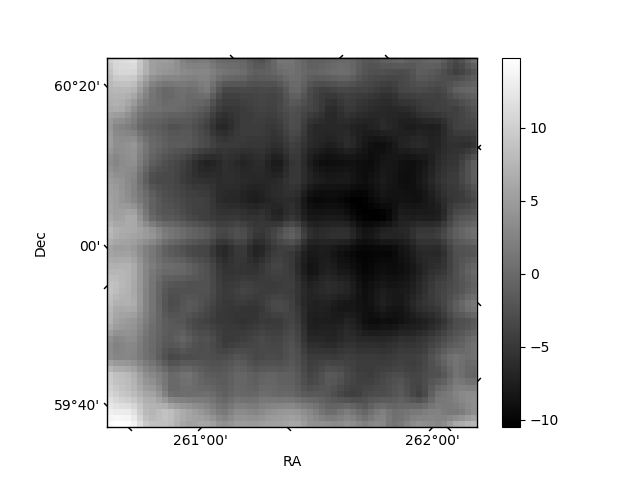
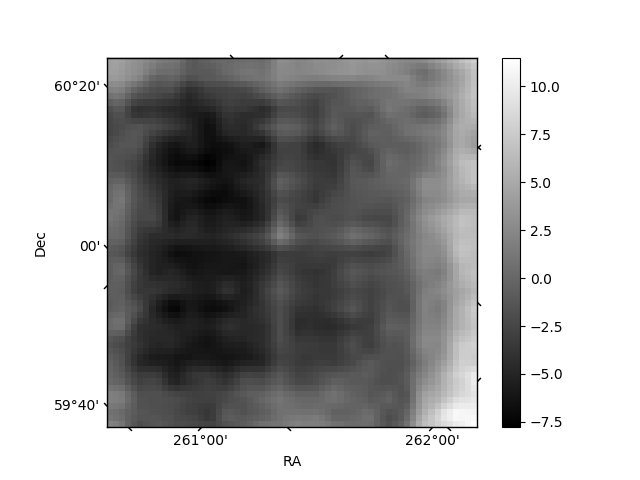
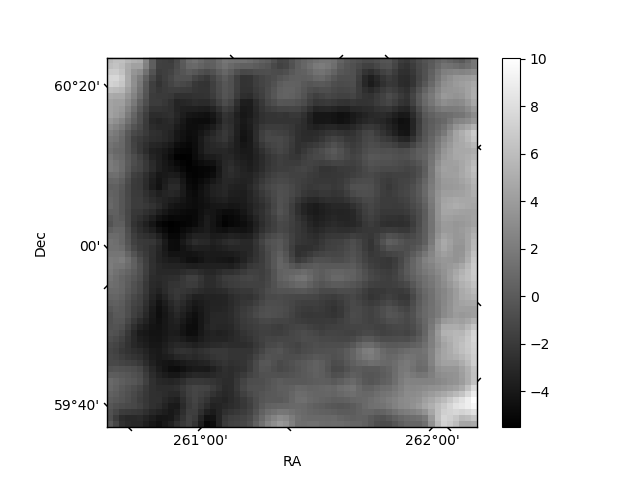
Histogram calculated using DETX and DETY for each event in the final _common_clean file
| Quadrant A | 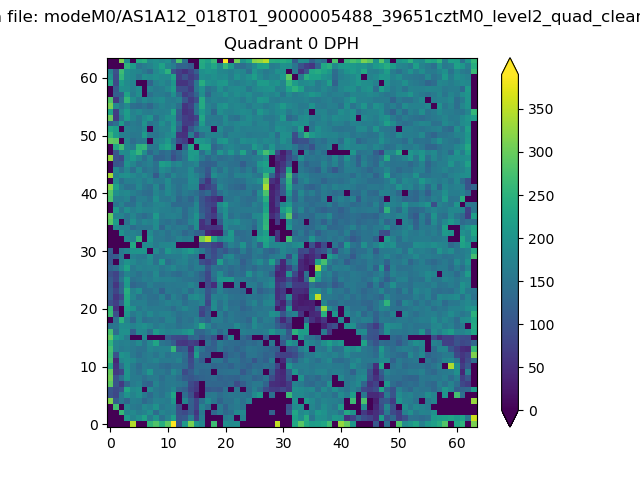 |
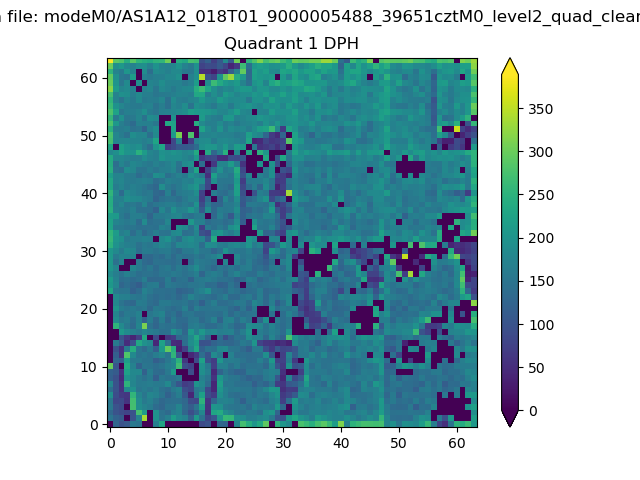 |
Quadrant B |
|---|---|---|---|
| Quadrant D | 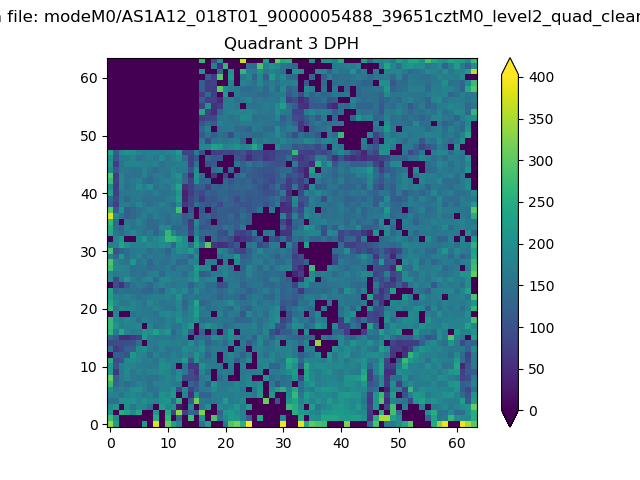 |
 |
Quadrant C |
| Plot type | Count rate plots | Images |
|---|---|---|
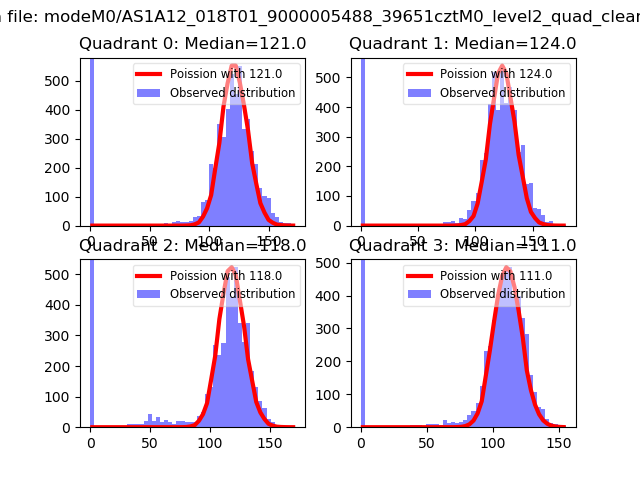
| Comparison with Poisson distribution Blue bars denote a histogram of data divided into 1 sec bins. Red curve is a Poisson curve with rate = median count rate of data. |
 |
 |
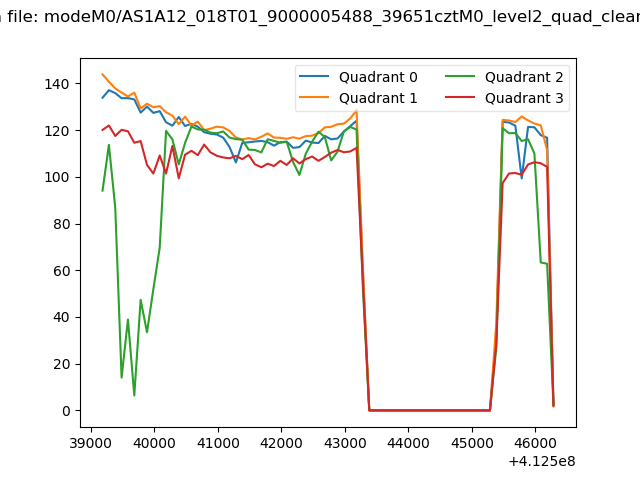
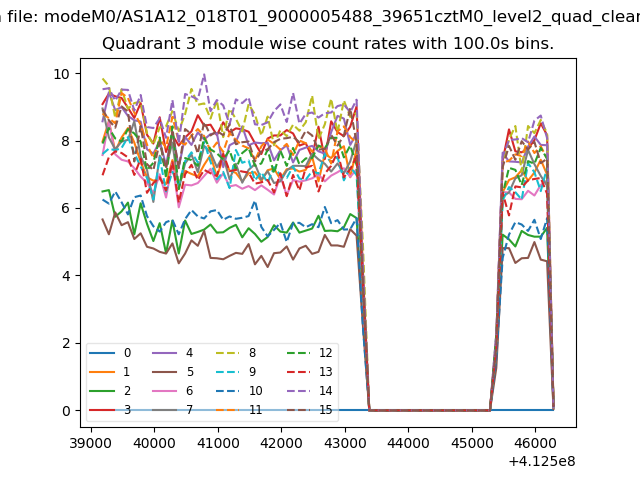
| Quadrant-wise count rates Data is divided into 100 sec bins |
 |
|
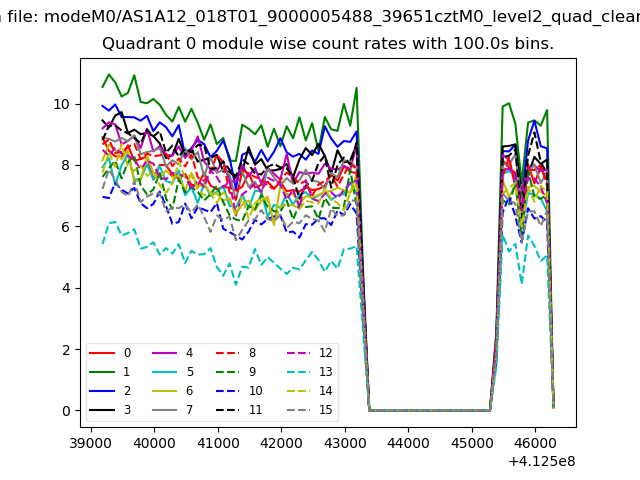
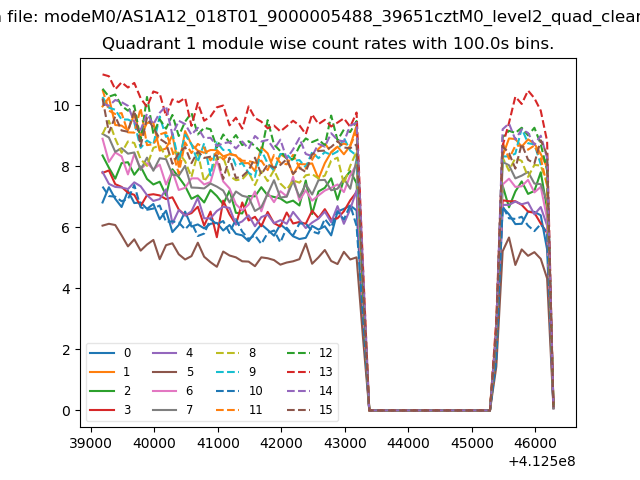
| Module-wise count rates for Quadrant A Data is divided into 100 sec bins |
 |
 |
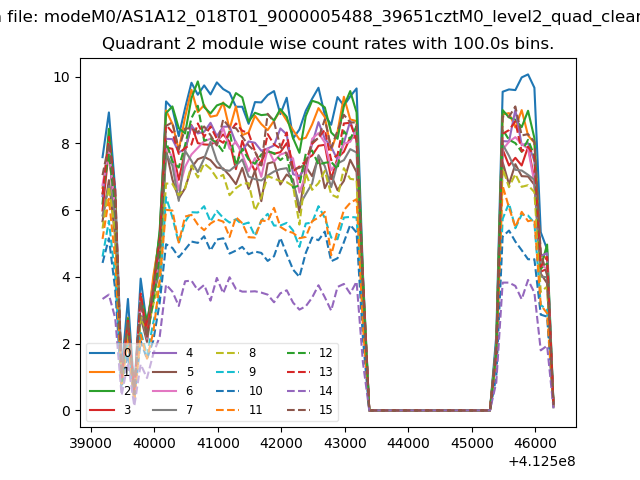
| Module-wise count rates for Quadrant B Data is divided into 100 sec bins |
 |
 |
| Module-wise count rates for Quadrant C Data is divided into 100 sec bins |
 |
 |
| Module-wise count rates for Quadrant D Data is divided into 100 sec bins |
 |
 |
| Parameter | Plot |
|---|---|
| CZT HV Monitor | 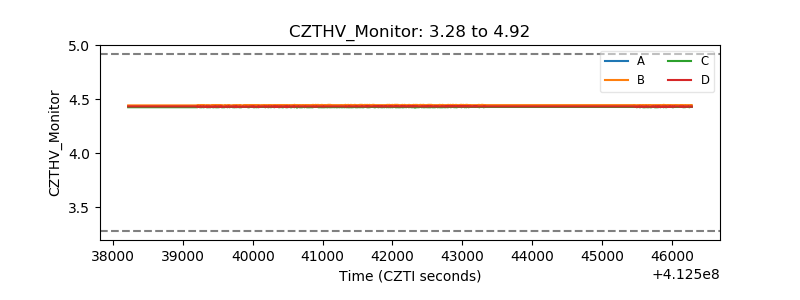 |
| D_VDD | 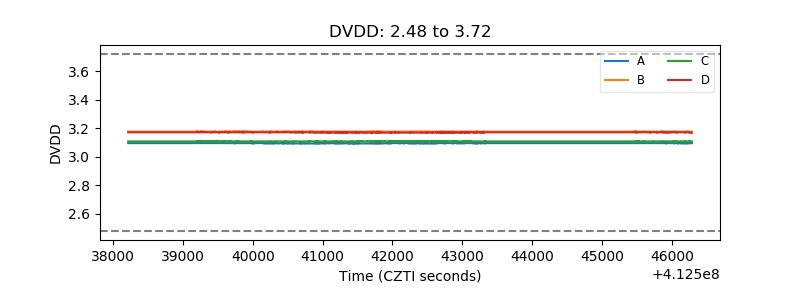 |
| Temperature 1 | 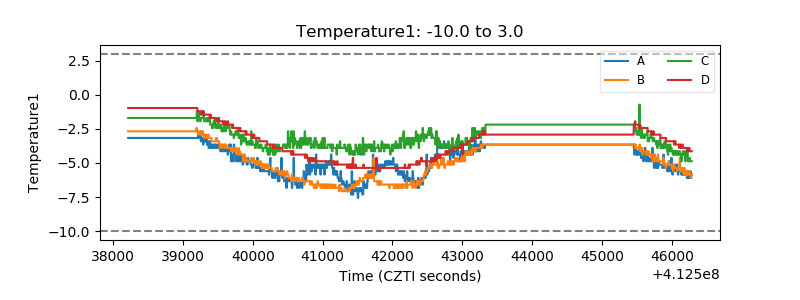 |
| Veto HV Monitor | 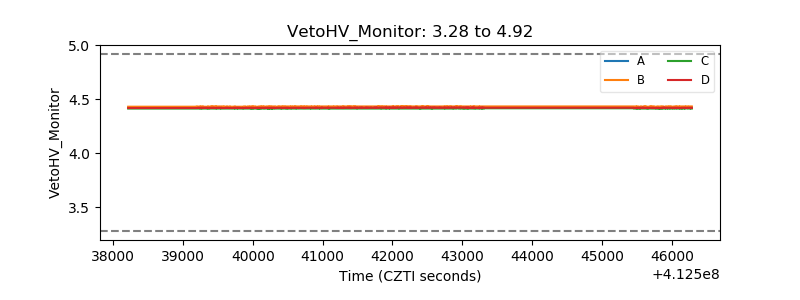 |
| Veto LLD | 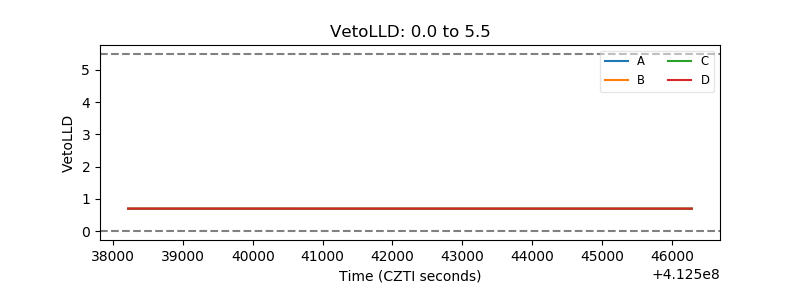 |
| Alpha Counter | 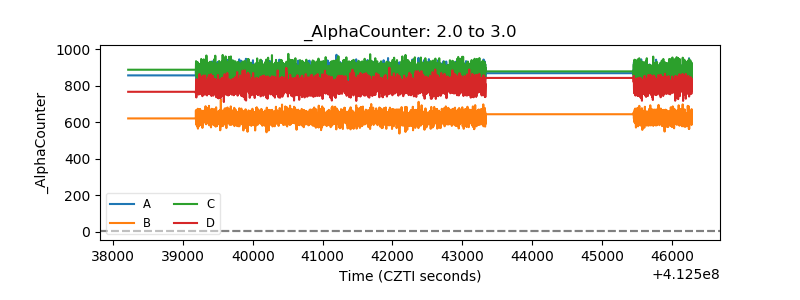 |
| _CPM_Rate | 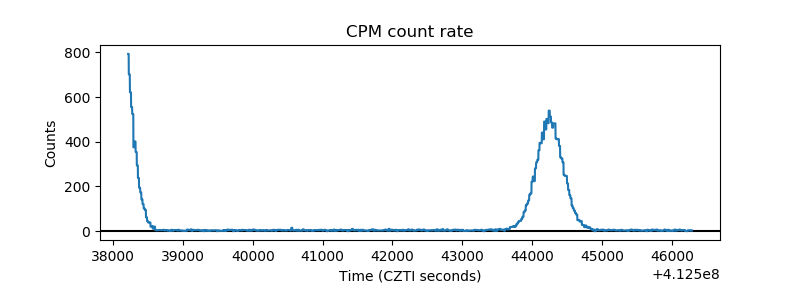 |
| CZT Counter | 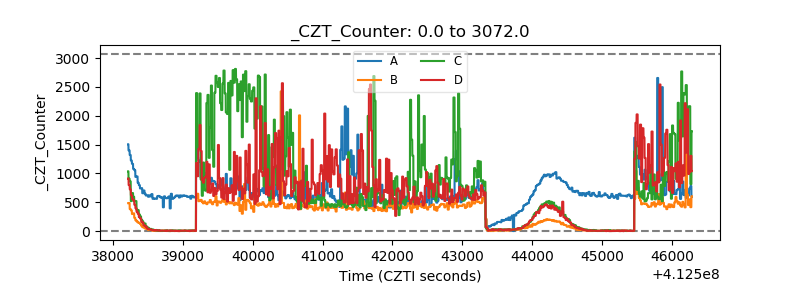 |
| +2.5 Volts monitor | 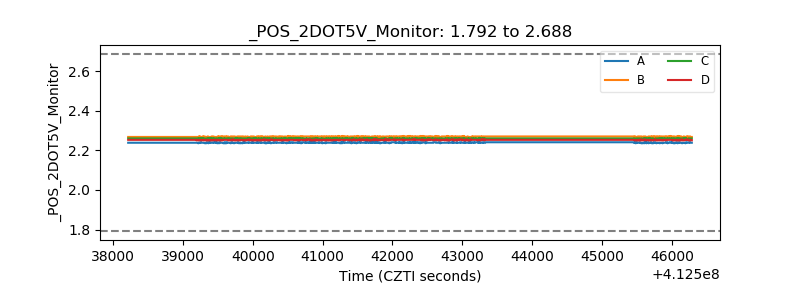 |
| +5 Volts monitor | 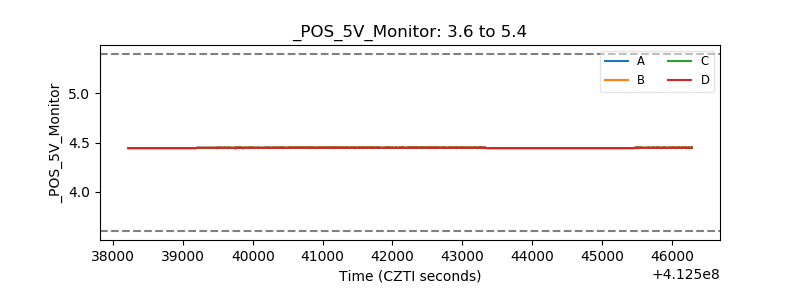 |
| _ROLL_ROT | 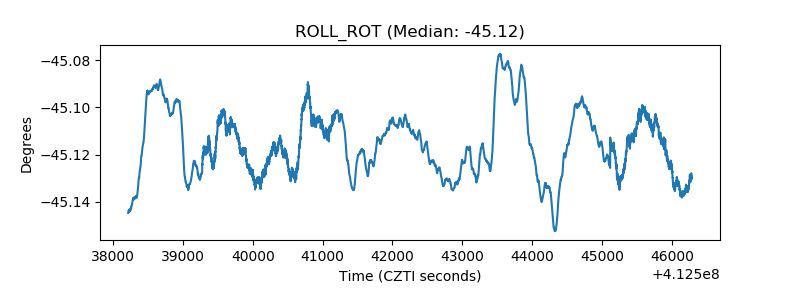 |
| _Roll_DEC | 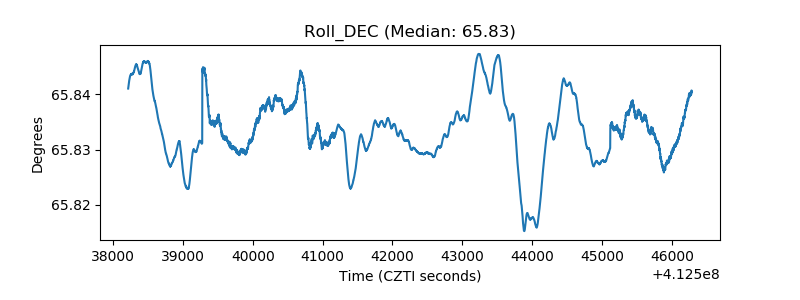 |
| _Roll_RA | 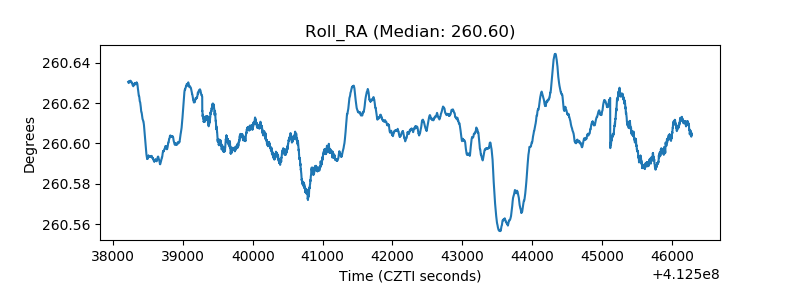 |
| Veto Counter | 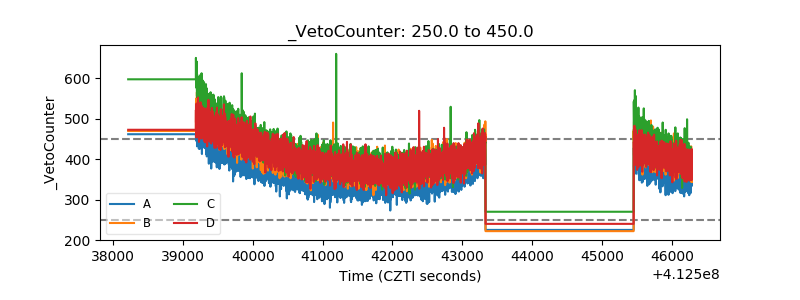 |