| Param | Original file | Final file |
|---|---|---|
| Filename | modeM0/AS1A12_018T01_9000005488_39652cztM0_level2.fits | modeM0/AS1A12_018T01_9000005488_39652cztM0_level2_quad_clean.evt |
| Size (bytes) | 506,499,840 | 82,088,640 |
| Size | 483.0 MB | 78.3 MB |
| Events in quadrant A | 3,849,722 | 577,817 |
| Events in quadrant B | 2,750,813 | 572,372 |
| Events in quadrant C | 7,022,448 | 457,081 |
| Events in quadrant D | 4,732,510 | 522,757 |
| Mode SS | |||
|---|---|---|---|
| Quadrant | BADHDUFLAG | Total packets | Discarded packets |
| A | 0 | 102 | 0 |
| B | 0 | 102 | 0 |
| C | 0 | 102 | 0 |
| D | 0 | 102 | 0 |
| Mode M0 | |||
|---|---|---|---|
| Quadrant | BADHDUFLAG | Total packets | Discarded packets |
| A | 0 | 15216 | 3 |
| B | 0 | 11809 | 2 |
| C | 0 | 24433 | 2 |
| D | 0 | 17633 | 2 |
| Mode M9 | |||
|---|---|---|---|
| Quadrant | BADHDUFLAG | Total packets | Discarded packets |
| A | 0 | 33 | 0 |
| B | 0 | 33 | 0 |
| C | 0 | 33 | 0 |
| D | 0 | 34 | 0 |
| Quadrant | Total seconds | Saturated seconds | Saturation percentage |
|---|---|---|---|
| A | 5078 | 42 | 0.827097% |
| B | 5078 | 206 | 4.056715% |
| C | 5078 | 1241 | 24.438755% |
| D | 5078 | 195 | 3.840095% |
Noise dominated data is calculated using 1-second bins in cleaned event files. If a bin has >2000 counts, and if more than 50% of those come from <1% of pixels, then it is considered to be noise-dominated and hence unusable.
| Quadrant | # 1 sec bins | Bins with >0 counts | Bins with >2000 counts | High rate bins dominated by noise | Noise dominated (total time) | Noise dominated (detector-on time) | Marked lightcurve |
|---|---|---|---|---|---|---|---|
| A | 7051 | 5079 | 30 | 30 | 0.43% | 0.59% | 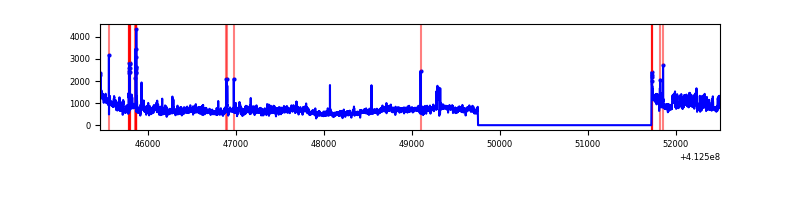 |
| B | 7051 | 5079 | 158 | 158 | 2.24% | 3.11% | 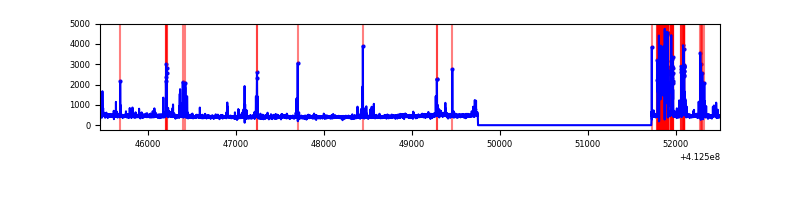 |
| C | 7051 | 5078 | 1157 | 1157 | 16.41% | 22.78% | 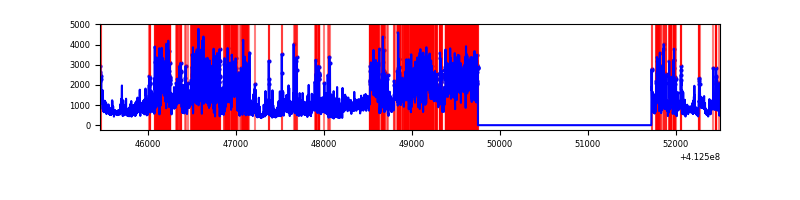 |
| D | 7051 | 5079 | 233 | 233 | 3.30% | 4.59% | 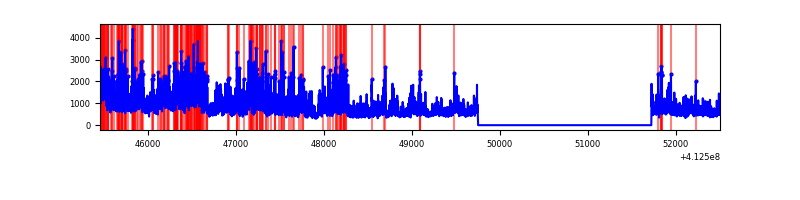 |
Top three noisy pixels from each quadrant. If the there are fewer than three noisy pixels in the level2.evt file, extra rows are filled as -1
| Pixel properties | Quadrant properties | ||||||
|---|---|---|---|---|---|---|---|
| Quadrant | DetID | PixID | Counts | Sigma | Mean | Median | Sigma |
| A | 15 | 222 | 1247484 | 11214.98 | 540 | 529 | 111.2 |
| A | 10 | 83 | 430488 | 3867.01 | 540 | 529 | 111.2 |
| A | 15 | 174 | 45683 | 406.11 | 540 | 529 | 111.2 |
| B | 5 | 172 | 523733 | 5111.53 | 530 | 516 | 102.4 |
| B | 5 | 255 | 41122 | 396.7 | 530 | 516 | 102.4 |
| B | 15 | 32 | 39119 | 377.13 | 530 | 516 | 102.4 |
| C | 15 | 208 | 3109198 | 27240.5 | 491 | 493 | 114.1 |
| C | 9 | 187 | 1725285 | 15113.75 | 491 | 493 | 114.1 |
| C | 15 | 214 | 196936 | 1721.36 | 491 | 493 | 114.1 |
| D | 12 | 227 | 2349340 | 18275.58 | 526 | 513 | 128.5 |
| D | 5 | 32 | 106898 | 827.75 | 526 | 513 | 128.5 |
| D | 13 | 249 | 84742 | 655.36 | 526 | 513 | 128.5 |
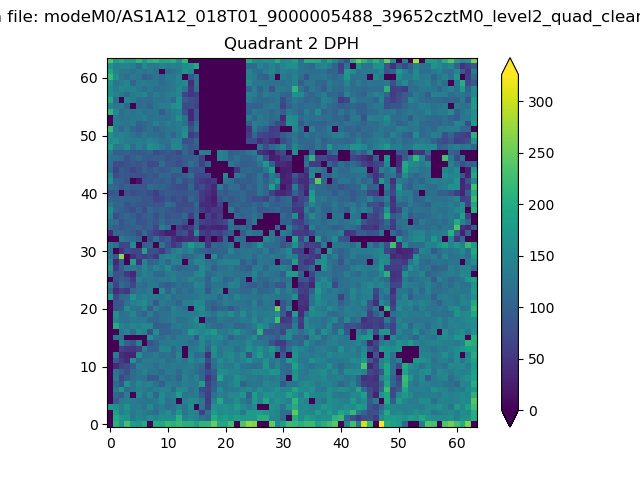
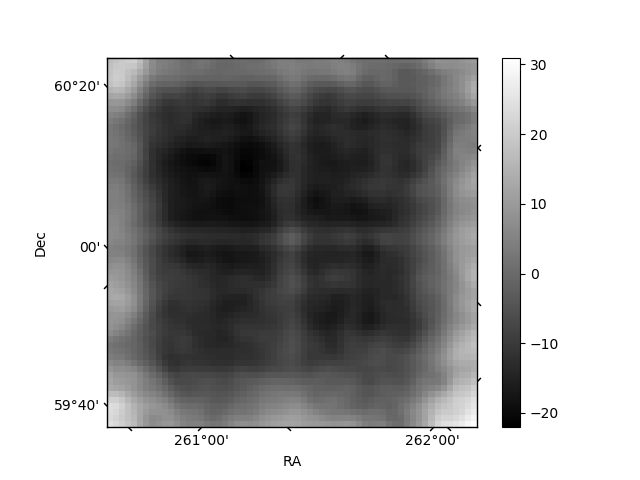
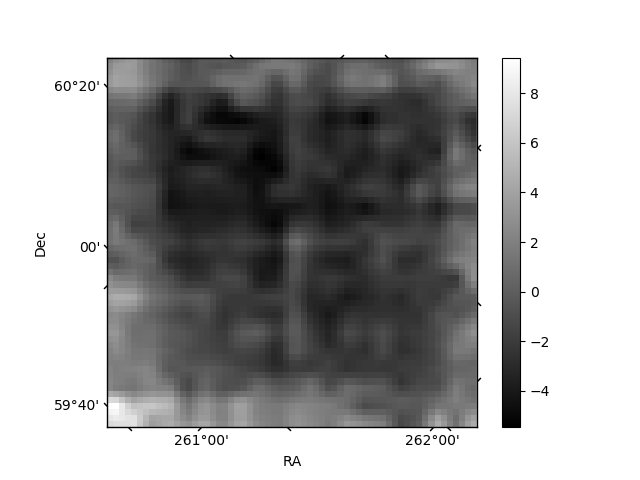
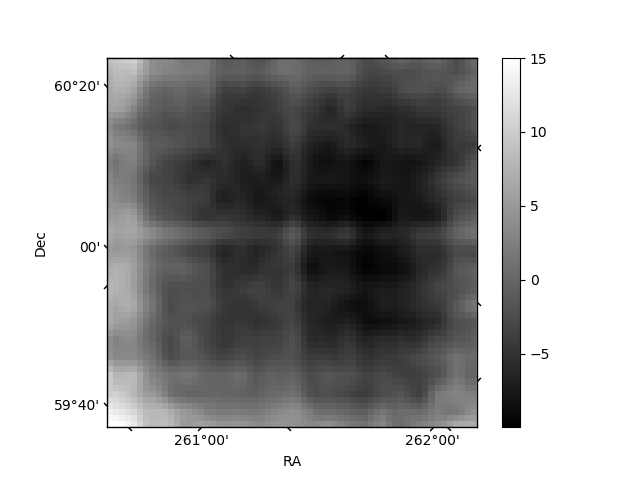
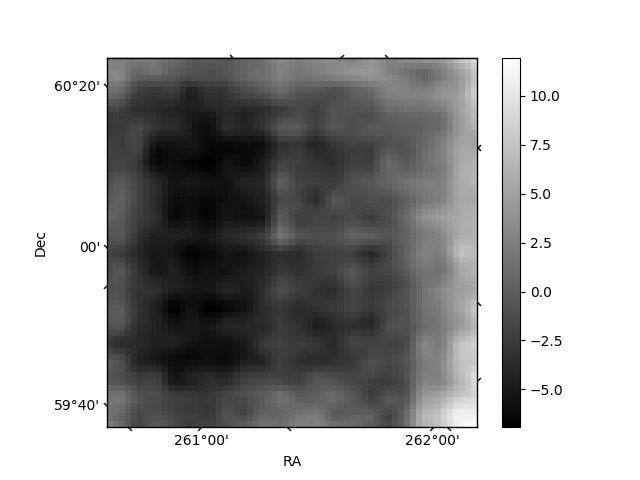
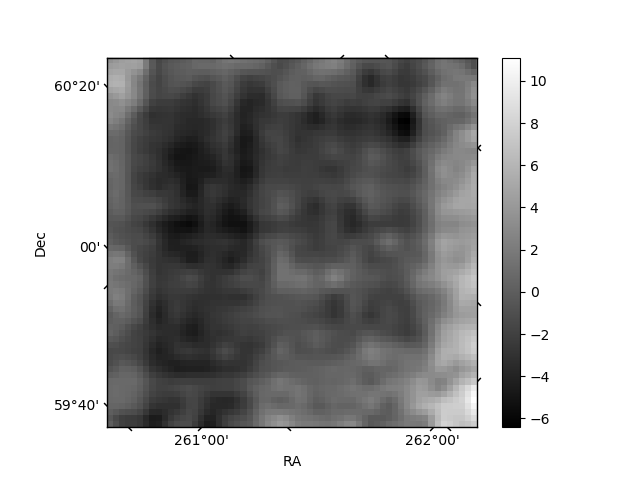
Histogram calculated using DETX and DETY for each event in the final _common_clean file
| Quadrant A | 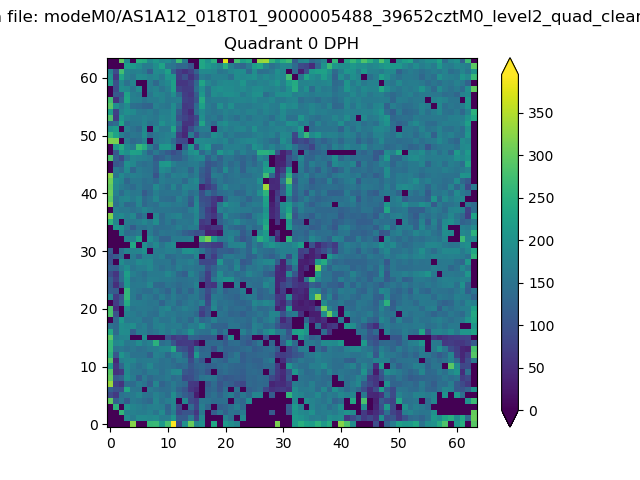 |
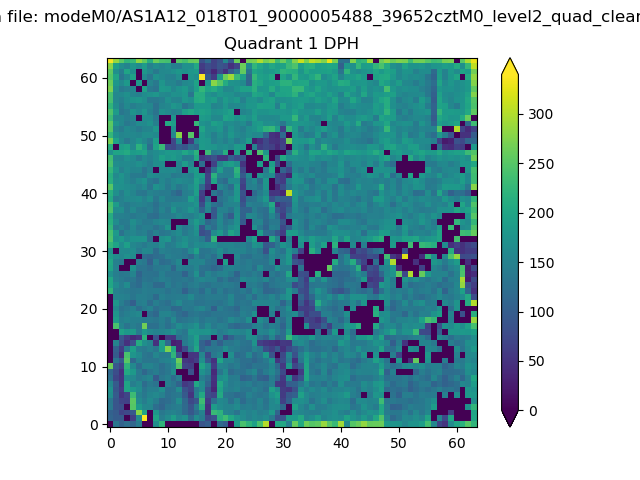 |
Quadrant B |
|---|---|---|---|
| Quadrant D | 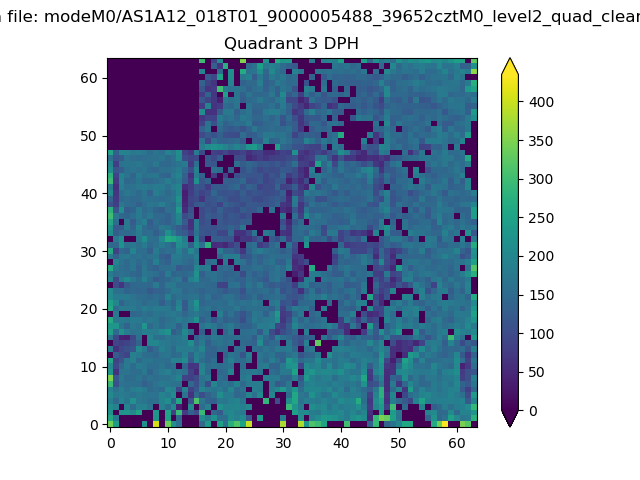 |
 |
Quadrant C |
| Plot type | Count rate plots | Images |
|---|---|---|
| Comparison with Poisson distribution Blue bars denote a histogram of data divided into 1 sec bins. Red curve is a Poisson curve with rate = median count rate of data. |
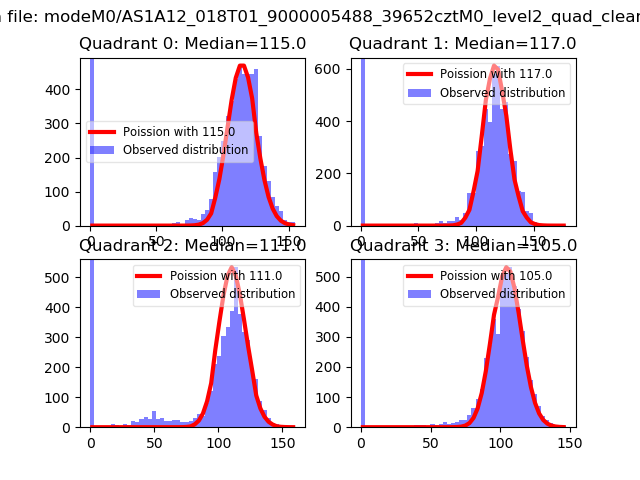 |
 |
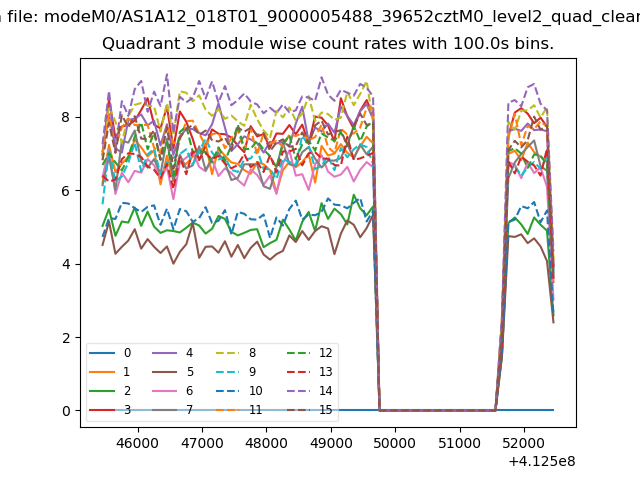
| Quadrant-wise count rates Data is divided into 100 sec bins |
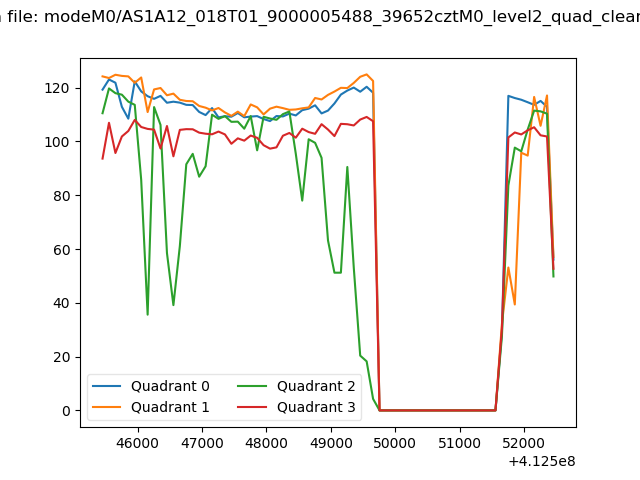 |
|
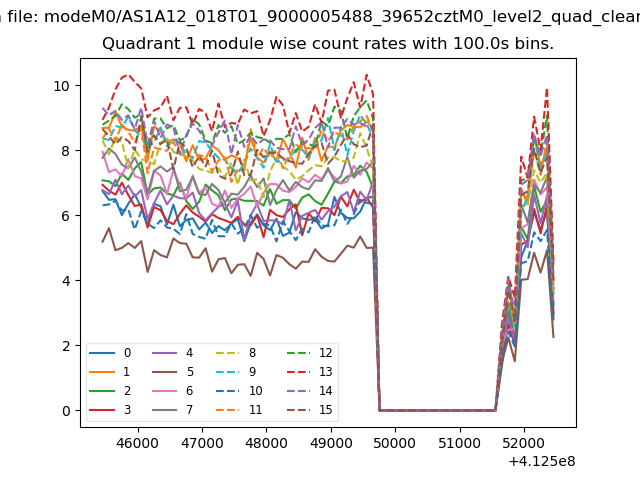
| Module-wise count rates for Quadrant A Data is divided into 100 sec bins |
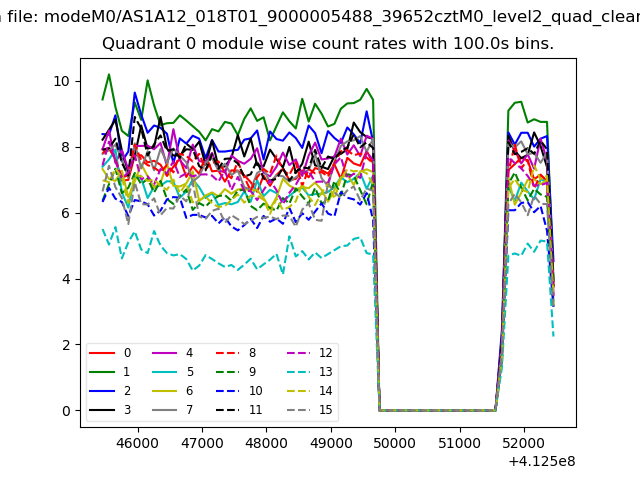 |
 |
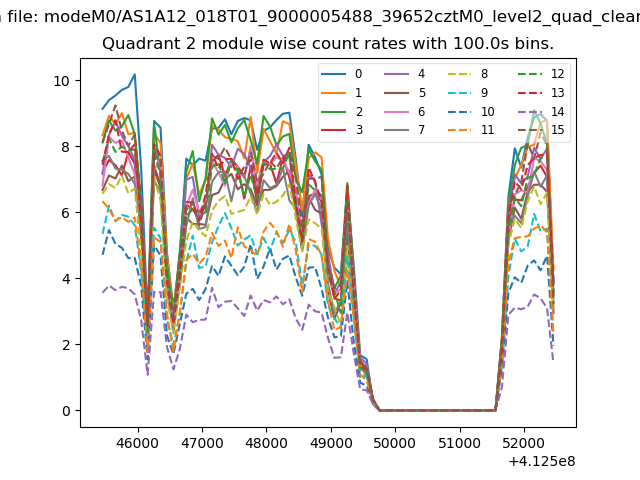
| Module-wise count rates for Quadrant B Data is divided into 100 sec bins |
 |
 |
| Module-wise count rates for Quadrant C Data is divided into 100 sec bins |
 |
 |
| Module-wise count rates for Quadrant D Data is divided into 100 sec bins |
 |
 |
| Parameter | Plot |
|---|---|
| CZT HV Monitor | 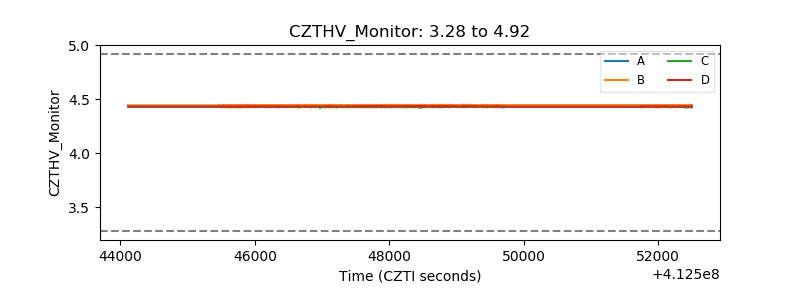 |
| D_VDD | 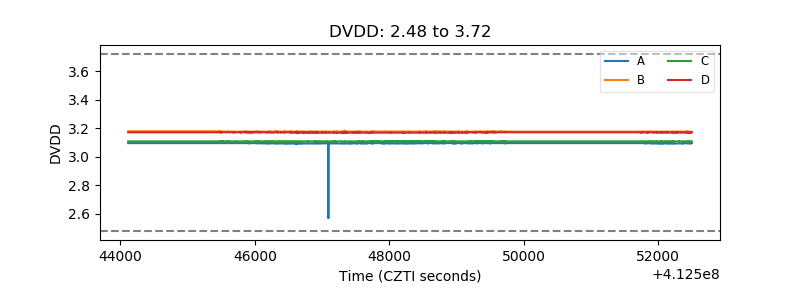 |
| Temperature 1 | 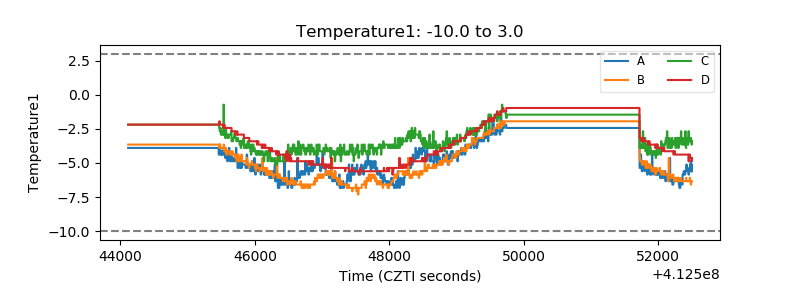 |
| Veto HV Monitor | 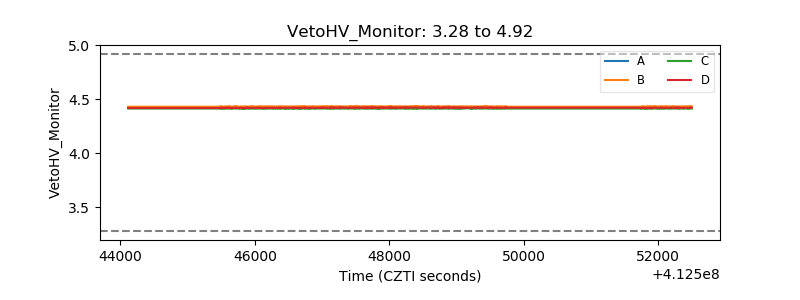 |
| Veto LLD | 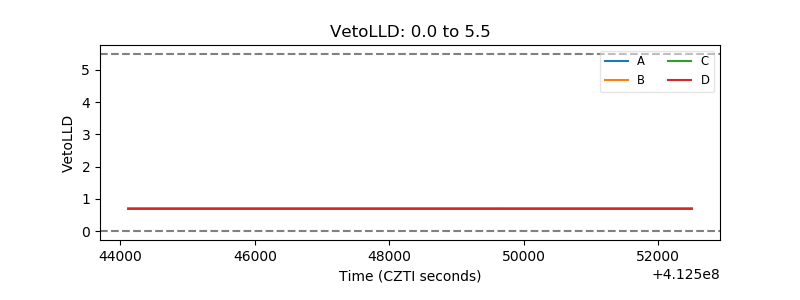 |
| Alpha Counter | 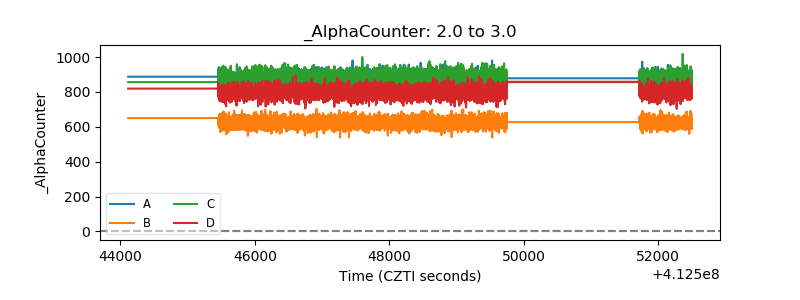 |
| _CPM_Rate | 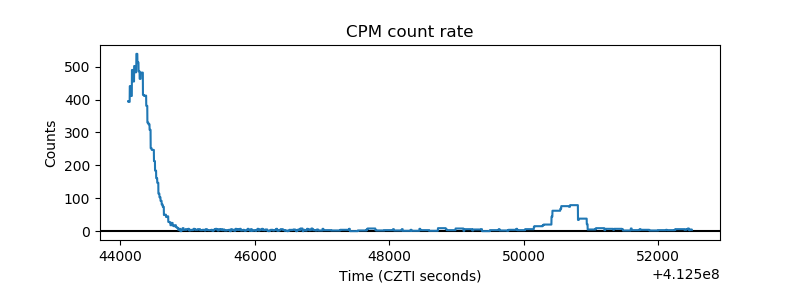 |
| CZT Counter | 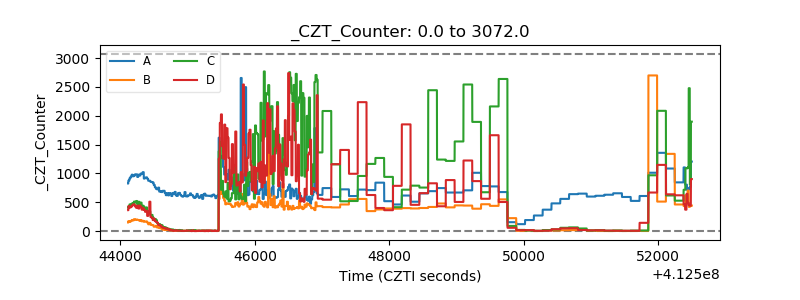 |
| +2.5 Volts monitor | 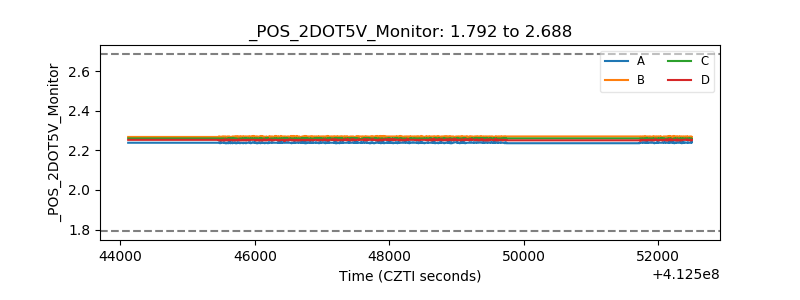 |
| +5 Volts monitor | 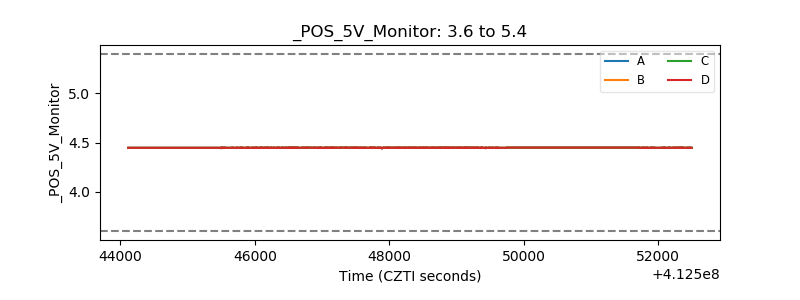 |
| _ROLL_ROT | 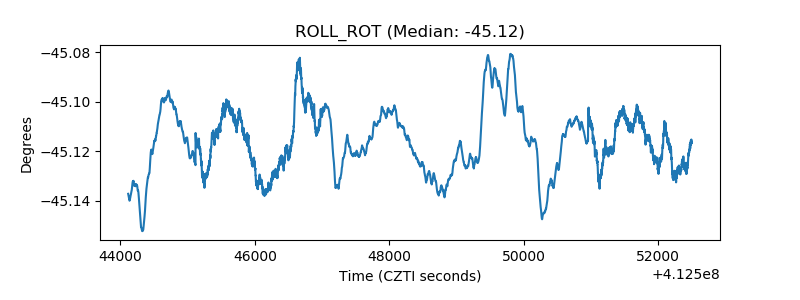 |
| _Roll_DEC | 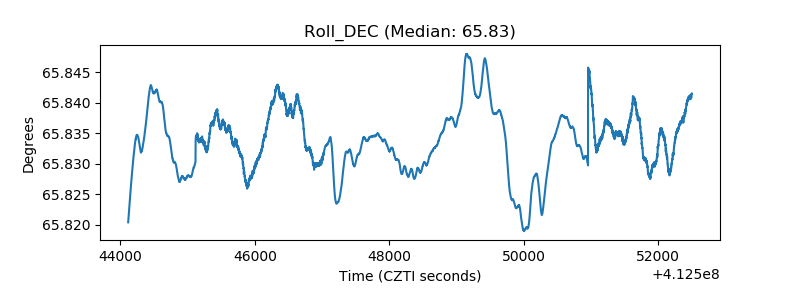 |
| _Roll_RA | 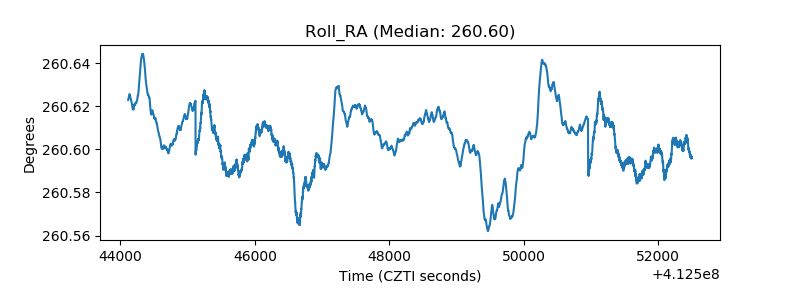 |
| Veto Counter | 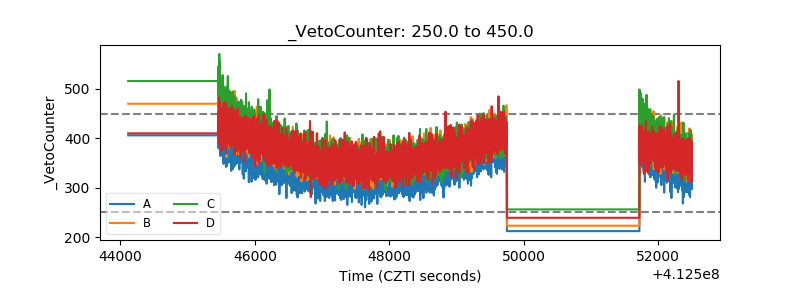 |