| Param | Original file | Final file |
|---|---|---|
| Filename | modeM0/AS1A12_018T01_9000005488_39653cztM0_level2.fits | modeM0/AS1A12_018T01_9000005488_39653cztM0_level2_quad_clean.evt |
| Size (bytes) | 568,062,720 | 88,171,200 |
| Size | 541.7 MB | 84.1 MB |
| Events in quadrant A | 4,316,276 | 619,527 |
| Events in quadrant B | 3,008,586 | 617,131 |
| Events in quadrant C | 8,581,837 | 478,467 |
| Events in quadrant D | 4,685,457 | 560,977 |
| Mode SS | |||
|---|---|---|---|
| Quadrant | BADHDUFLAG | Total packets | Discarded packets |
| A | 0 | 114 | 0 |
| B | 0 | 114 | 0 |
| C | 0 | 114 | 0 |
| D | 0 | 114 | 0 |
| Mode M0 | |||
|---|---|---|---|
| Quadrant | BADHDUFLAG | Total packets | Discarded packets |
| A | 0 | 16664 | 3 |
| B | 0 | 13016 | 2 |
| C | 0 | 29456 | 2 |
| D | 0 | 17823 | 2 |
| Mode M9 | |||
|---|---|---|---|
| Quadrant | BADHDUFLAG | Total packets | Discarded packets |
| A | 0 | 26 | 0 |
| B | 0 | 26 | 0 |
| C | 0 | 26 | 0 |
| D | 0 | 27 | 0 |
| Quadrant | Total seconds | Saturated seconds | Saturation percentage |
|---|---|---|---|
| A | 5627 | 52 | 0.924116% |
| B | 5627 | 203 | 3.607606% |
| C | 5627 | 1575 | 27.990048% |
| D | 5627 | 210 | 3.732006% |
Noise dominated data is calculated using 1-second bins in cleaned event files. If a bin has >2000 counts, and if more than 50% of those come from <1% of pixels, then it is considered to be noise-dominated and hence unusable.
| Quadrant | # 1 sec bins | Bins with >0 counts | Bins with >2000 counts | High rate bins dominated by noise | Noise dominated (total time) | Noise dominated (detector-on time) | Marked lightcurve |
|---|---|---|---|---|---|---|---|
| A | 7240 | 5628 | 15 | 15 | 0.21% | 0.27% | 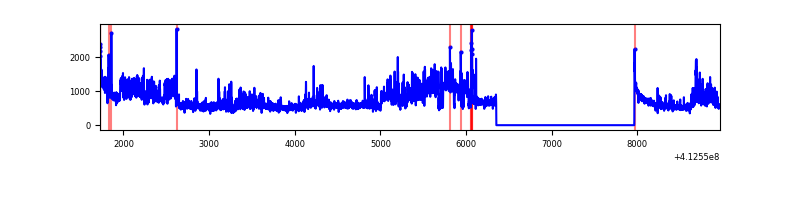 |
| B | 7240 | 5628 | 157 | 157 | 2.17% | 2.79% | 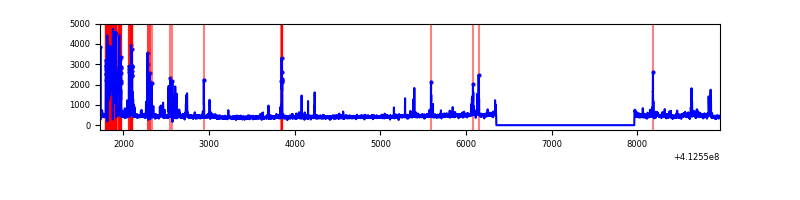 |
| C | 7240 | 5628 | 1714 | 1714 | 23.67% | 30.45% | 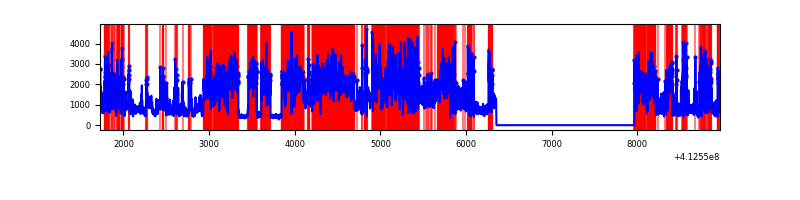 |
| D | 7240 | 5628 | 259 | 259 | 3.58% | 4.60% | 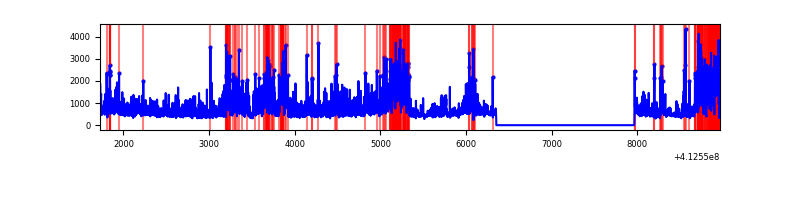 |
Top three noisy pixels from each quadrant. If the there are fewer than three noisy pixels in the level2.evt file, extra rows are filled as -1
| Pixel properties | Quadrant properties | ||||||
|---|---|---|---|---|---|---|---|
| Quadrant | DetID | PixID | Counts | Sigma | Mean | Median | Sigma |
| A | 15 | 222 | 1488320 | 12269.18 | 593 | 580 | 121.3 |
| A | 10 | 83 | 454278 | 3741.58 | 593 | 580 | 121.3 |
| A | 9 | 143 | 39232 | 318.76 | 593 | 580 | 121.3 |
| B | 5 | 172 | 498765 | 4480.37 | 580 | 563 | 111.2 |
| B | 4 | 251 | 66717 | 594.92 | 580 | 563 | 111.2 |
| B | 5 | 255 | 52378 | 465.97 | 580 | 563 | 111.2 |
| C | 15 | 208 | 4575230 | 36876.11 | 530 | 532 | 124.1 |
| C | 9 | 187 | 1547468 | 12469.67 | 530 | 532 | 124.1 |
| C | 15 | 214 | 215769 | 1735.0 | 530 | 532 | 124.1 |
| D | 12 | 227 | 2234228 | 15648.17 | 576 | 561 | 142.7 |
| D | 13 | 249 | 100812 | 702.32 | 576 | 561 | 142.7 |
| D | 2 | 250 | 50492 | 349.8 | 576 | 561 | 142.7 |
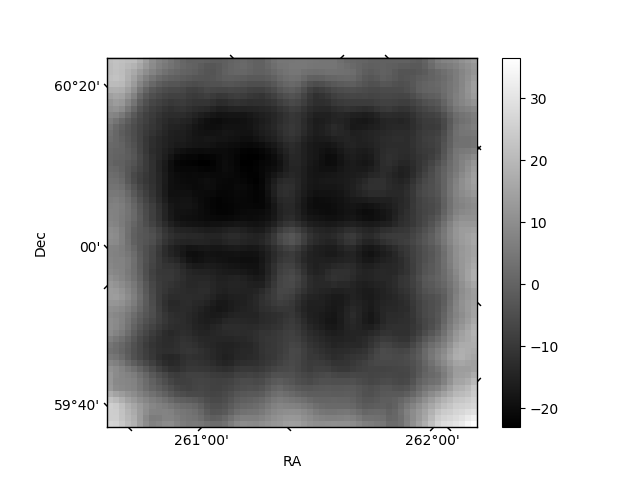
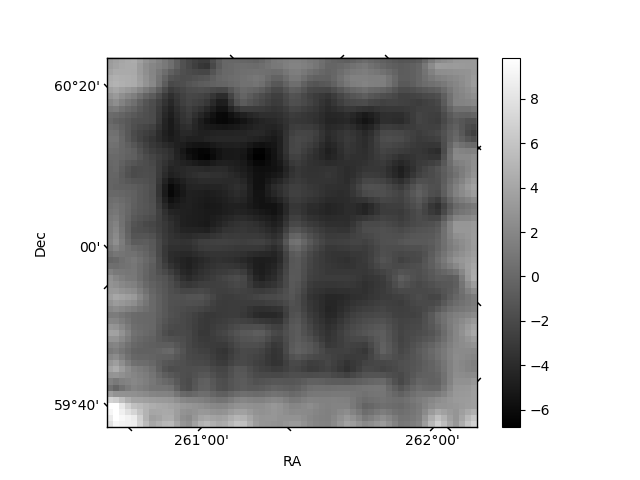
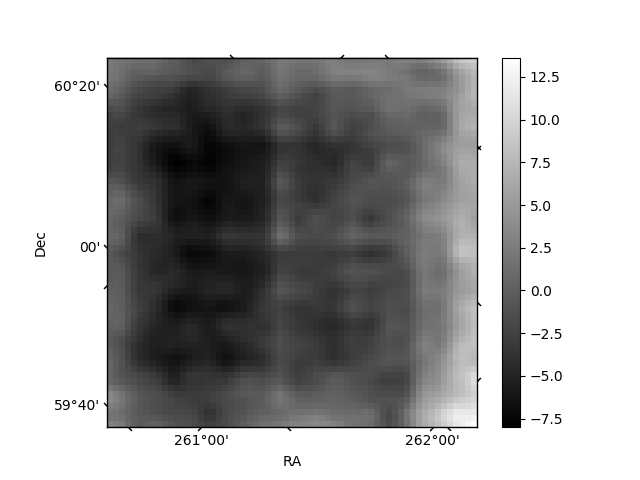
Histogram calculated using DETX and DETY for each event in the final _common_clean file
| Quadrant A | 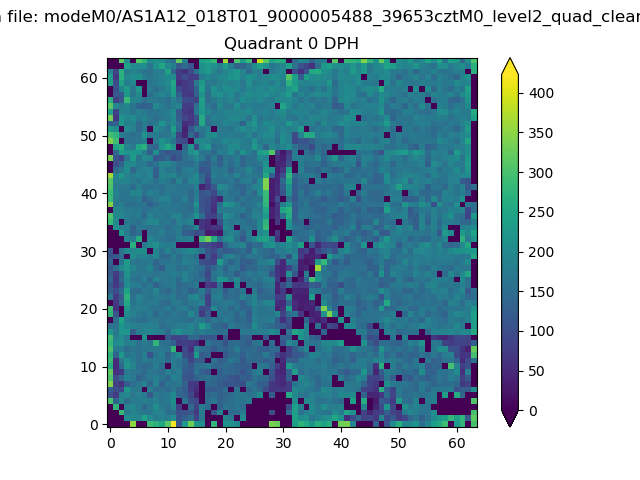 |
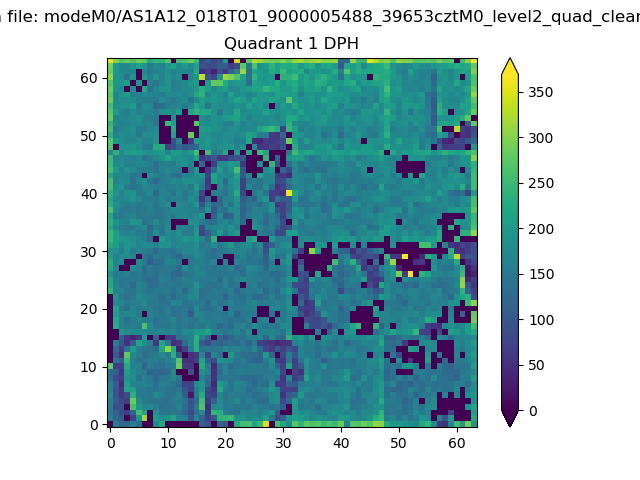 |
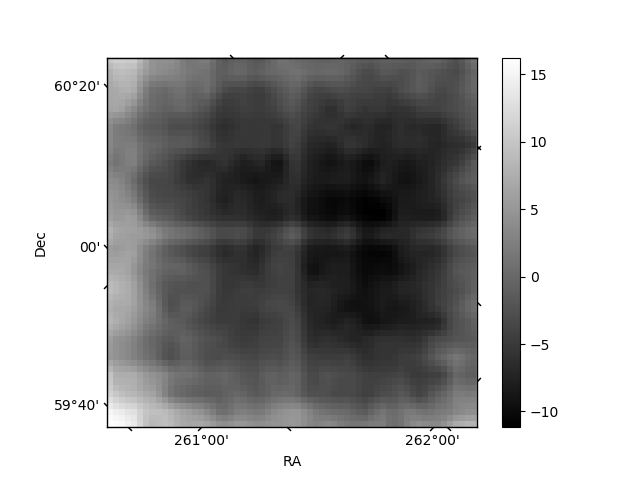
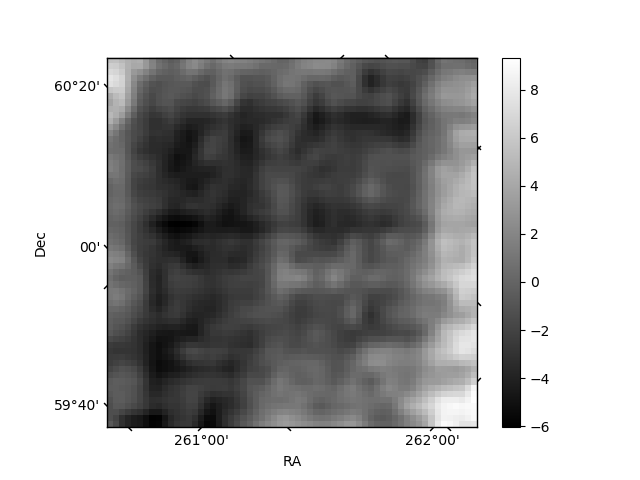
Quadrant B |
|---|---|---|---|
| Quadrant D | 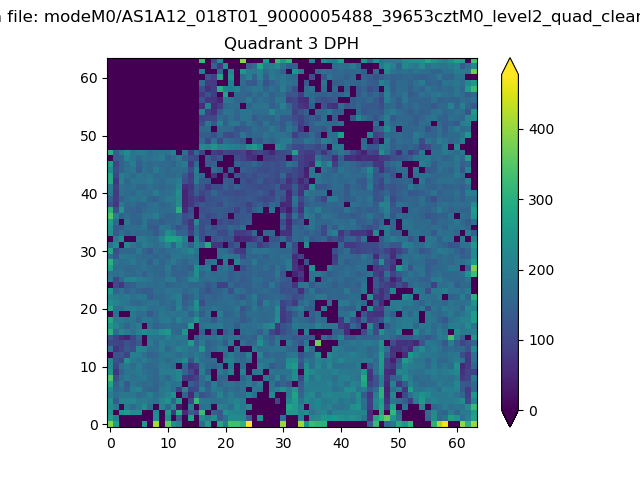 |
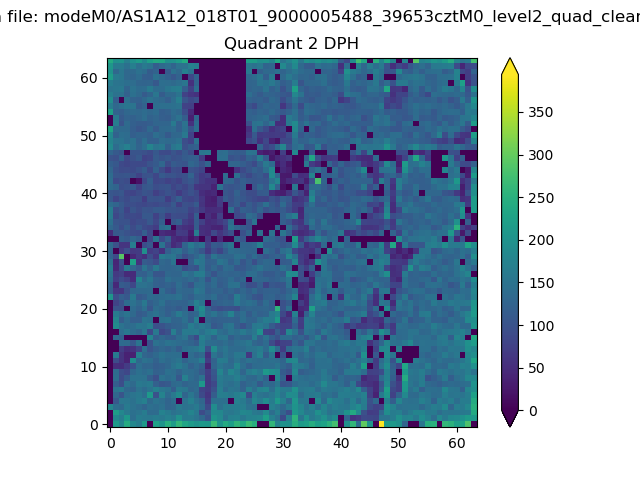 |
Quadrant C |
| Plot type | Count rate plots | Images |
|---|---|---|
| Comparison with Poisson distribution Blue bars denote a histogram of data divided into 1 sec bins. Red curve is a Poisson curve with rate = median count rate of data. |
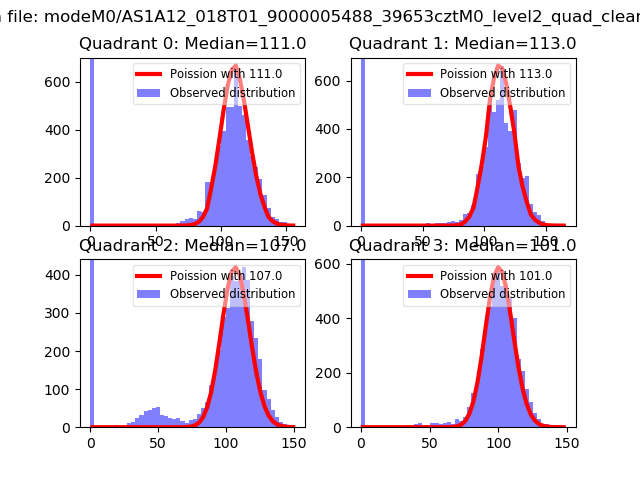 |
 |
| Quadrant-wise count rates Data is divided into 100 sec bins |
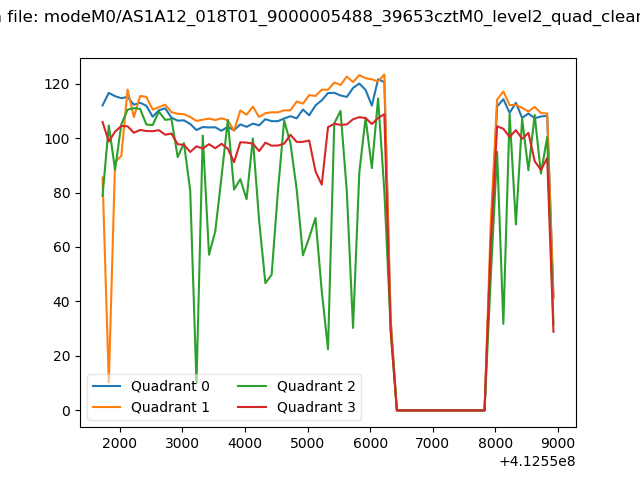 |
|
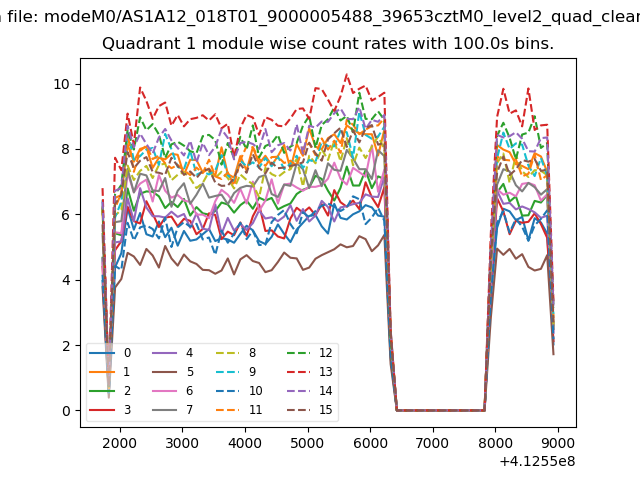
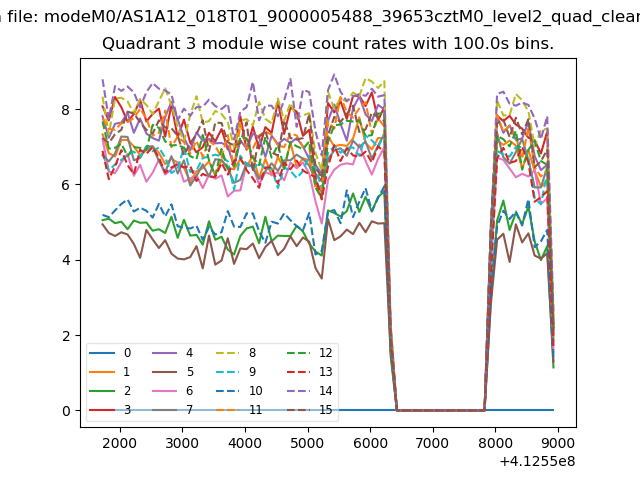
| Module-wise count rates for Quadrant A Data is divided into 100 sec bins |
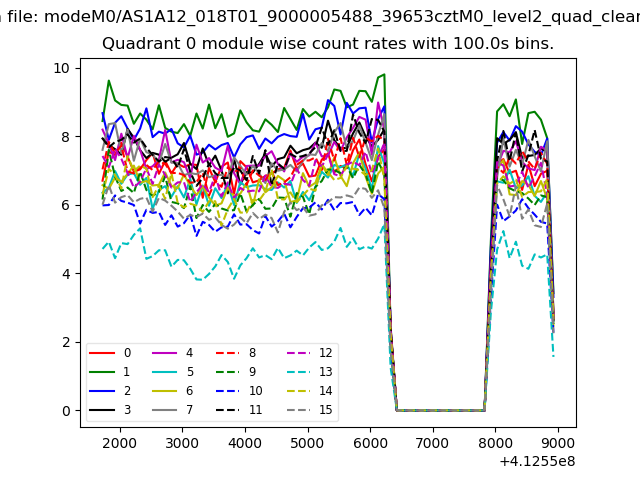 |
 |
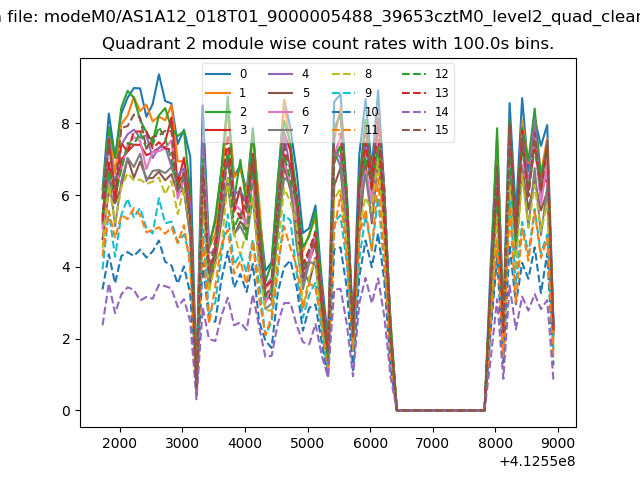
| Module-wise count rates for Quadrant B Data is divided into 100 sec bins |
 |
 |
| Module-wise count rates for Quadrant C Data is divided into 100 sec bins |
 |
 |
| Module-wise count rates for Quadrant D Data is divided into 100 sec bins |
 |
 |
| Parameter | Plot |
|---|---|
| CZT HV Monitor | 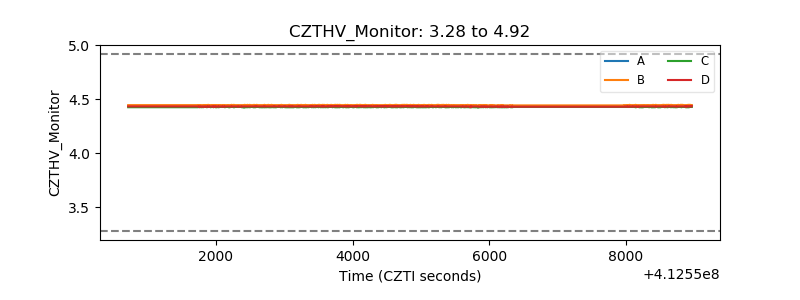 |
| D_VDD | 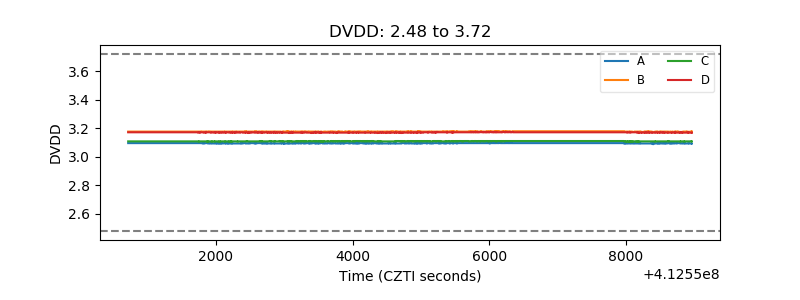 |
| Temperature 1 | 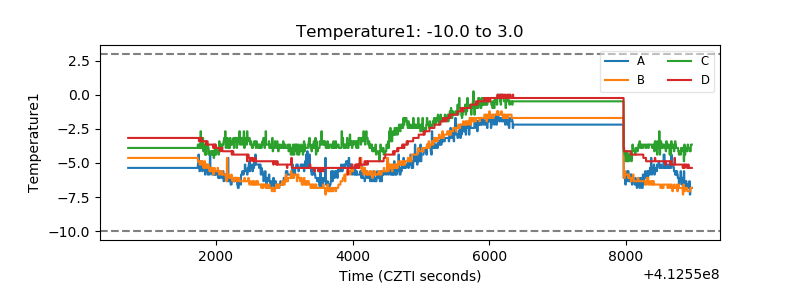 |
| Veto HV Monitor | 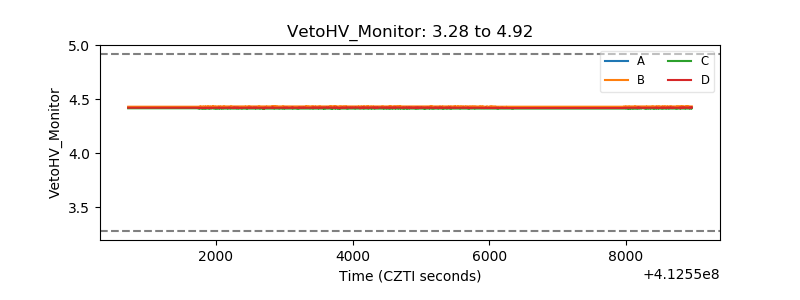 |
| Veto LLD | 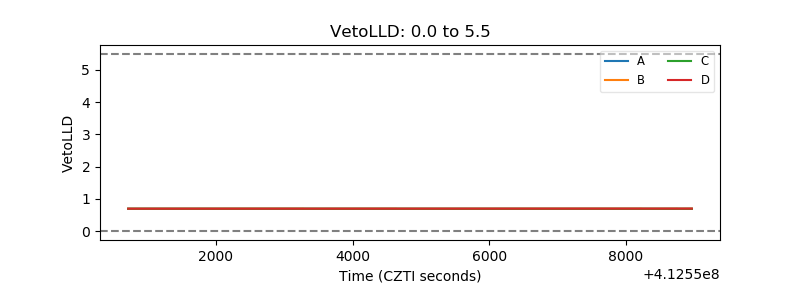 |
| Alpha Counter | 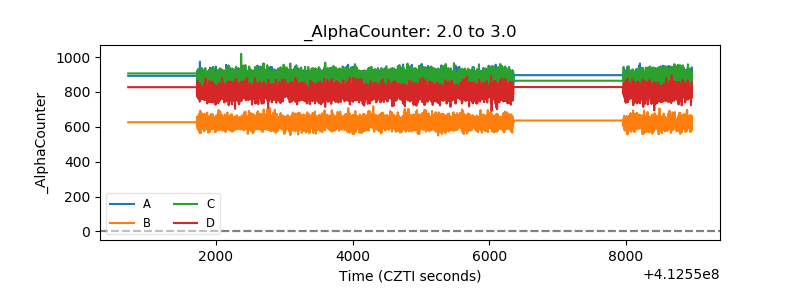 |
| _CPM_Rate | 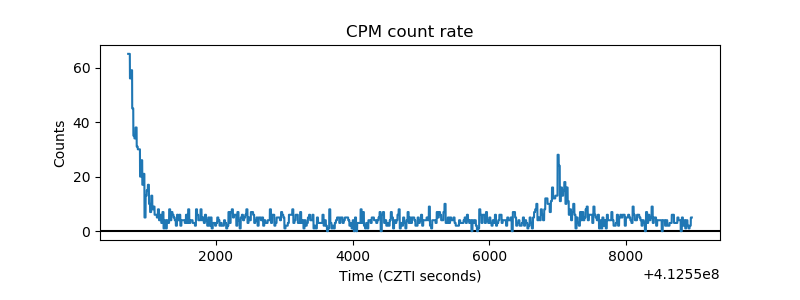 |
| CZT Counter | 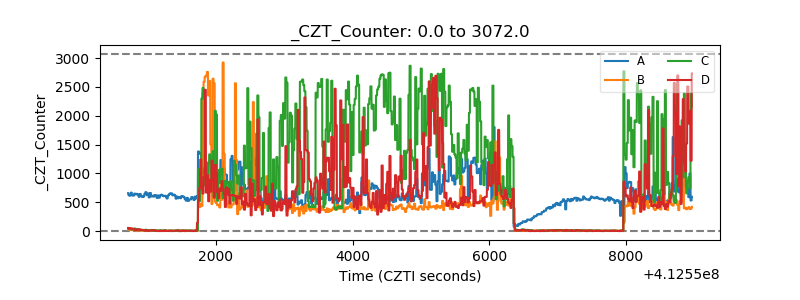 |
| +2.5 Volts monitor | 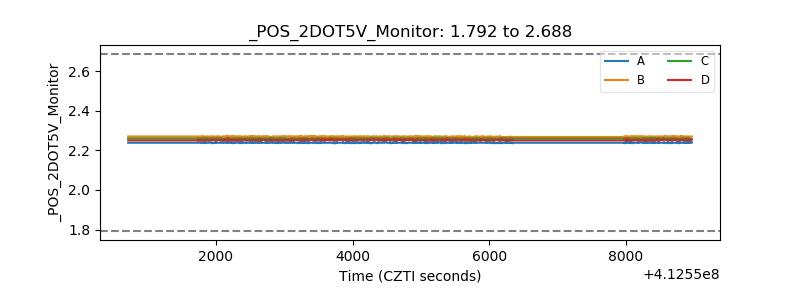 |
| +5 Volts monitor | 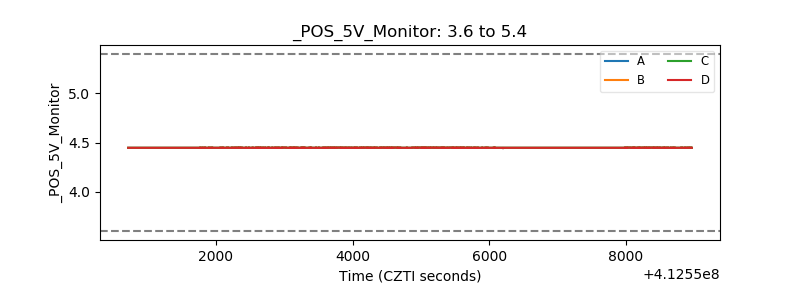 |
| _ROLL_ROT | 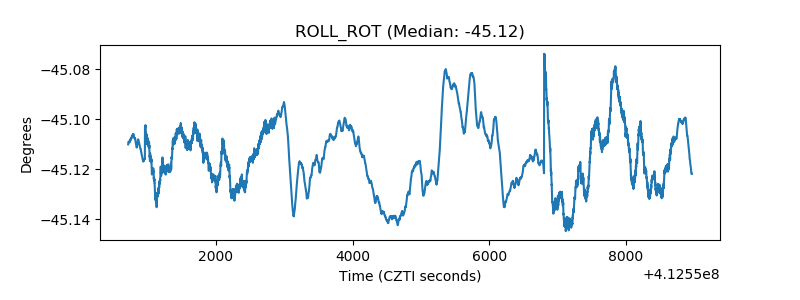 |
| _Roll_DEC | 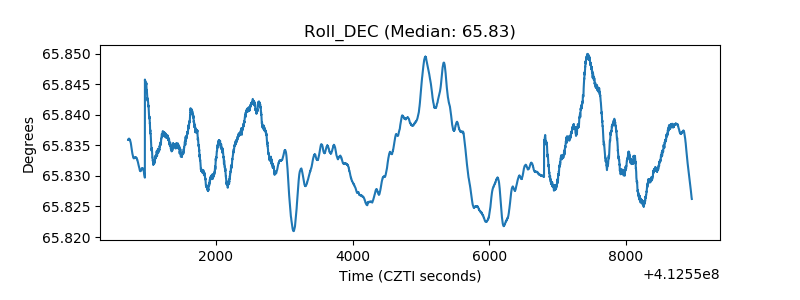 |
| _Roll_RA | 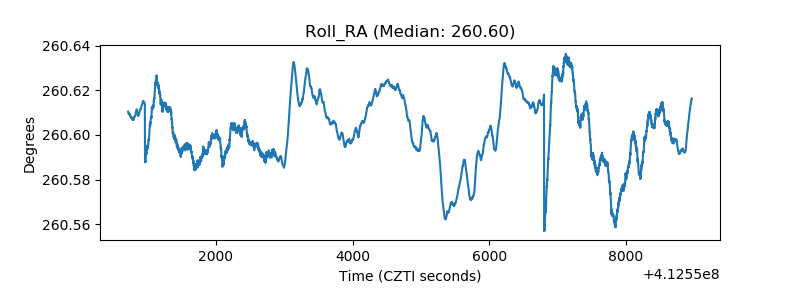 |
| Veto Counter | 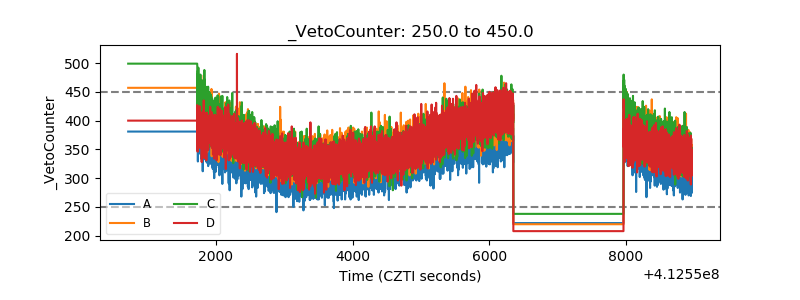 |