| Param | Original file | Final file |
|---|---|---|
| Filename | modeM0/AS1A12_018T01_9000005488_39654cztM0_level2.fits | modeM0/AS1A12_018T01_9000005488_39654cztM0_level2_quad_clean.evt |
| Size (bytes) | 566,628,480 | 93,542,400 |
| Size | 540.4 MB | 89.2 MB |
| Events in quadrant A | 5,428,249 | 639,867 |
| Events in quadrant B | 2,747,458 | 661,813 |
| Events in quadrant C | 8,290,497 | 530,632 |
| Events in quadrant D | 4,049,132 | 585,262 |
| Mode SS | |||
|---|---|---|---|
| Quadrant | BADHDUFLAG | Total packets | Discarded packets |
| A | 0 | 120 | 0 |
| B | 0 | 120 | 0 |
| C | 0 | 120 | 0 |
| D | 0 | 120 | 0 |
| Mode M0 | |||
|---|---|---|---|
| Quadrant | BADHDUFLAG | Total packets | Discarded packets |
| A | 0 | 20278 | 3 |
| B | 0 | 12397 | 2 |
| C | 0 | 28691 | 2 |
| D | 0 | 16406 | 2 |
| Mode M9 | |||
|---|---|---|---|
| Quadrant | BADHDUFLAG | Total packets | Discarded packets |
| A | 0 | 18 | 0 |
| B | 0 | 18 | 0 |
| C | 0 | 18 | 0 |
| D | 0 | 19 | 0 |
| Quadrant | Total seconds | Saturated seconds | Saturation percentage |
|---|---|---|---|
| A | 5933 | 186 | 3.135008% |
| B | 5933 | 24 | 0.404517% |
| C | 5933 | 1360 | 22.922636% |
| D | 5933 | 168 | 2.831620% |
Noise dominated data is calculated using 1-second bins in cleaned event files. If a bin has >2000 counts, and if more than 50% of those come from <1% of pixels, then it is considered to be noise-dominated and hence unusable.
| Quadrant | # 1 sec bins | Bins with >0 counts | Bins with >2000 counts | High rate bins dominated by noise | Noise dominated (total time) | Noise dominated (detector-on time) | Marked lightcurve |
|---|---|---|---|---|---|---|---|
| A | 7306 | 5934 | 96 | 96 | 1.31% | 1.62% | 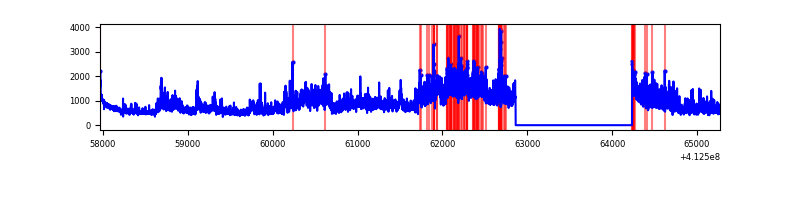 |
| B | 7306 | 5934 | 12 | 12 | 0.16% | 0.20% | 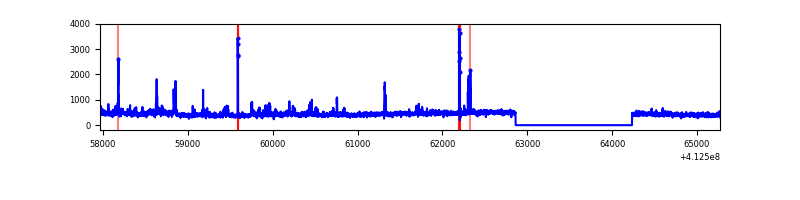 |
| C | 7306 | 5934 | 1259 | 1259 | 17.23% | 21.22% | 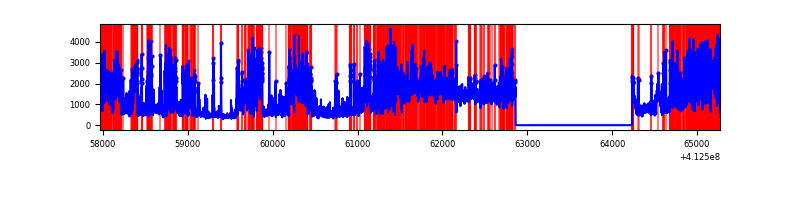 |
| D | 7306 | 5934 | 215 | 215 | 2.94% | 3.62% | 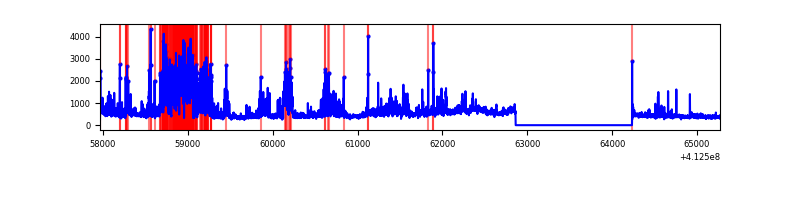 |
Top three noisy pixels from each quadrant. If the there are fewer than three noisy pixels in the level2.evt file, extra rows are filled as -1
| Pixel properties | Quadrant properties | ||||||
|---|---|---|---|---|---|---|---|
| Quadrant | DetID | PixID | Counts | Sigma | Mean | Median | Sigma |
| A | 15 | 222 | 2466006 | 19426.89 | 624 | 610 | 126.9 |
| A | 10 | 83 | 477462 | 3757.51 | 624 | 610 | 126.9 |
| A | 6 | 10 | 37009 | 286.82 | 624 | 610 | 126.9 |
| B | 4 | 251 | 142582 | 1174.43 | 627 | 609 | 120.9 |
| B | 5 | 172 | 48155 | 393.31 | 627 | 609 | 120.9 |
| B | 5 | 255 | 45818 | 373.98 | 627 | 609 | 120.9 |
| C | 15 | 208 | 5179041 | 38629.27 | 575 | 579 | 134.1 |
| C | 9 | 187 | 497433 | 3706.33 | 575 | 579 | 134.1 |
| C | 15 | 214 | 232585 | 1730.67 | 575 | 579 | 134.1 |
| D | 12 | 227 | 1363895 | 9164.19 | 611 | 592 | 148.8 |
| D | 1 | 52 | 152115 | 1018.54 | 611 | 592 | 148.8 |
| D | 13 | 249 | 79622 | 531.24 | 611 | 592 | 148.8 |
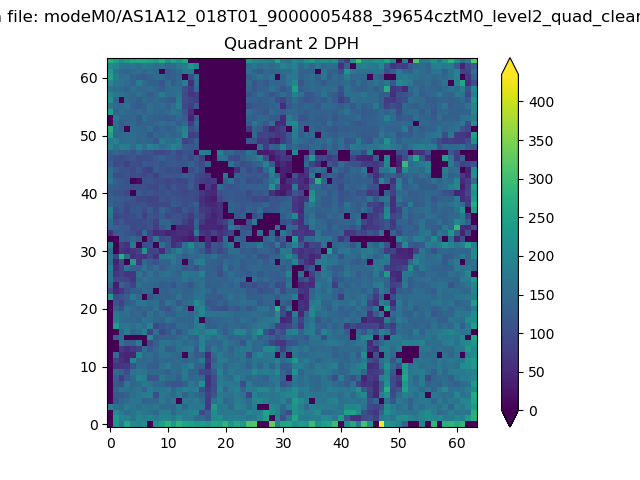
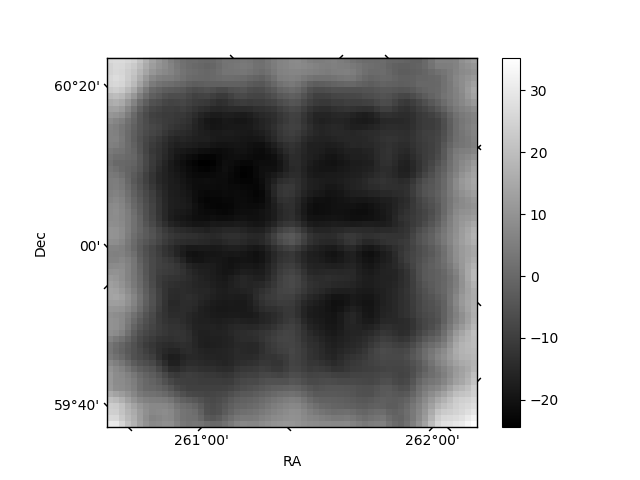
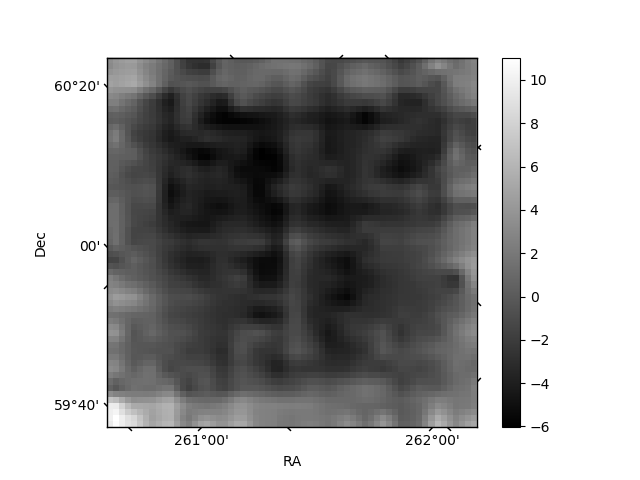
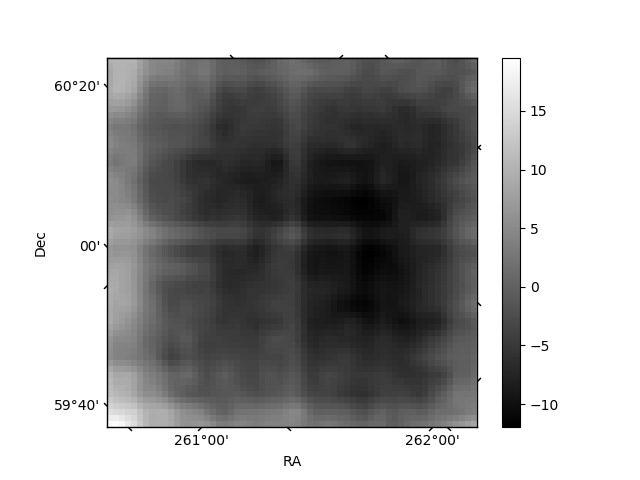
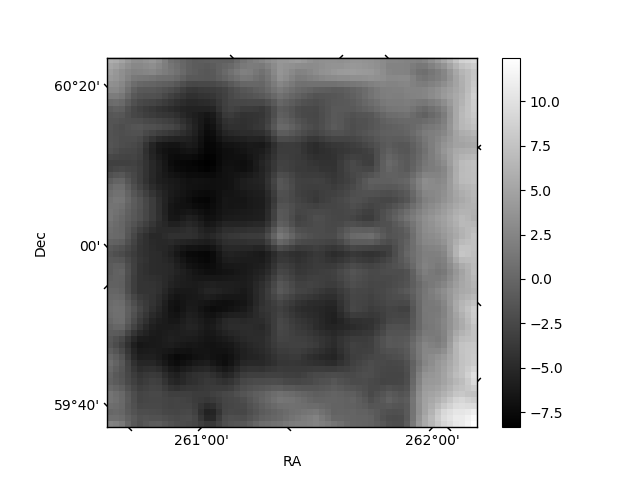
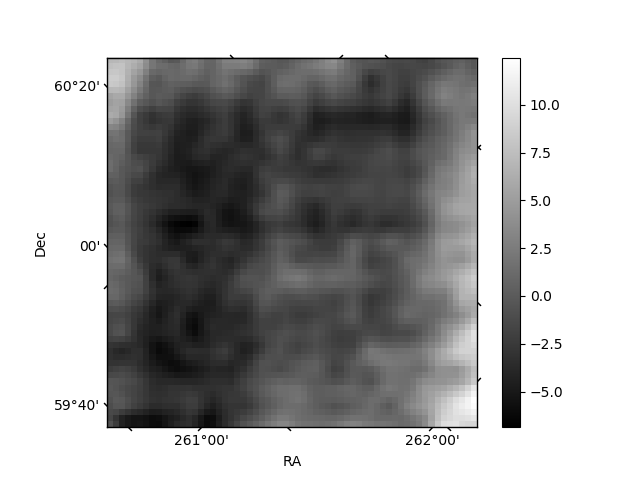
Histogram calculated using DETX and DETY for each event in the final _common_clean file
| Quadrant A | 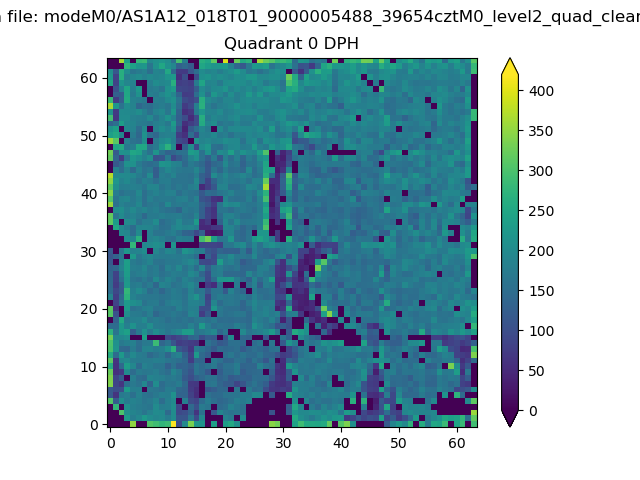 |
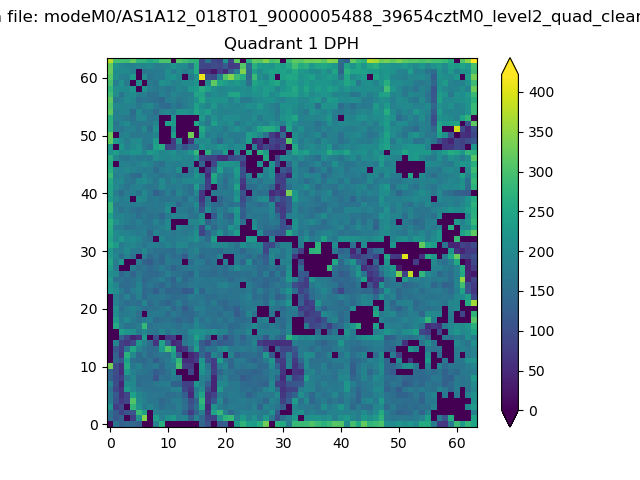 |
Quadrant B |
|---|---|---|---|
| Quadrant D | 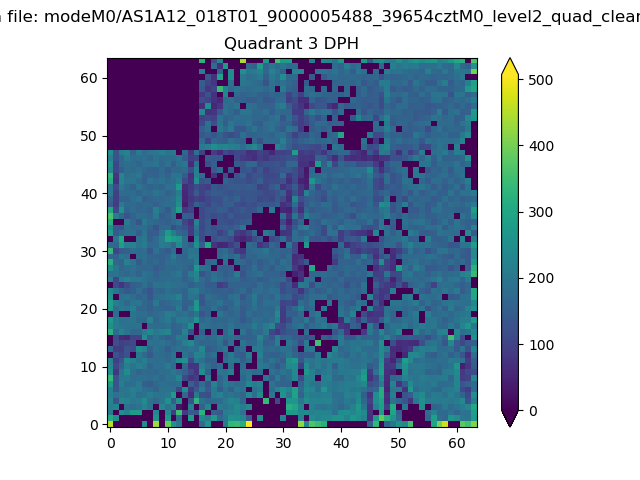 |
 |
Quadrant C |
| Plot type | Count rate plots | Images |
|---|---|---|
| Comparison with Poisson distribution Blue bars denote a histogram of data divided into 1 sec bins. Red curve is a Poisson curve with rate = median count rate of data. |
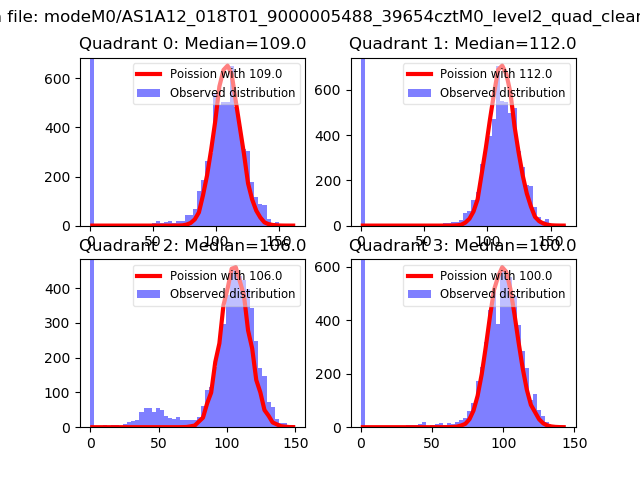 |
 |
| Quadrant-wise count rates Data is divided into 100 sec bins |
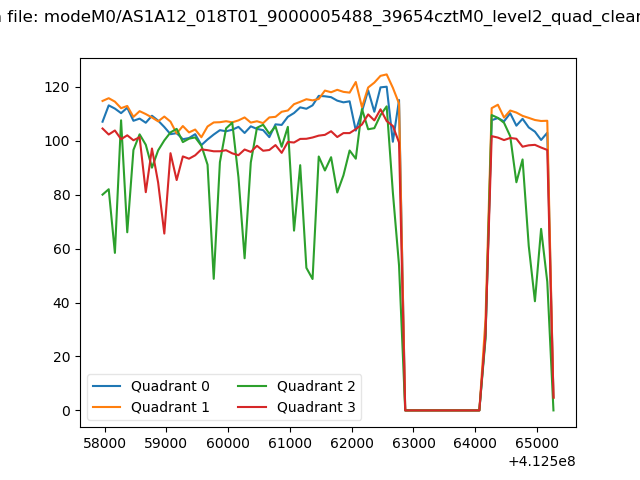 |
|
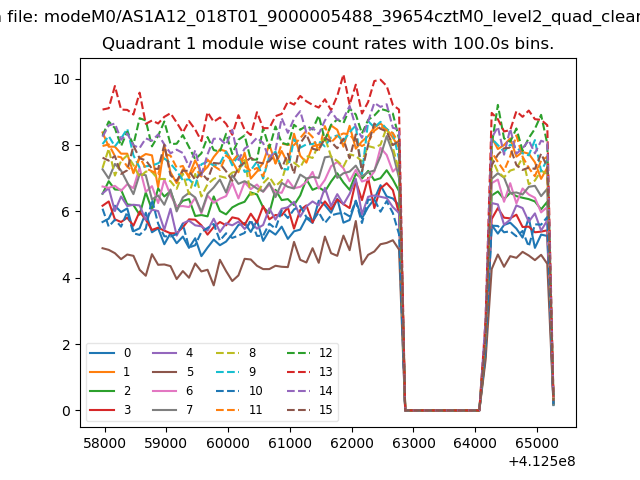
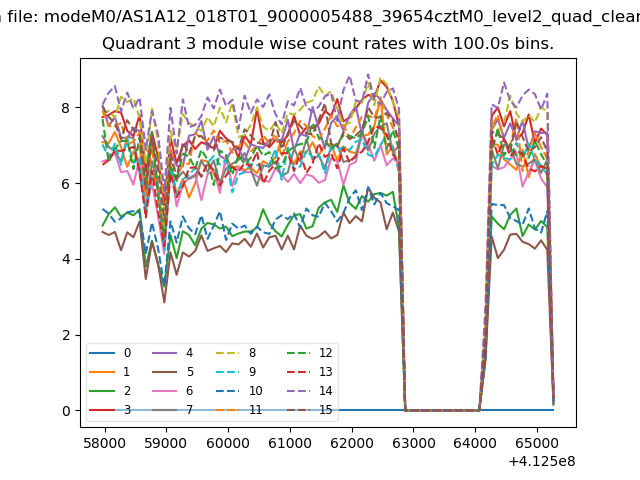
| Module-wise count rates for Quadrant A Data is divided into 100 sec bins |
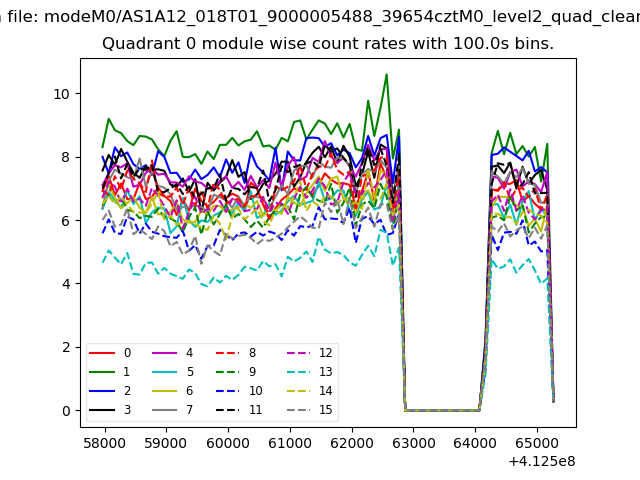 |
 |
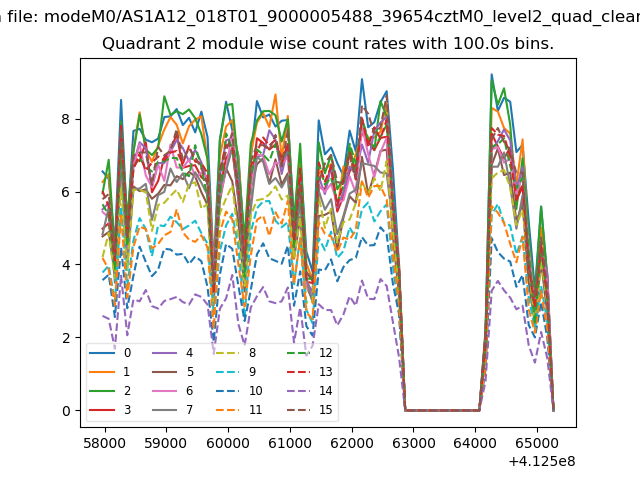
| Module-wise count rates for Quadrant B Data is divided into 100 sec bins |
 |
 |
| Module-wise count rates for Quadrant C Data is divided into 100 sec bins |
 |
 |
| Module-wise count rates for Quadrant D Data is divided into 100 sec bins |
 |
 |
| Parameter | Plot |
|---|---|
| CZT HV Monitor | 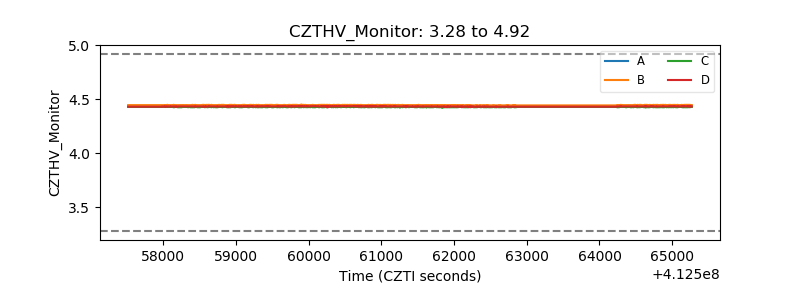 |
| D_VDD | 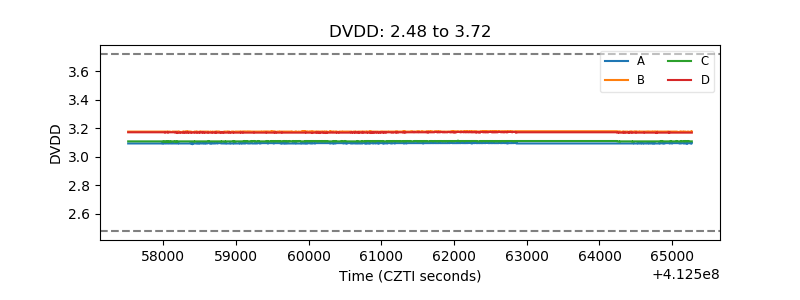 |
| Temperature 1 | 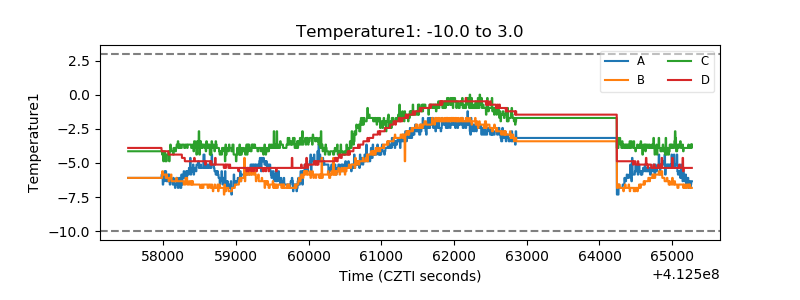 |
| Veto HV Monitor | 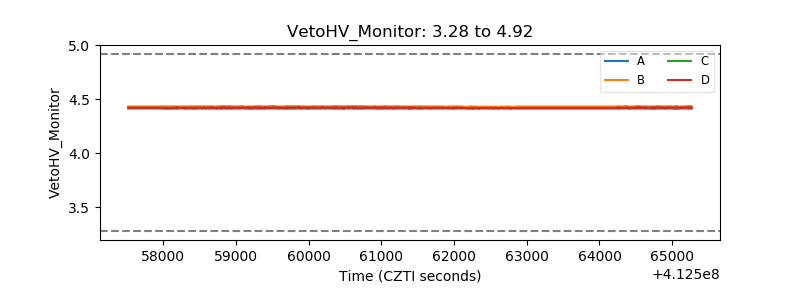 |
| Veto LLD | 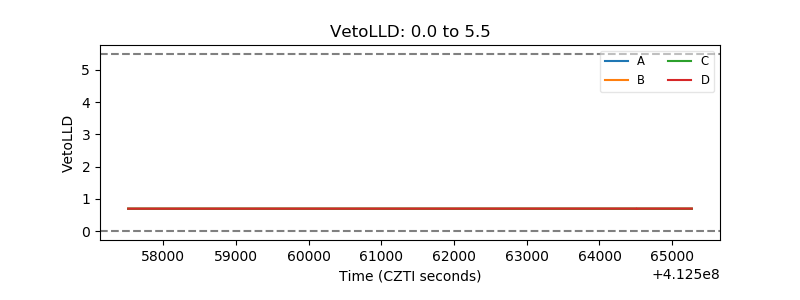 |
| Alpha Counter | 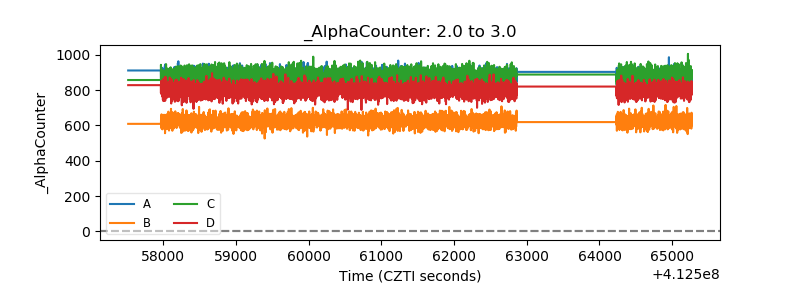 |
| _CPM_Rate | 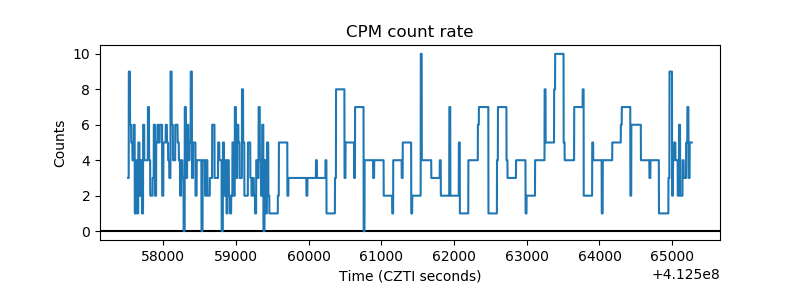 |
| CZT Counter | 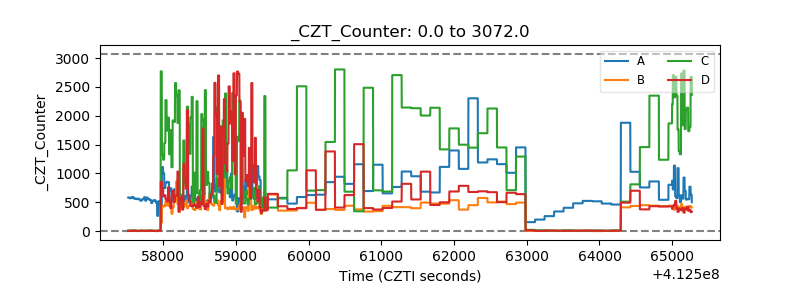 |
| +2.5 Volts monitor |  |
| +5 Volts monitor | 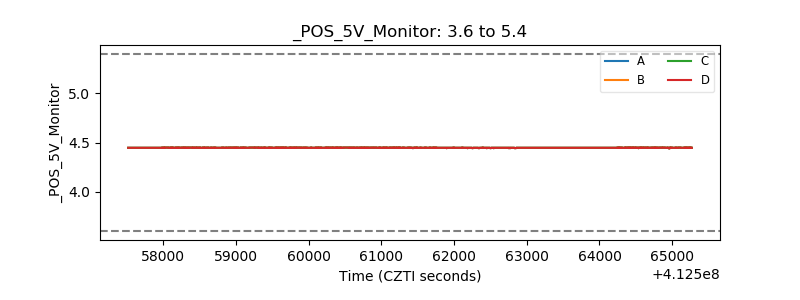 |
| _ROLL_ROT | 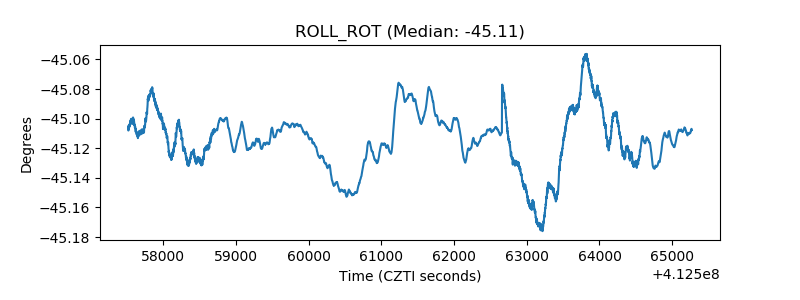 |
| _Roll_DEC | 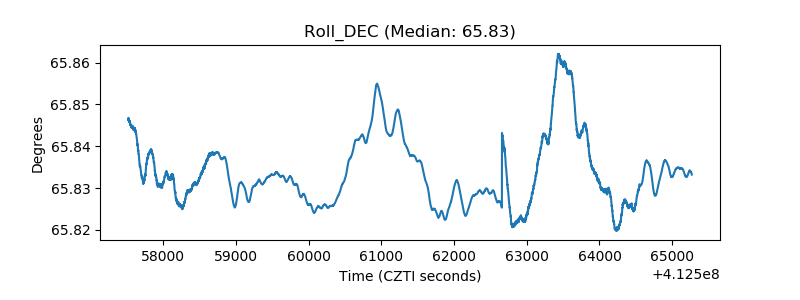 |
| _Roll_RA | 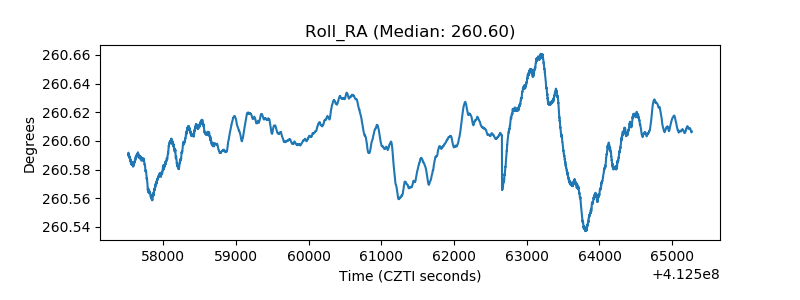 |
| Veto Counter | 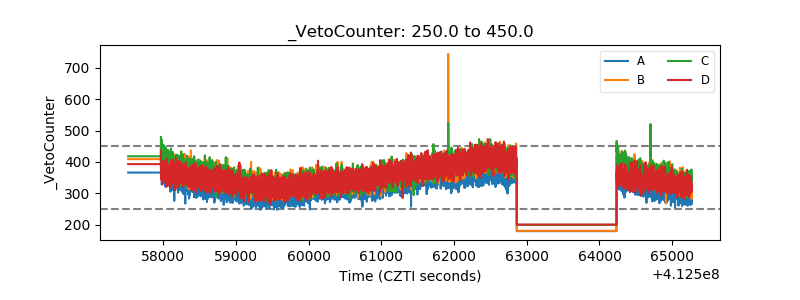 |