| Param | Original file | Final file |
|---|---|---|
| Filename | modeM0/AS1A12_018T01_9000005488_39655cztM0_level2.fits | modeM0/AS1A12_018T01_9000005488_39655cztM0_level2_quad_clean.evt |
| Size (bytes) | 569,718,720 | 97,223,040 |
| Size | 543.3 MB | 92.7 MB |
| Events in quadrant A | 4,716,519 | 684,941 |
| Events in quadrant B | 2,981,481 | 700,790 |
| Events in quadrant C | 8,811,911 | 497,803 |
| Events in quadrant D | 4,091,109 | 620,724 |
| Mode SS | |||
|---|---|---|---|
| Quadrant | BADHDUFLAG | Total packets | Discarded packets |
| A | 0 | 130 | 0 |
| B | 0 | 130 | 0 |
| C | 0 | 130 | 0 |
| D | 0 | 130 | 0 |
| Mode M0 | |||
|---|---|---|---|
| Quadrant | BADHDUFLAG | Total packets | Discarded packets |
| A | 0 | 18365 | 3 |
| B | 0 | 13572 | 2 |
| C | 0 | 30547 | 2 |
| D | 0 | 16988 | 2 |
| Mode M9 | |||
|---|---|---|---|
| Quadrant | BADHDUFLAG | Total packets | Discarded packets |
| A | 0 | 26 | 0 |
| B | 0 | 26 | 0 |
| C | 0 | 26 | 0 |
| D | 0 | 26 | 0 |
| Quadrant | Total seconds | Saturated seconds | Saturation percentage |
|---|---|---|---|
| A | 6294 | 88 | 1.398157% |
| B | 6294 | 70 | 1.112170% |
| C | 6294 | 1888 | 29.996822% |
| D | 6294 | 137 | 2.176676% |
Noise dominated data is calculated using 1-second bins in cleaned event files. If a bin has >2000 counts, and if more than 50% of those come from <1% of pixels, then it is considered to be noise-dominated and hence unusable.
| Quadrant | # 1 sec bins | Bins with >0 counts | Bins with >2000 counts | High rate bins dominated by noise | Noise dominated (total time) | Noise dominated (detector-on time) | Marked lightcurve |
|---|---|---|---|---|---|---|---|
| A | 8950 | 6296 | 42 | 42 | 0.47% | 0.67% | 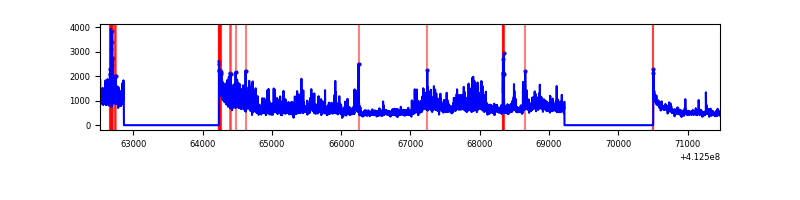 |
| B | 8950 | 6296 | 36 | 36 | 0.40% | 0.57% | 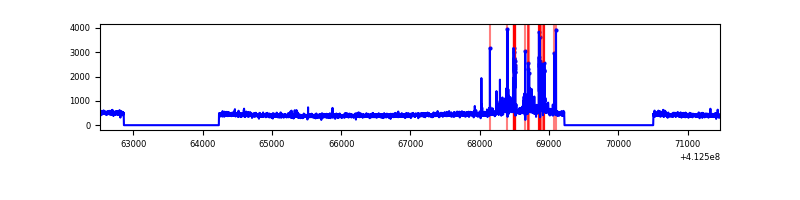 |
| C | 8950 | 6296 | 1621 | 1621 | 18.11% | 25.75% |  |
| D | 8950 | 6296 | 185 | 185 | 2.07% | 2.94% | 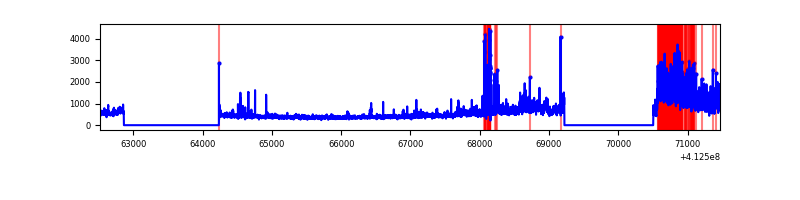 |
Top three noisy pixels from each quadrant. If the there are fewer than three noisy pixels in the level2.evt file, extra rows are filled as -1
| Pixel properties | Quadrant properties | ||||||
|---|---|---|---|---|---|---|---|
| Quadrant | DetID | PixID | Counts | Sigma | Mean | Median | Sigma |
| A | 15 | 222 | 1525559 | 11054.82 | 675 | 661 | 137.9 |
| A | 10 | 83 | 492244 | 3563.76 | 675 | 661 | 137.9 |
| A | 6 | 10 | 35252 | 250.77 | 675 | 661 | 137.9 |
| B | 5 | 172 | 100945 | 776.17 | 672 | 654 | 129.2 |
| B | 4 | 67 | 98838 | 759.86 | 672 | 654 | 129.2 |
| B | 5 | 255 | 83544 | 641.5 | 672 | 654 | 129.2 |
| C | 15 | 208 | 5078266 | 37010.7 | 587 | 590 | 137.2 |
| C | 14 | 254 | 595356 | 4335.19 | 587 | 590 | 137.2 |
| C | 9 | 187 | 452912 | 3296.93 | 587 | 590 | 137.2 |
| D | 12 | 227 | 1172920 | 7263.81 | 659 | 639 | 161.4 |
| D | 12 | 233 | 142731 | 880.45 | 659 | 639 | 161.4 |
| D | 1 | 52 | 140200 | 864.76 | 659 | 639 | 161.4 |
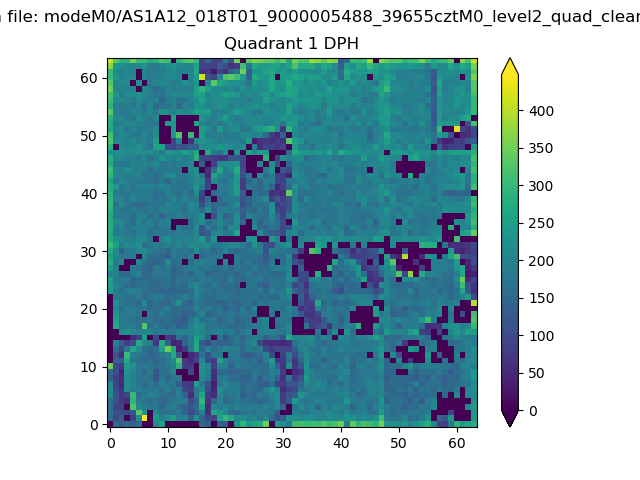
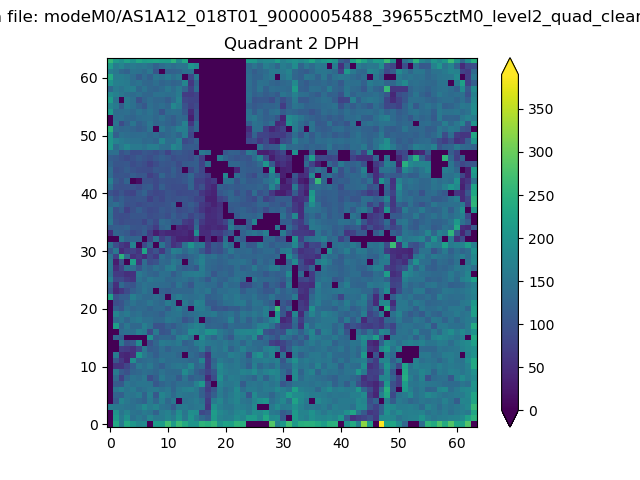
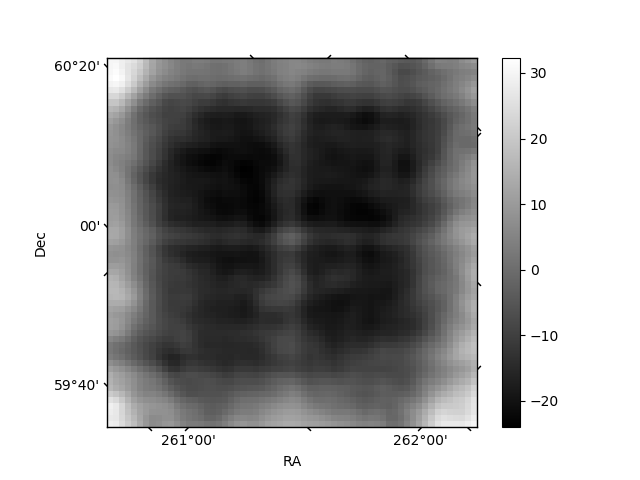
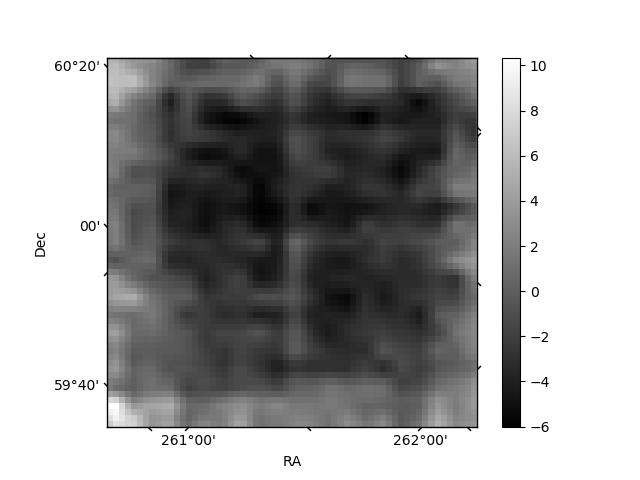
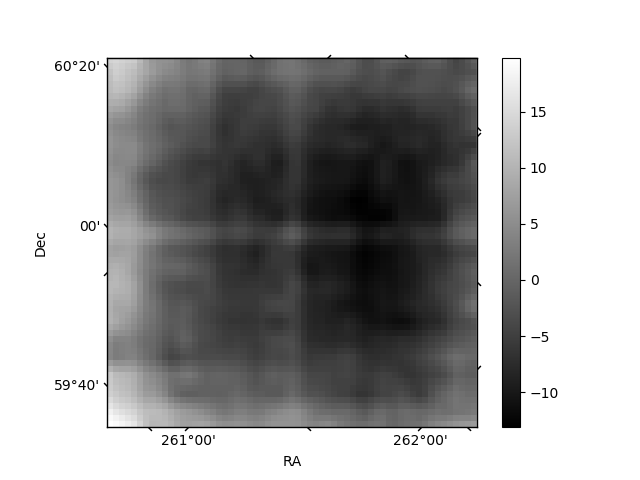
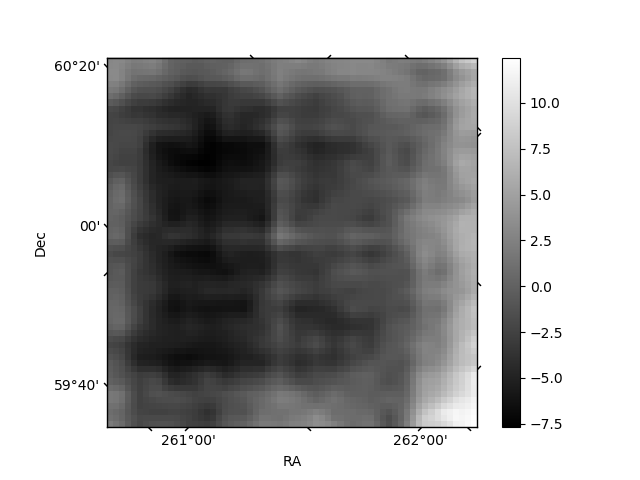
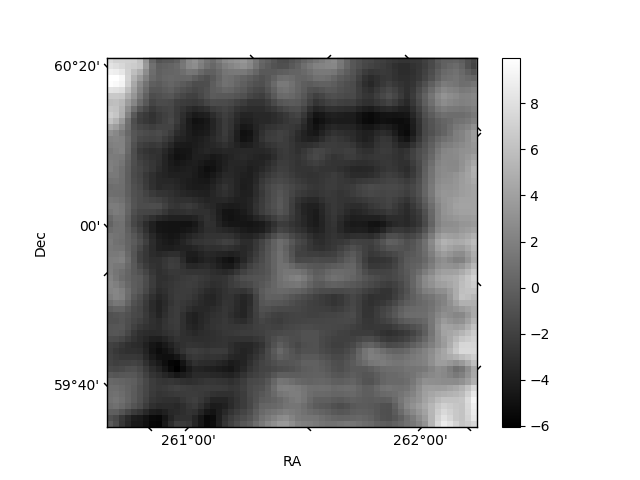
Histogram calculated using DETX and DETY for each event in the final _common_clean file
| Quadrant A | 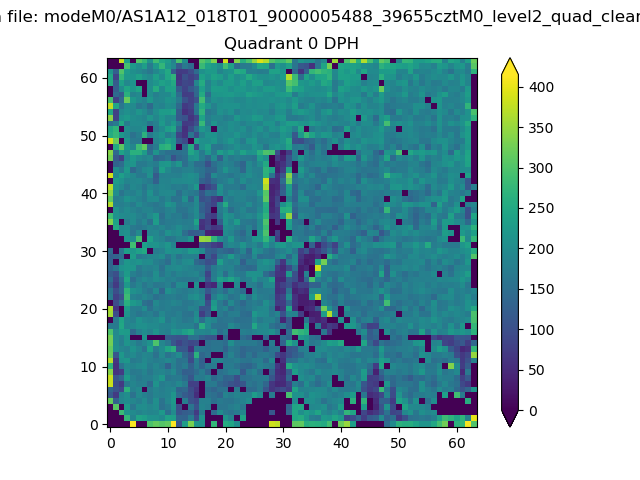 |
 |
Quadrant B |
|---|---|---|---|
| Quadrant D | 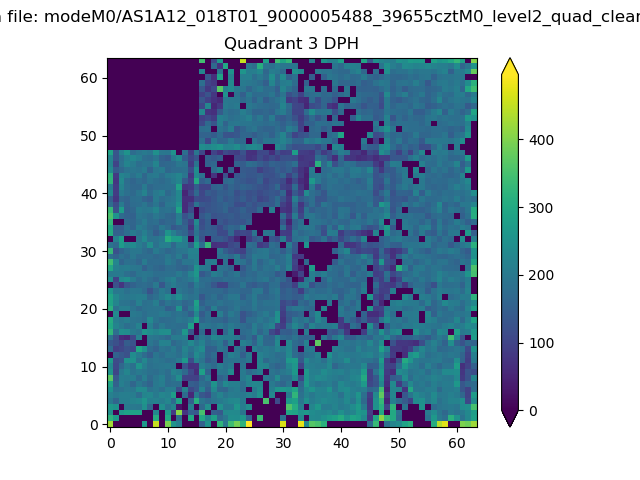 |
 |
Quadrant C |
| Plot type | Count rate plots | Images |
|---|---|---|
| Comparison with Poisson distribution Blue bars denote a histogram of data divided into 1 sec bins. Red curve is a Poisson curve with rate = median count rate of data. |
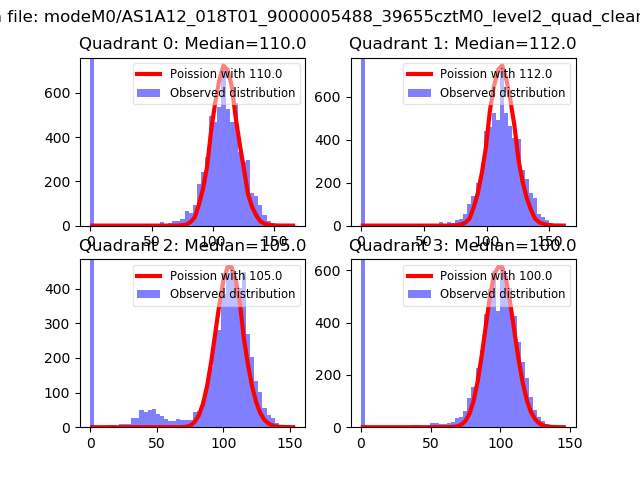 |
 |
| Quadrant-wise count rates Data is divided into 100 sec bins |
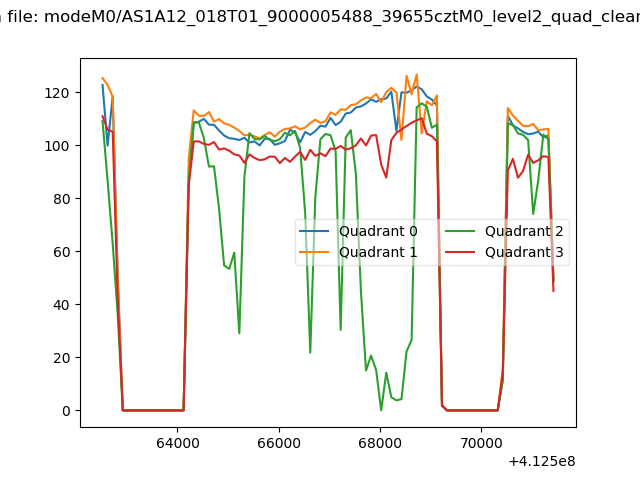 |
|
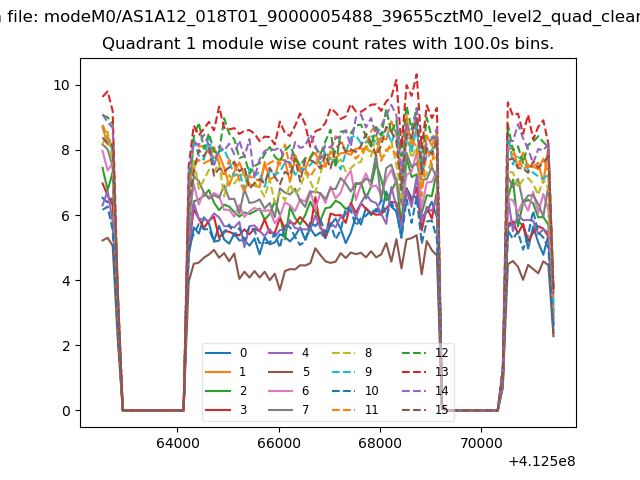
| Module-wise count rates for Quadrant A Data is divided into 100 sec bins |
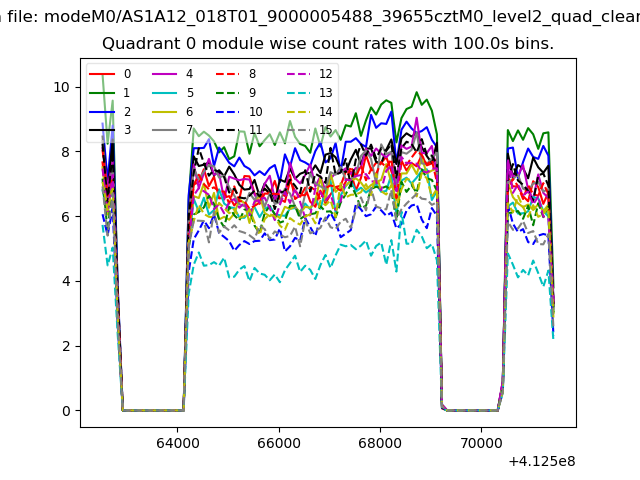 |
 |
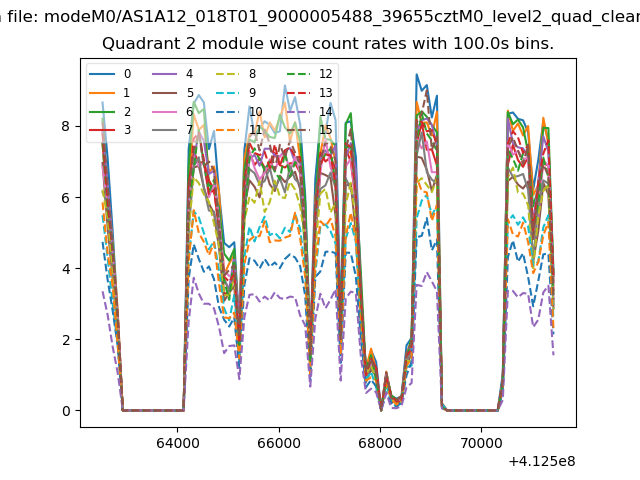
| Module-wise count rates for Quadrant B Data is divided into 100 sec bins |
 |
 |
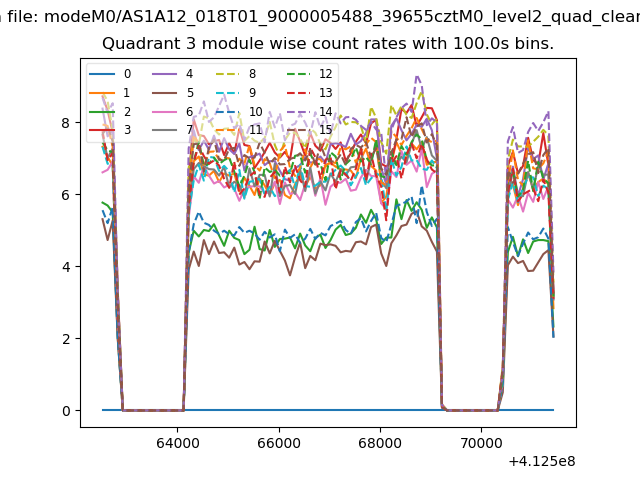
| Module-wise count rates for Quadrant C Data is divided into 100 sec bins |
 |
 |
| Module-wise count rates for Quadrant D Data is divided into 100 sec bins |
 |
 |
| Parameter | Plot |
|---|---|
| CZT HV Monitor | 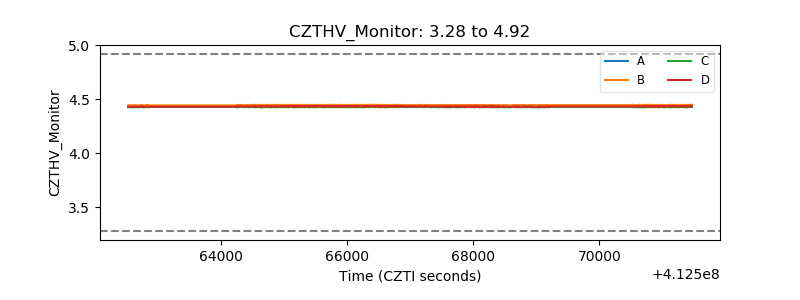 |
| D_VDD | 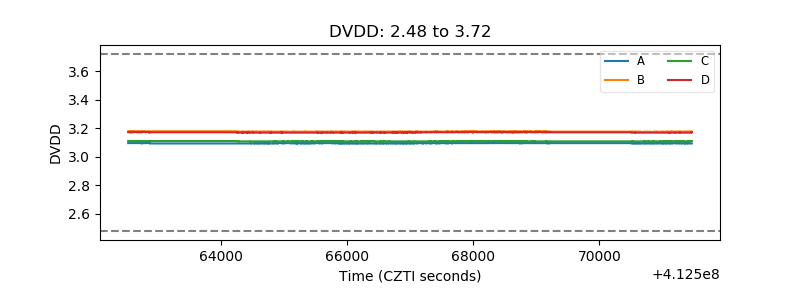 |
| Temperature 1 | 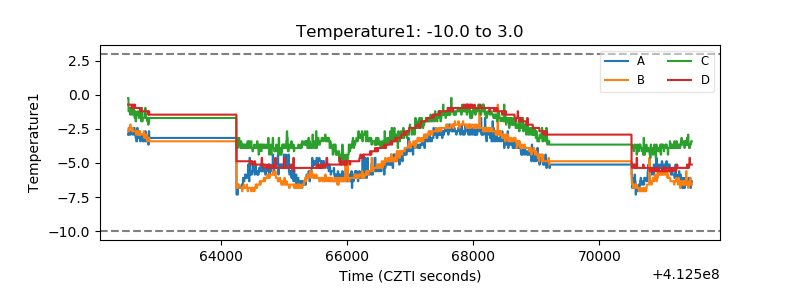 |
| Veto HV Monitor | 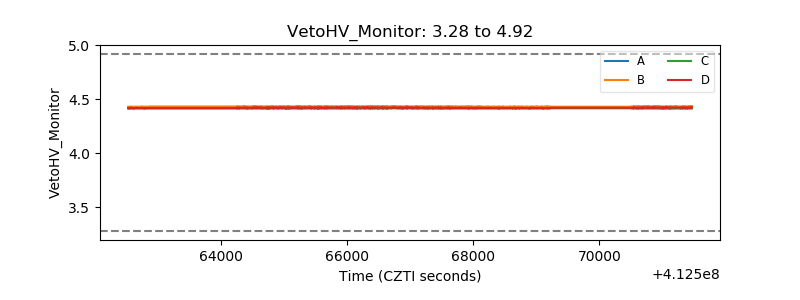 |
| Veto LLD | 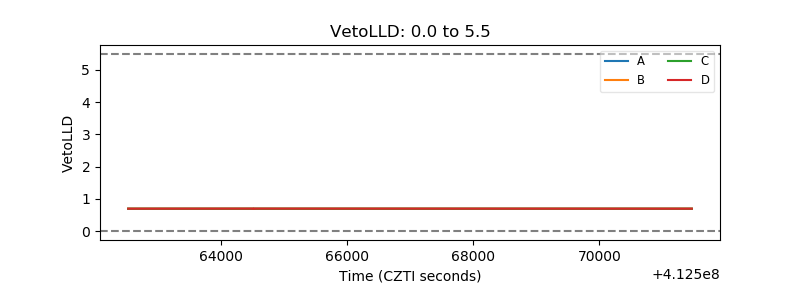 |
| Alpha Counter | 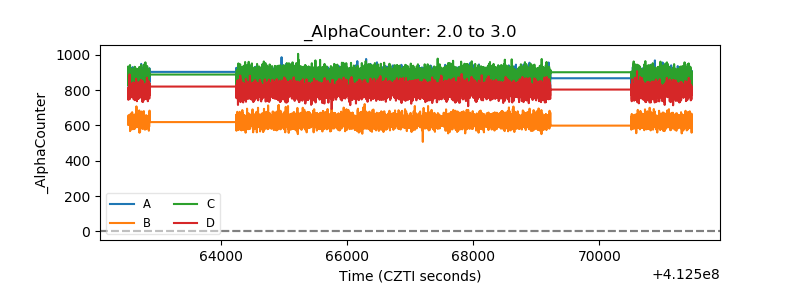 |
| _CPM_Rate | 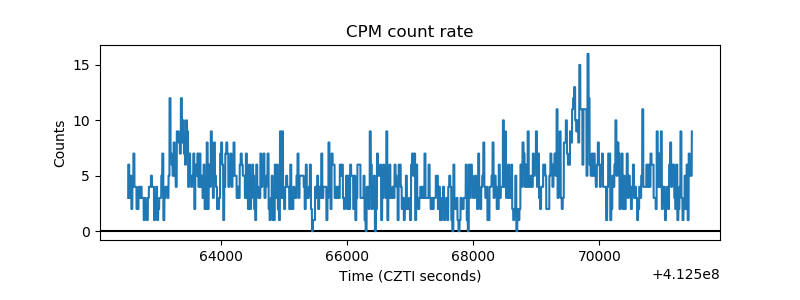 |
| CZT Counter | 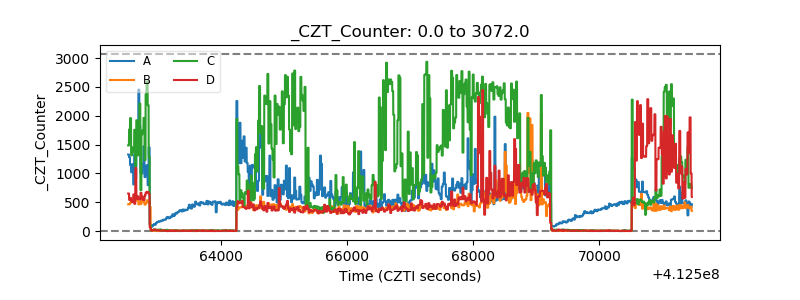 |
| +2.5 Volts monitor |  |
| +5 Volts monitor | 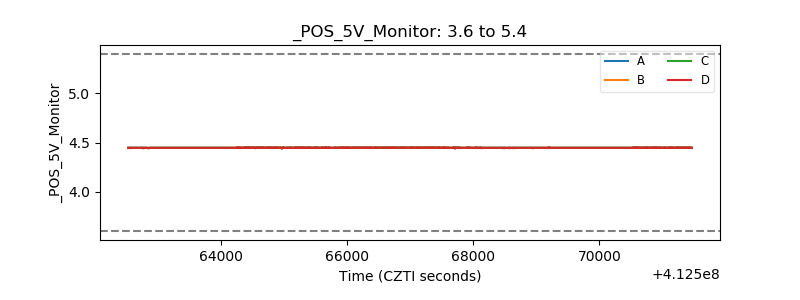 |
| _ROLL_ROT | 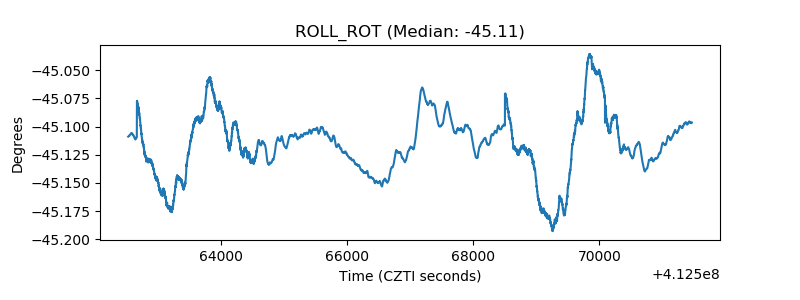 |
| _Roll_DEC | 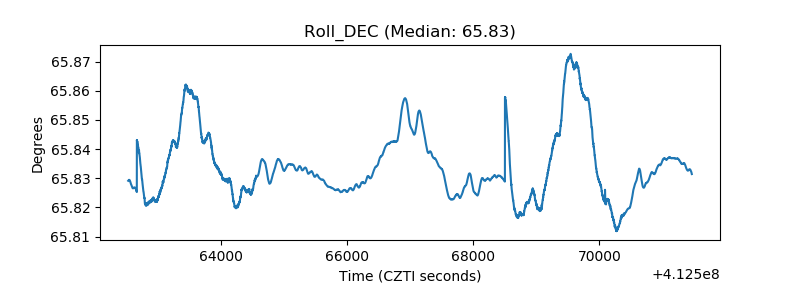 |
| _Roll_RA | 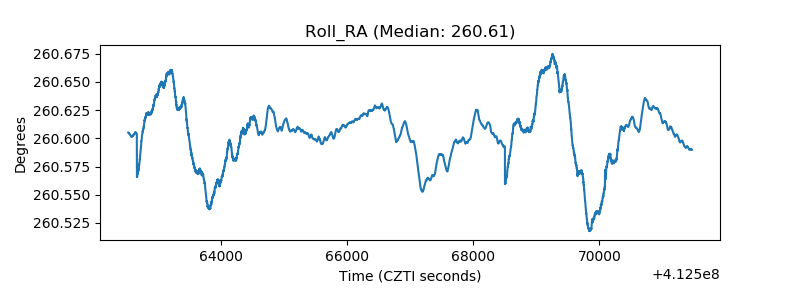 |
| Veto Counter | 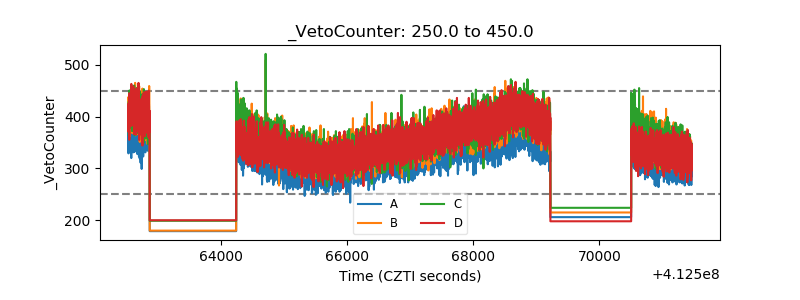 |