| Param | Original file | Final file |
|---|---|---|
| Filename | modeM0/AS1A12_018T01_9000005488_39657cztM0_level2.fits | modeM0/AS1A12_018T01_9000005488_39657cztM0_level2_quad_clean.evt |
| Size (bytes) | 960,203,520 | 141,638,400 |
| Size | 915.7 MB | 135.1 MB |
| Events in quadrant A | 7,640,701 | 990,787 |
| Events in quadrant B | 4,026,655 | 1,025,272 |
| Events in quadrant C | 13,558,819 | 770,625 |
| Events in quadrant D | 9,605,454 | 860,556 |
| Mode SS | |||
|---|---|---|---|
| Quadrant | BADHDUFLAG | Total packets | Discarded packets |
| A | 0 | 188 | 0 |
| B | 0 | 188 | 0 |
| C | 0 | 188 | 0 |
| D | 0 | 188 | 0 |
| Mode M0 | |||
|---|---|---|---|
| Quadrant | BADHDUFLAG | Total packets | Discarded packets |
| A | 0 | 29001 | 3 |
| B | 0 | 18783 | 2 |
| C | 0 | 46716 | 2 |
| D | 0 | 34996 | 2 |
| Mode M9 | |||
|---|---|---|---|
| Quadrant | BADHDUFLAG | Total packets | Discarded packets |
| A | 0 | 24 | 0 |
| B | 0 | 24 | 0 |
| C | 0 | 24 | 0 |
| D | 0 | 24 | 0 |
| Quadrant | Total seconds | Saturated seconds | Saturation percentage |
|---|---|---|---|
| A | 9236 | 157 | 1.699870% |
| B | 9236 | 19 | 0.205717% |
| C | 9236 | 2332 | 25.249026% |
| D | 9236 | 715 | 7.741447% |
Noise dominated data is calculated using 1-second bins in cleaned event files. If a bin has >2000 counts, and if more than 50% of those come from <1% of pixels, then it is considered to be noise-dominated and hence unusable.
| Quadrant | # 1 sec bins | Bins with >0 counts | Bins with >2000 counts | High rate bins dominated by noise | Noise dominated (total time) | Noise dominated (detector-on time) | Marked lightcurve |
|---|---|---|---|---|---|---|---|
| A | 10548 | 9237 | 120 | 120 | 1.14% | 1.30% | 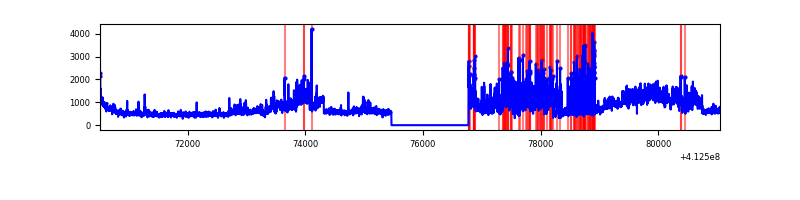 |
| B | 10548 | 9237 | 7 | 7 | 0.07% | 0.08% | 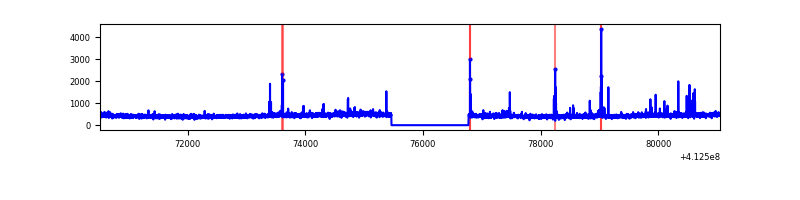 |
| C | 10548 | 9237 | 2224 | 2224 | 21.08% | 24.08% | 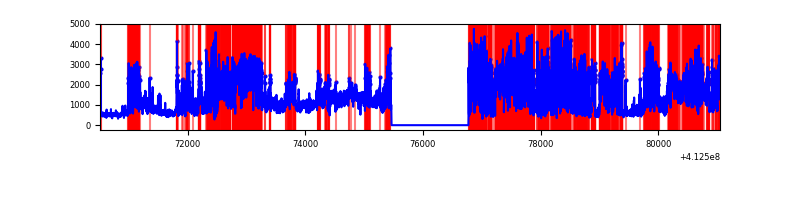 |
| D | 10548 | 9237 | 668 | 668 | 6.33% | 7.23% | 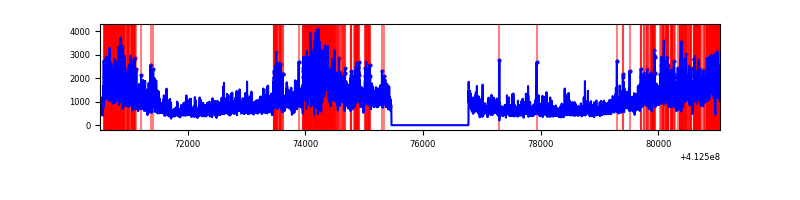 |
Top three noisy pixels from each quadrant. If the there are fewer than three noisy pixels in the level2.evt file, extra rows are filled as -1
| Pixel properties | Quadrant properties | ||||||
|---|---|---|---|---|---|---|---|
| Quadrant | DetID | PixID | Counts | Sigma | Mean | Median | Sigma |
| A | 15 | 222 | 3140710 | 15836.7 | 982 | 962 | 198.3 |
| A | 10 | 83 | 650232 | 3274.88 | 982 | 962 | 198.3 |
| A | 13 | 6 | 28668 | 139.74 | 982 | 962 | 198.3 |
| B | 5 | 172 | 101322 | 531.93 | 981 | 951 | 188.7 |
| B | 12 | 111 | 23981 | 122.05 | 981 | 951 | 188.7 |
| B | 11 | 111 | 22016 | 111.64 | 981 | 951 | 188.7 |
| C | 15 | 208 | 6446828 | 31094.27 | 888 | 892 | 207.3 |
| C | 9 | 187 | 2648798 | 12773.12 | 888 | 892 | 207.3 |
| C | 14 | 254 | 449767 | 2165.31 | 888 | 892 | 207.3 |
| D | 12 | 227 | 5233142 | 22614.16 | 945 | 917 | 231.4 |
| D | 1 | 52 | 238376 | 1026.32 | 945 | 917 | 231.4 |
| D | 13 | 174 | 176019 | 756.81 | 945 | 917 | 231.4 |
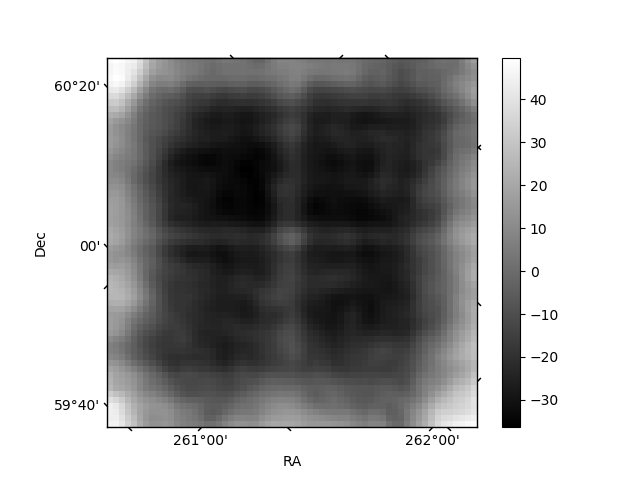
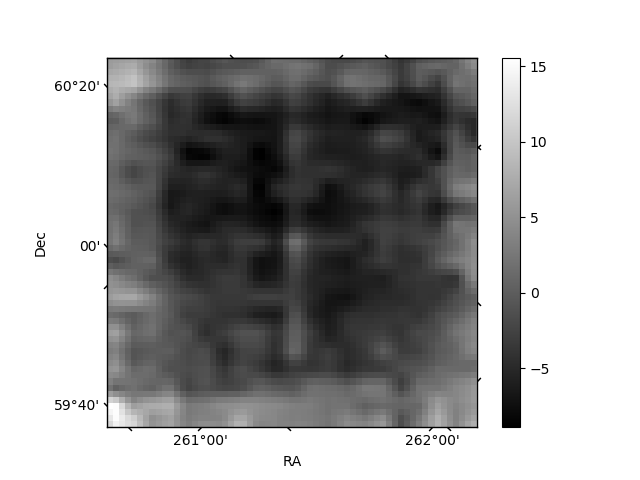
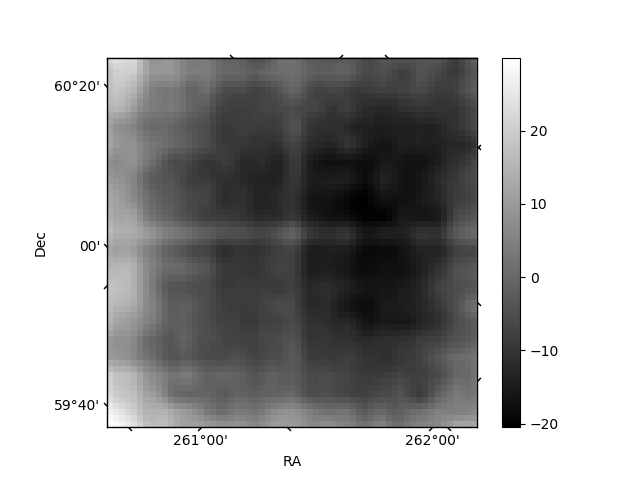
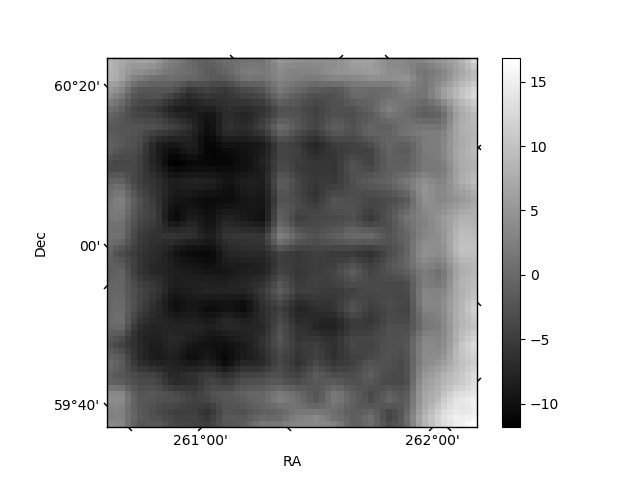
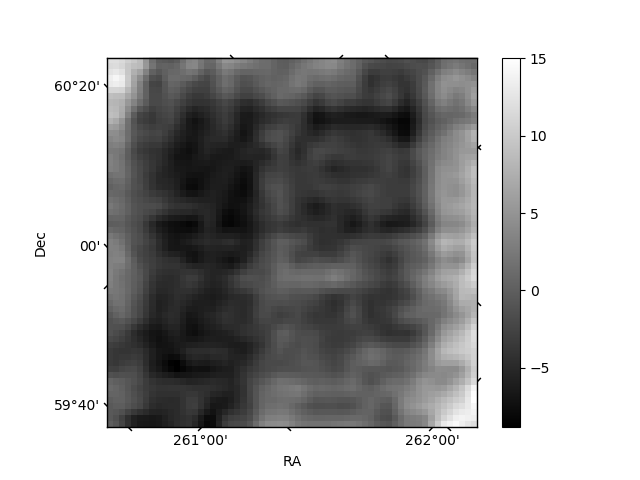
Histogram calculated using DETX and DETY for each event in the final _common_clean file
| Quadrant A | 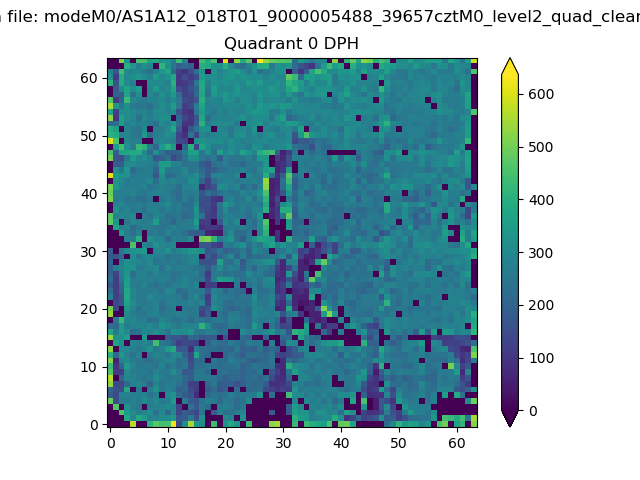 |
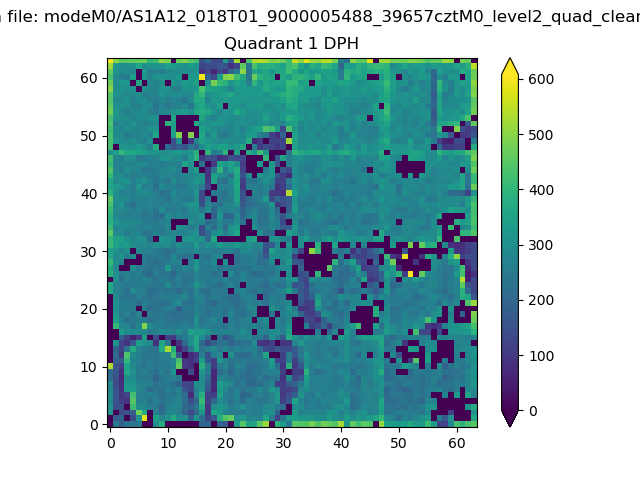 |
Quadrant B |
|---|---|---|---|
| Quadrant D | 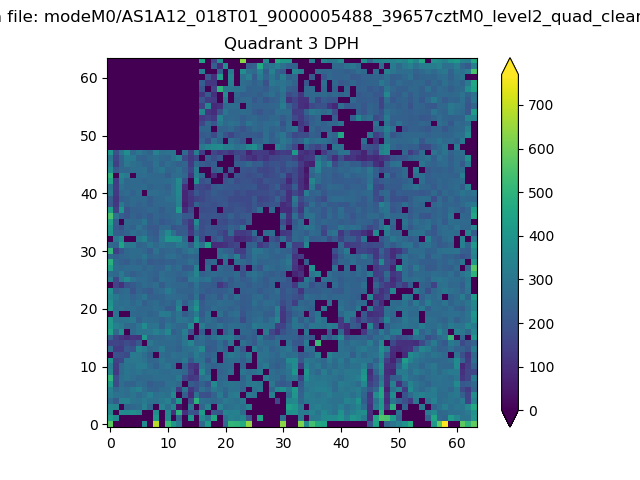 |
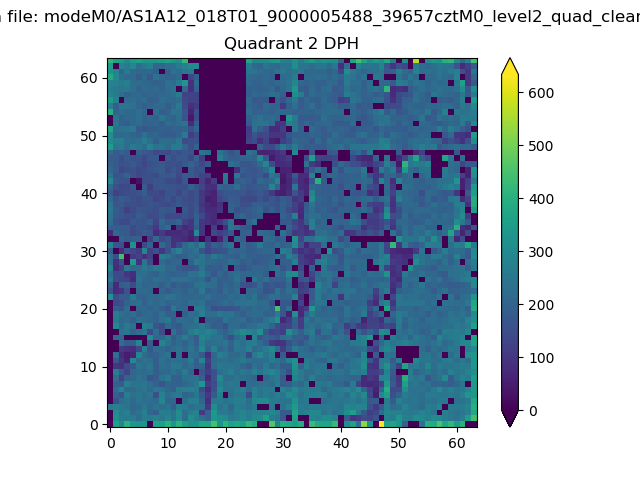 |
Quadrant C |
| Plot type | Count rate plots | Images |
|---|---|---|
| Comparison with Poisson distribution Blue bars denote a histogram of data divided into 1 sec bins. Red curve is a Poisson curve with rate = median count rate of data. |
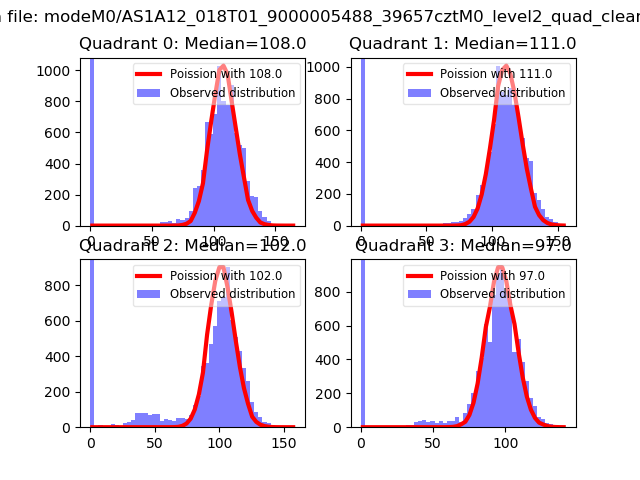 |
 |
| Quadrant-wise count rates Data is divided into 100 sec bins |
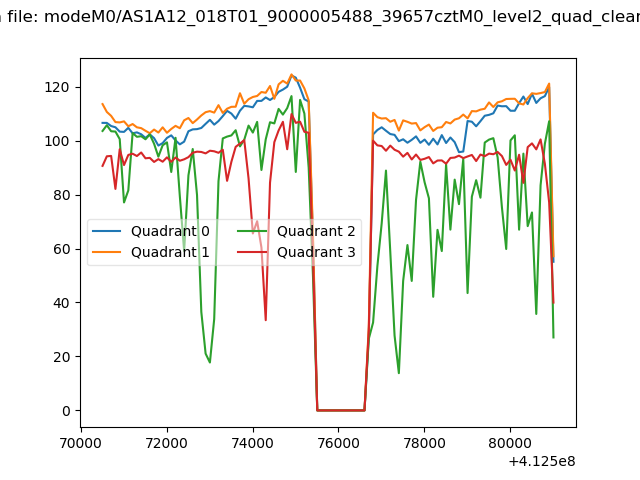 |
|
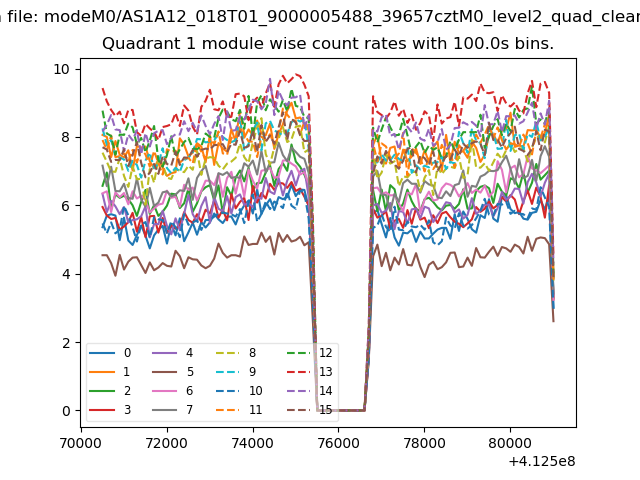
| Module-wise count rates for Quadrant A Data is divided into 100 sec bins |
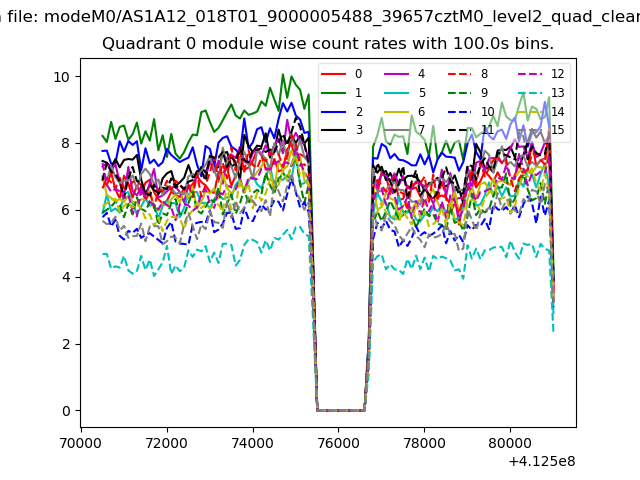 |
 |
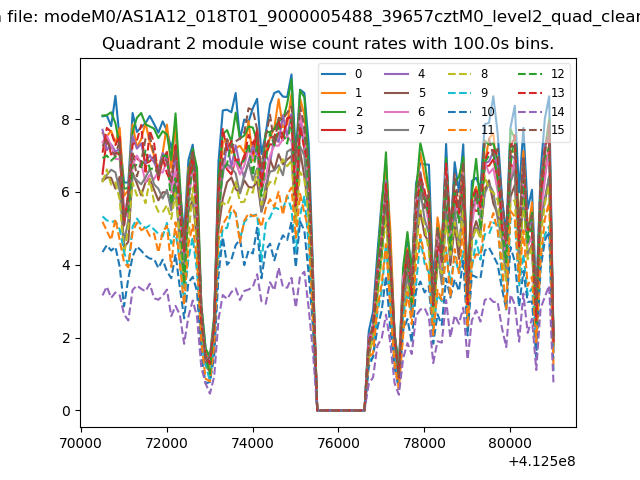
| Module-wise count rates for Quadrant B Data is divided into 100 sec bins |
 |
 |
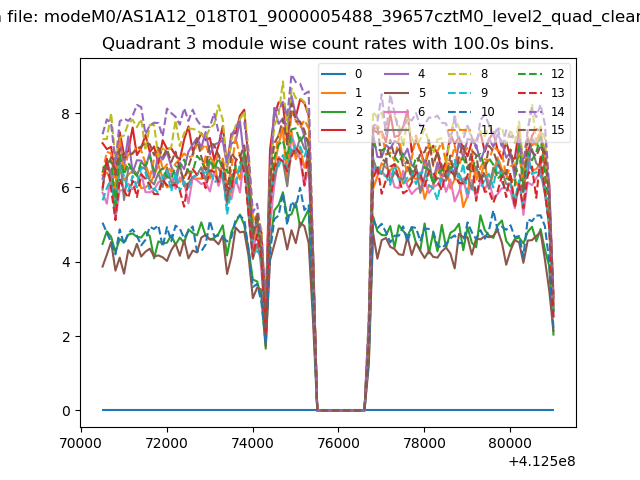
| Module-wise count rates for Quadrant C Data is divided into 100 sec bins |
 |
 |
| Module-wise count rates for Quadrant D Data is divided into 100 sec bins |
 |
 |
| Parameter | Plot |
|---|---|
| CZT HV Monitor | 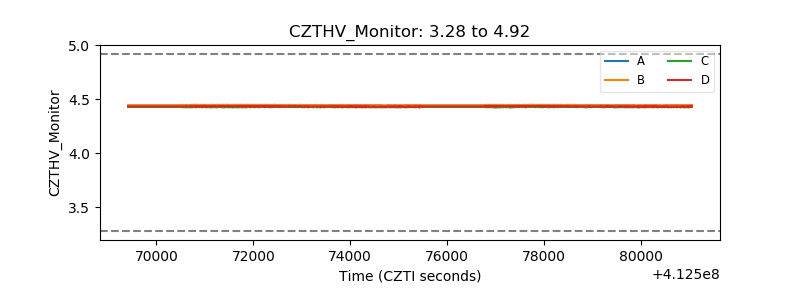 |
| D_VDD | 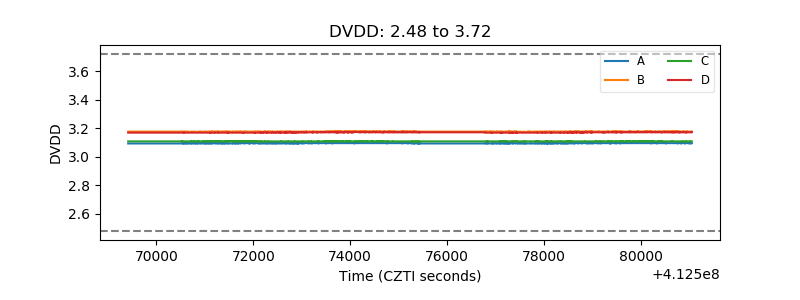 |
| Temperature 1 | 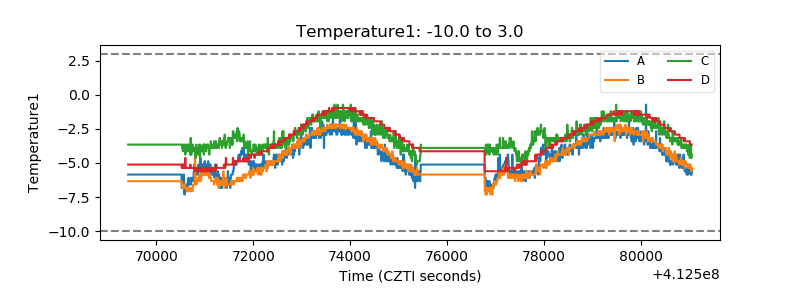 |
| Veto HV Monitor | 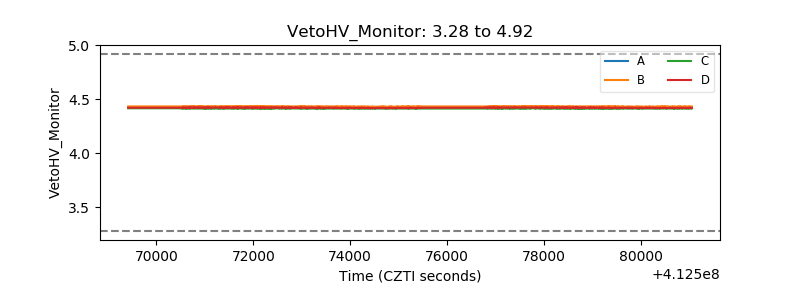 |
| Veto LLD | 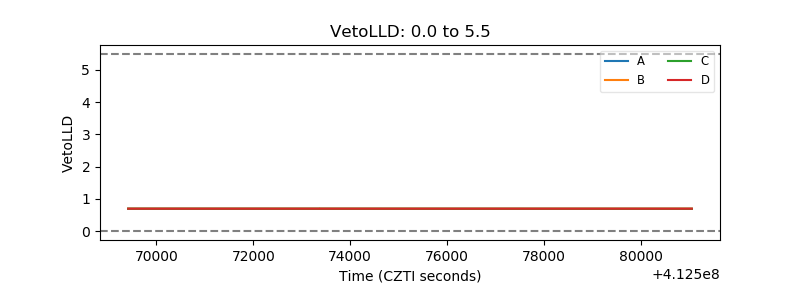 |
| Alpha Counter | 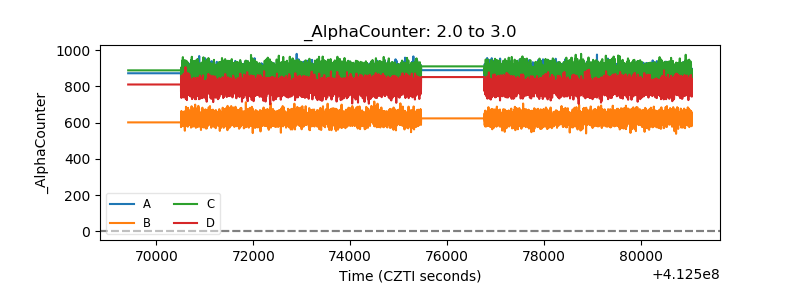 |
| _CPM_Rate | 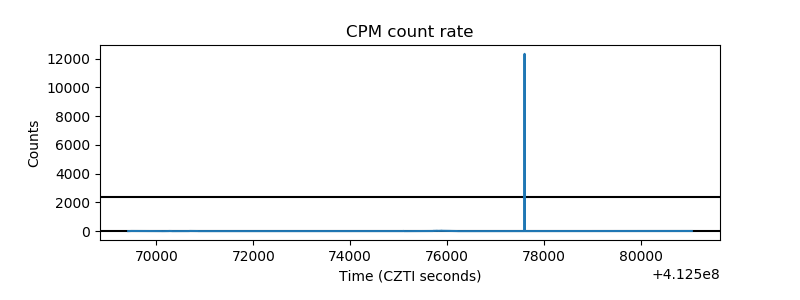 |
| CZT Counter | 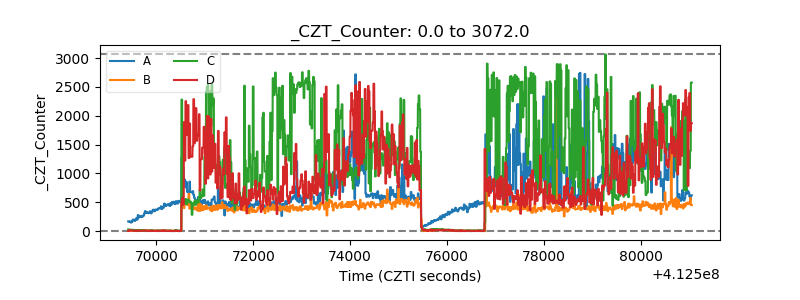 |
| +2.5 Volts monitor | 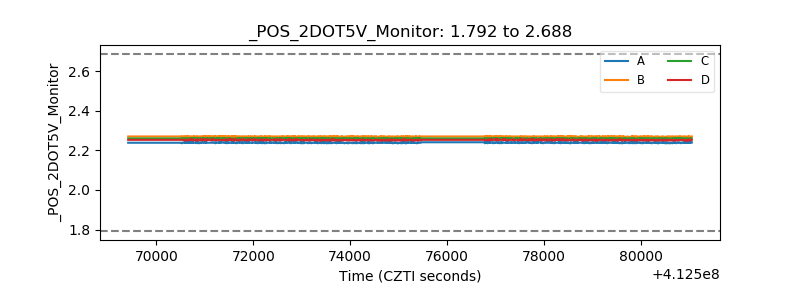 |
| +5 Volts monitor | 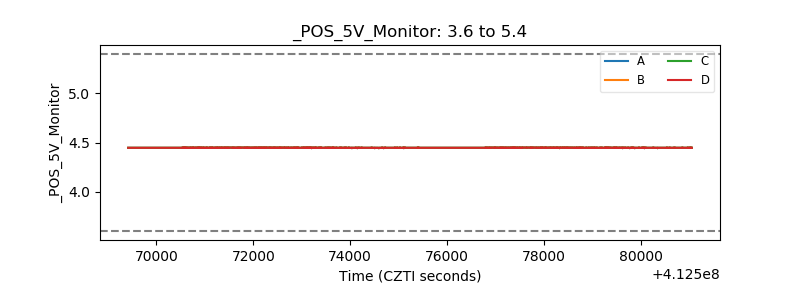 |
| _ROLL_ROT | 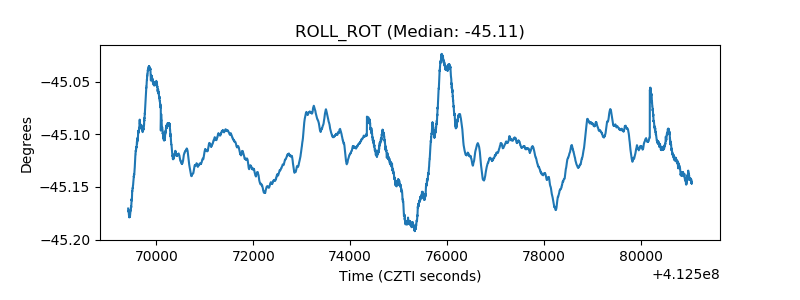 |
| _Roll_DEC | 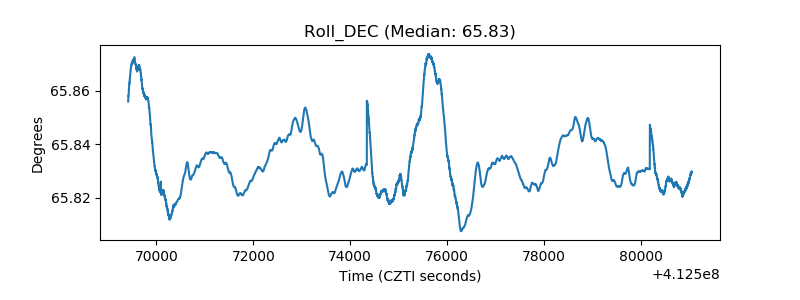 |
| _Roll_RA | 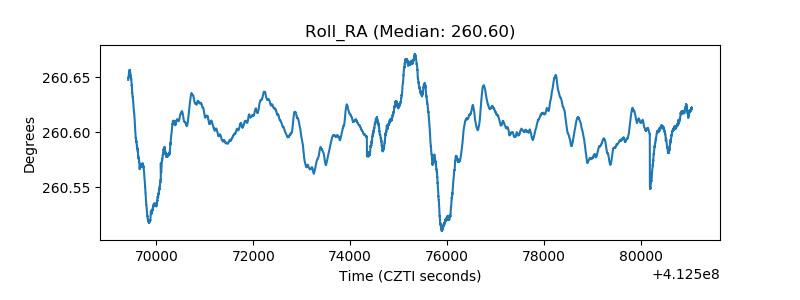 |
| Veto Counter | 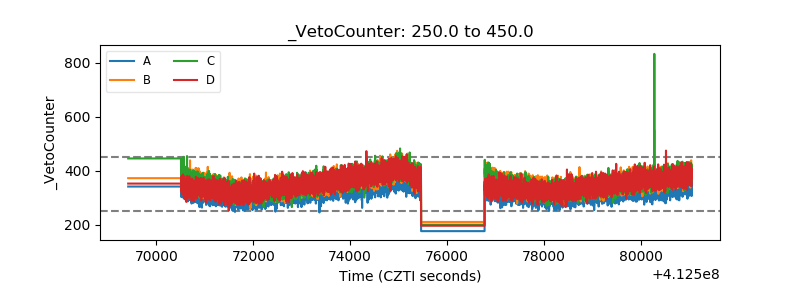 |