| Param | Original file | Final file |
|---|---|---|
| Filename | modeM0/AS1A12_051T01_9000005490_39659cztM0_level2.fits | modeM0/AS1A12_051T01_9000005490_39659cztM0_level2_quad_clean.evt |
| Size (bytes) | 518,045,760 | 88,185,600 |
| Size | 494.0 MB | 84.1 MB |
| Events in quadrant A | 7,127,373 | 511,283 |
| Events in quadrant B | 2,697,645 | 633,235 |
| Events in quadrant C | 5,675,439 | 572,198 |
| Events in quadrant D | 3,245,525 | 565,387 |
| Mode M9 | |||
|---|---|---|---|
| Quadrant | BADHDUFLAG | Total packets | Discarded packets |
| A | 0 | 18 | 0 |
| B | 0 | 18 | 0 |
| C | 0 | 18 | 0 |
| D | 0 | 19 | 0 |
| Mode M0 | |||
|---|---|---|---|
| Quadrant | BADHDUFLAG | Total packets | Discarded packets |
| A | 0 | 24974 | 3 |
| B | 0 | 11748 | 2 |
| C | 0 | 20660 | 2 |
| D | 0 | 13335 | 2 |
| Mode SS | |||
|---|---|---|---|
| Quadrant | BADHDUFLAG | Total packets | Discarded packets |
| A | 0 | 112 | 0 |
| B | 0 | 112 | 0 |
| C | 0 | 112 | 0 |
| D | 0 | 112 | 0 |
| Quadrant | Total seconds | Saturated seconds | Saturation percentage |
|---|---|---|---|
| A | 5549 | 1159 | 20.886646% |
| B | 5549 | 49 | 0.883042% |
| C | 5549 | 560 | 10.091908% |
| D | 5549 | 114 | 2.054424% |
Noise dominated data is calculated using 1-second bins in cleaned event files. If a bin has >2000 counts, and if more than 50% of those come from <1% of pixels, then it is considered to be noise-dominated and hence unusable.
| Quadrant | # 1 sec bins | Bins with >0 counts | Bins with >2000 counts | High rate bins dominated by noise | Noise dominated (total time) | Noise dominated (detector-on time) | Marked lightcurve |
|---|---|---|---|---|---|---|---|
| A | 7222 | 5550 | 1272 | 1272 | 17.61% | 22.92% | 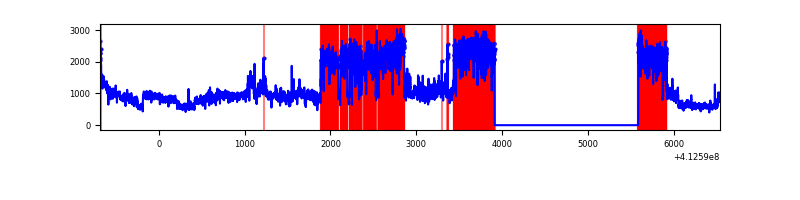 |
| B | 7222 | 5550 | 31 | 31 | 0.43% | 0.56% | 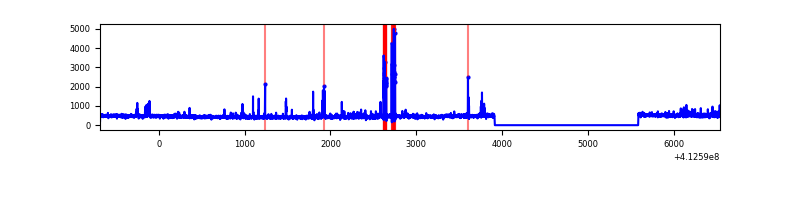 |
| C | 7222 | 5550 | 526 | 526 | 7.28% | 9.48% | 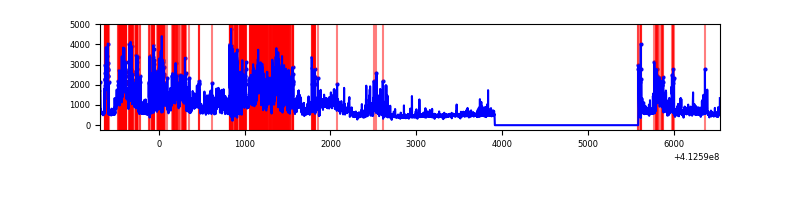 |
| D | 7222 | 5550 | 88 | 88 | 1.22% | 1.59% | 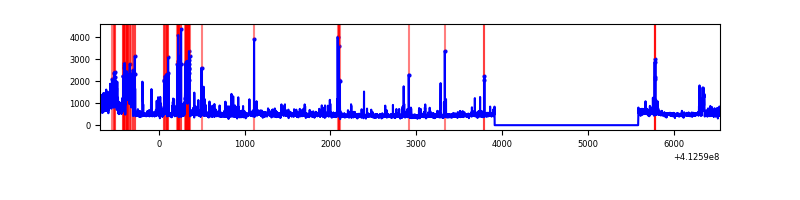 |
Top three noisy pixels from each quadrant. If the there are fewer than three noisy pixels in the level2.evt file, extra rows are filled as -1
| Pixel properties | Quadrant properties | ||||||
|---|---|---|---|---|---|---|---|
| Quadrant | DetID | PixID | Counts | Sigma | Mean | Median | Sigma |
| A | 15 | 222 | 4308452 | 35077.22 | 595 | 583 | 122.8 |
| A | 10 | 83 | 433782 | 3527.36 | 595 | 583 | 122.8 |
| A | 14 | 254 | 44175 | 354.95 | 595 | 583 | 122.8 |
| B | 5 | 172 | 223580 | 1865.41 | 615 | 598 | 119.5 |
| B | 5 | 255 | 23820 | 194.27 | 615 | 598 | 119.5 |
| B | 12 | 111 | 15112 | 121.42 | 615 | 598 | 119.5 |
| C | 9 | 187 | 1994216 | 14584.31 | 583 | 586 | 136.7 |
| C | 15 | 208 | 1125287 | 8227.7 | 583 | 586 | 136.7 |
| C | 15 | 214 | 225849 | 1647.9 | 583 | 586 | 136.7 |
| D | 12 | 227 | 593516 | 3990.91 | 605 | 587 | 148.6 |
| D | 1 | 52 | 123138 | 824.87 | 605 | 587 | 148.6 |
| D | 12 | 233 | 45111 | 299.68 | 605 | 587 | 148.6 |
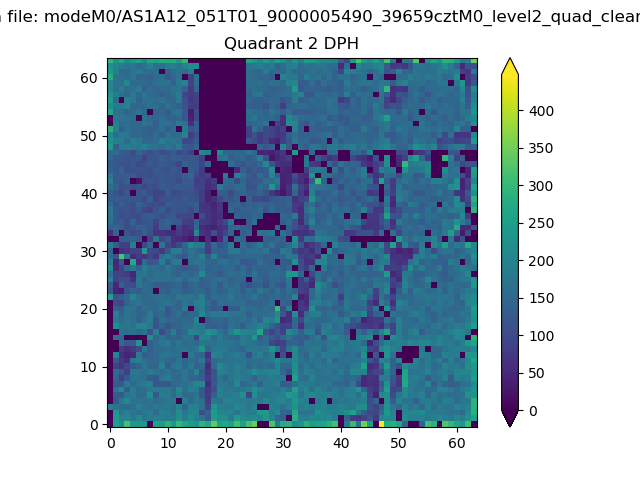
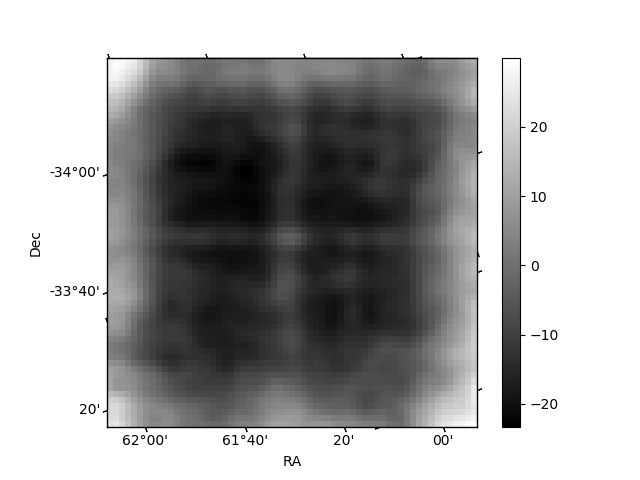
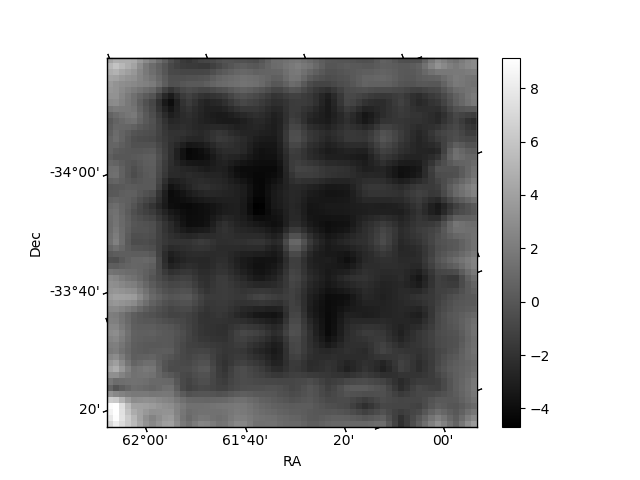
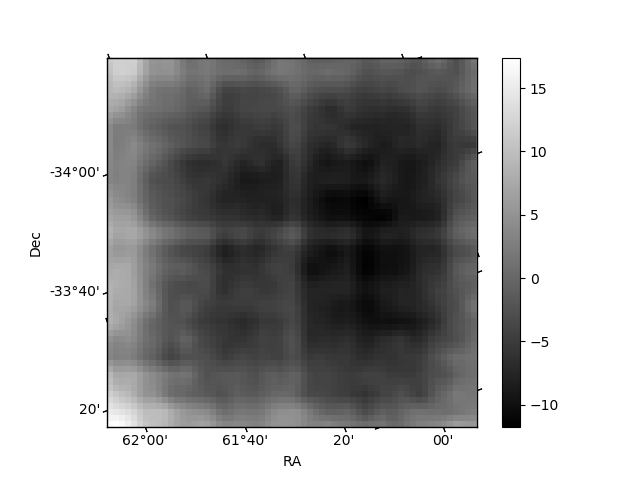
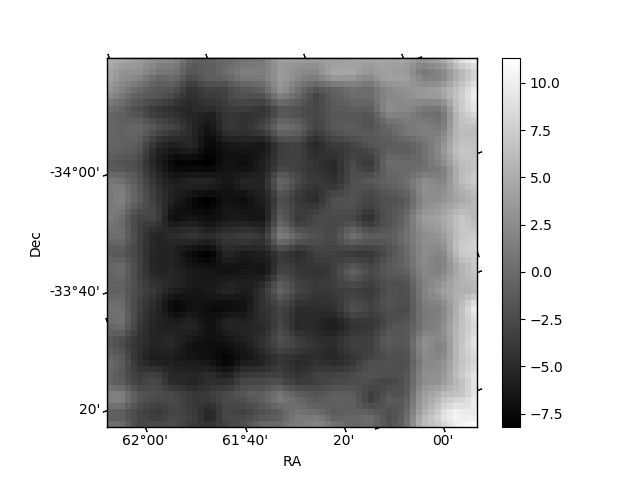
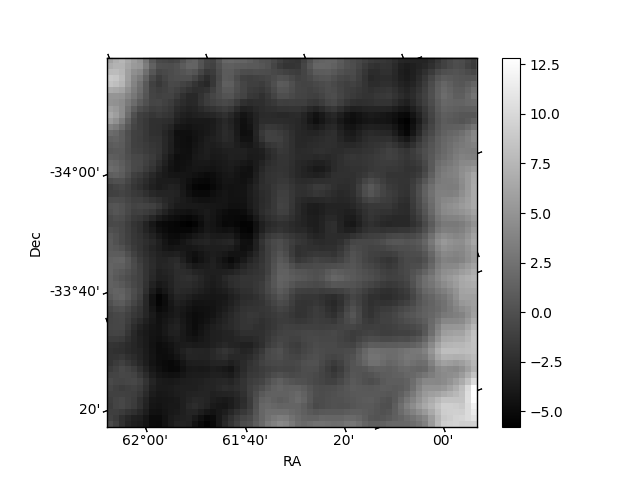
Histogram calculated using DETX and DETY for each event in the final _common_clean file
| Quadrant A | 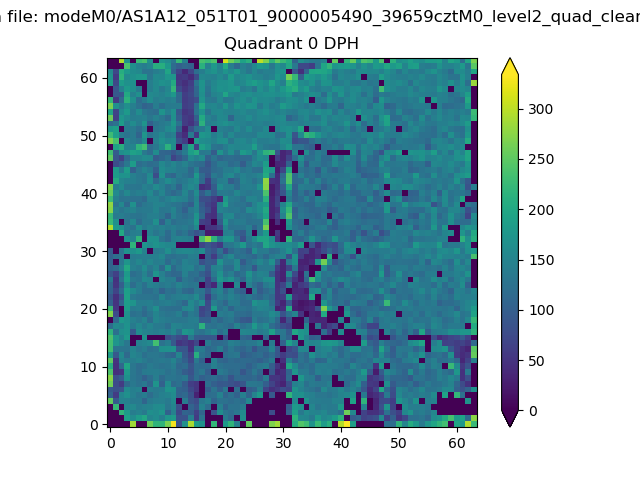 |
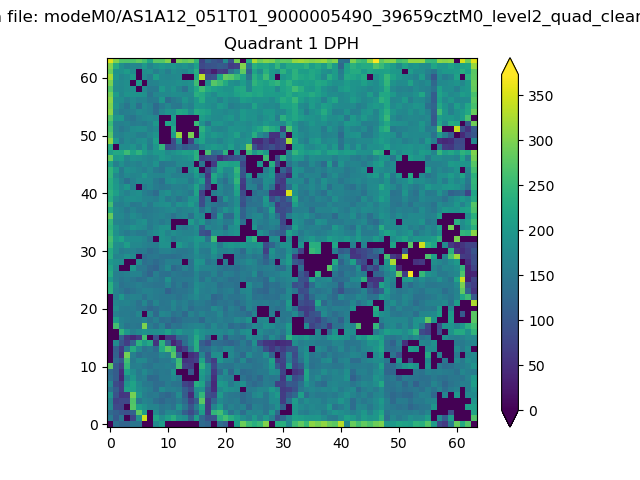 |
Quadrant B |
|---|---|---|---|
| Quadrant D | 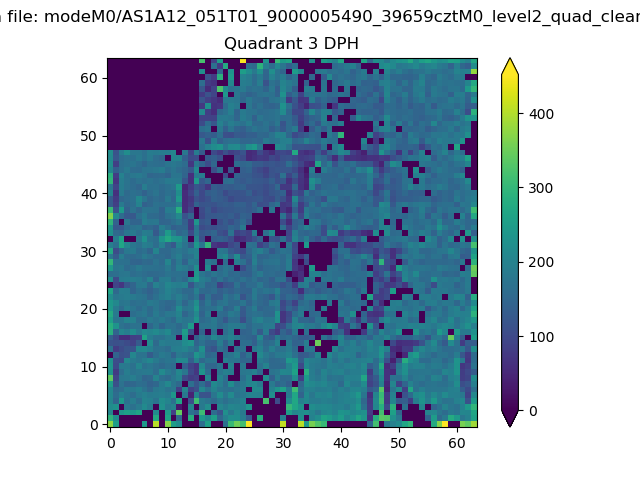 |
 |
Quadrant C |
| Plot type | Count rate plots | Images |
|---|---|---|
| Comparison with Poisson distribution Blue bars denote a histogram of data divided into 1 sec bins. Red curve is a Poisson curve with rate = median count rate of data. |
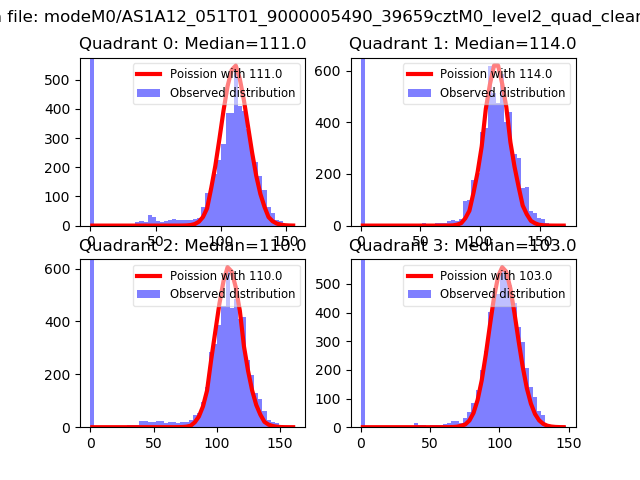 |
 |
| Quadrant-wise count rates Data is divided into 100 sec bins |
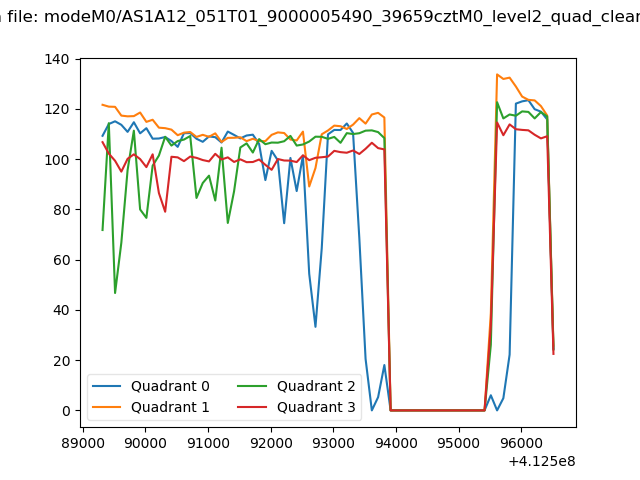 |
|
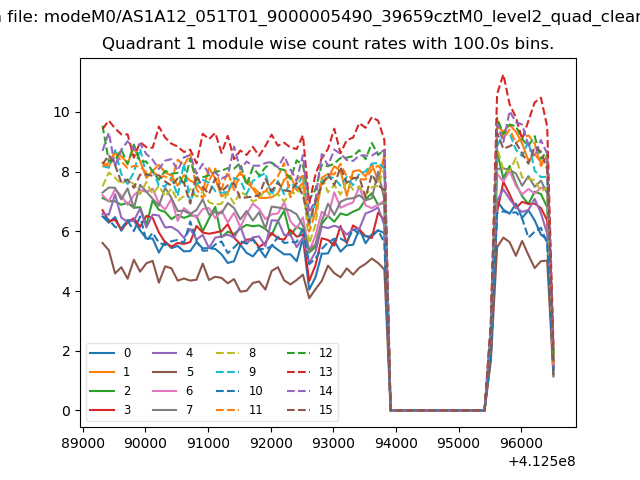
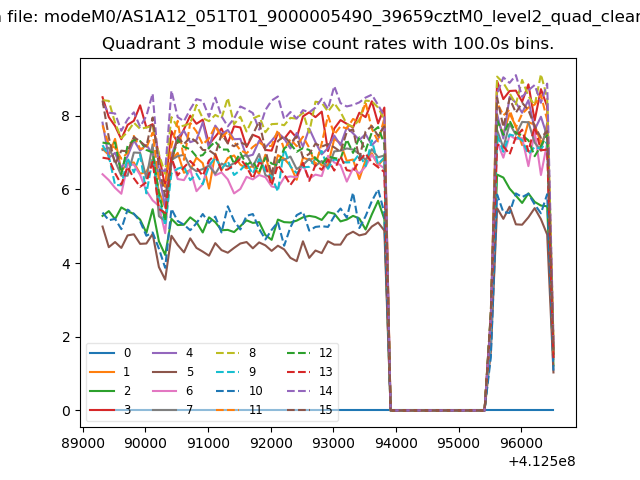
| Module-wise count rates for Quadrant A Data is divided into 100 sec bins |
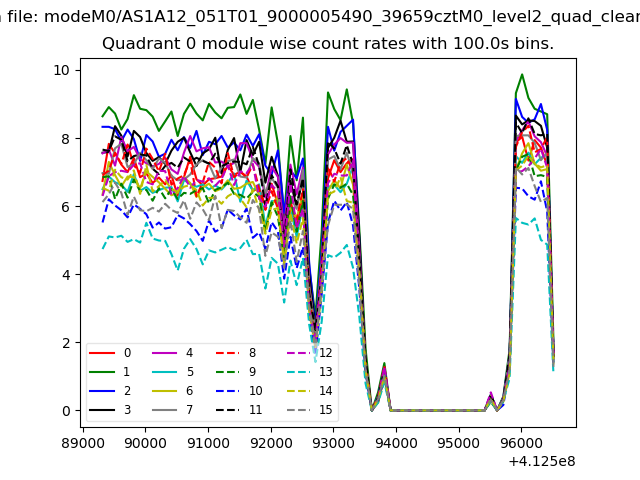 |
 |
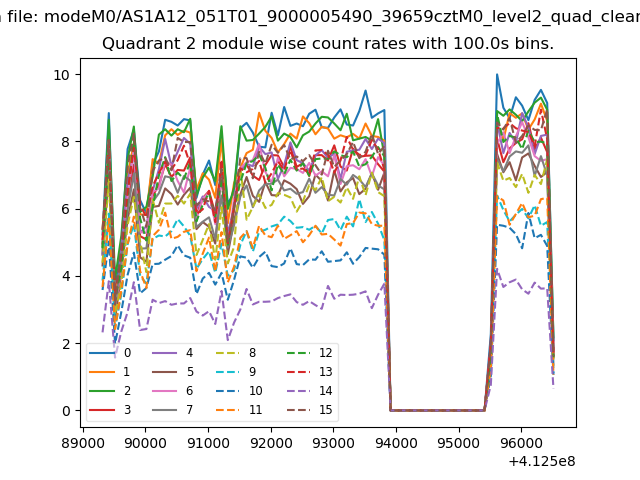
| Module-wise count rates for Quadrant B Data is divided into 100 sec bins |
 |
 |
| Module-wise count rates for Quadrant C Data is divided into 100 sec bins |
 |
 |
| Module-wise count rates for Quadrant D Data is divided into 100 sec bins |
 |
 |
| Parameter | Plot |
|---|---|
| CZT HV Monitor | 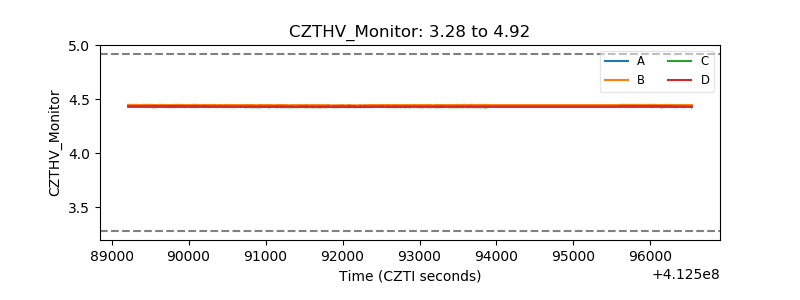 |
| D_VDD | 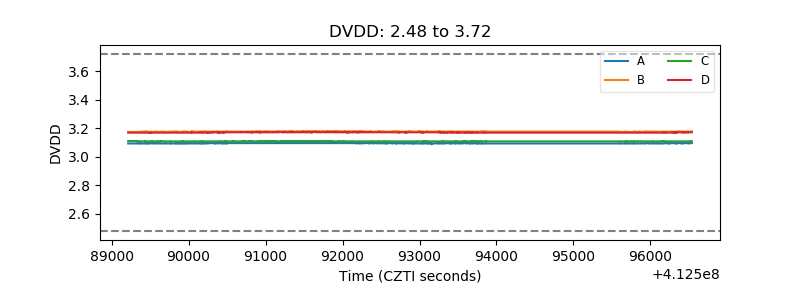 |
| Temperature 1 | 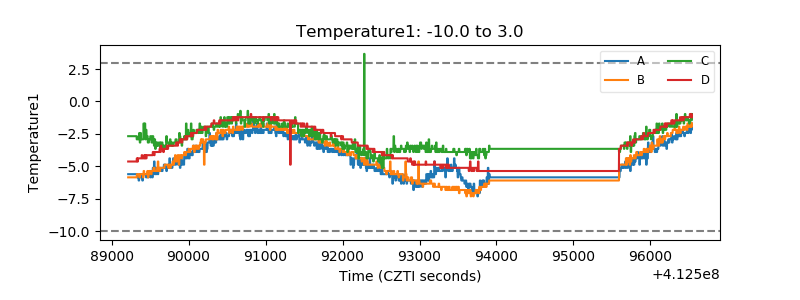 |
| Veto HV Monitor | 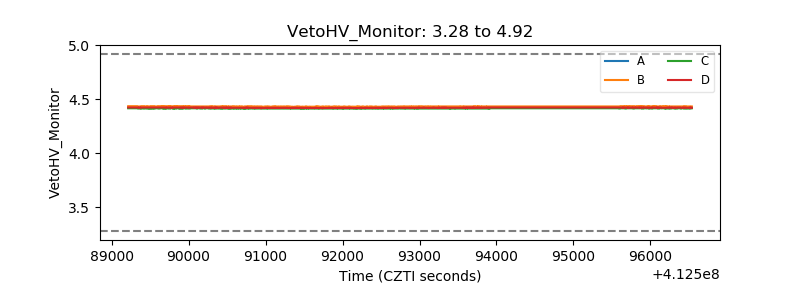 |
| Veto LLD | 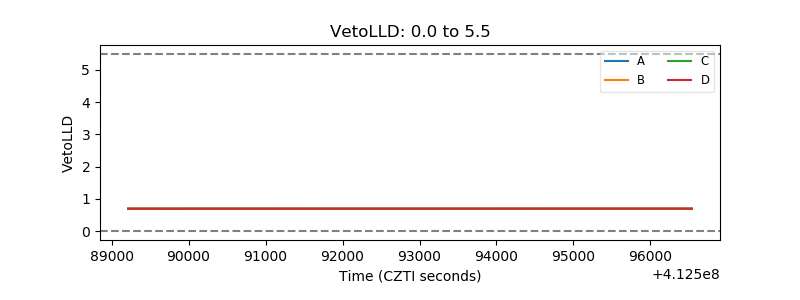 |
| Alpha Counter | 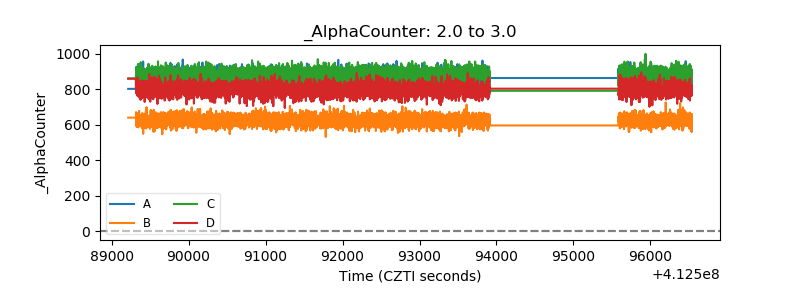 |
| _CPM_Rate | 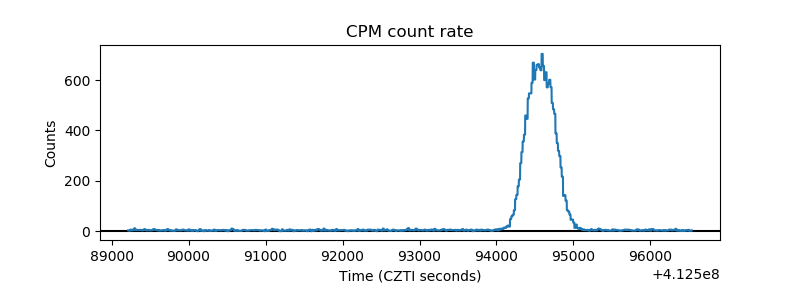 |
| CZT Counter | 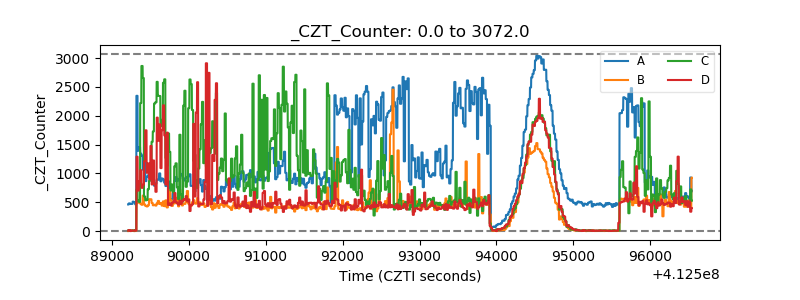 |
| +2.5 Volts monitor | 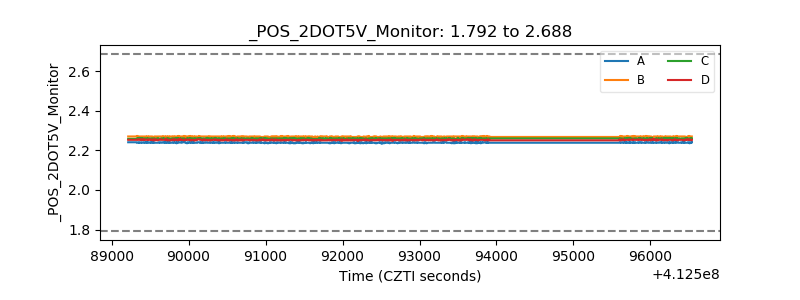 |
| +5 Volts monitor | 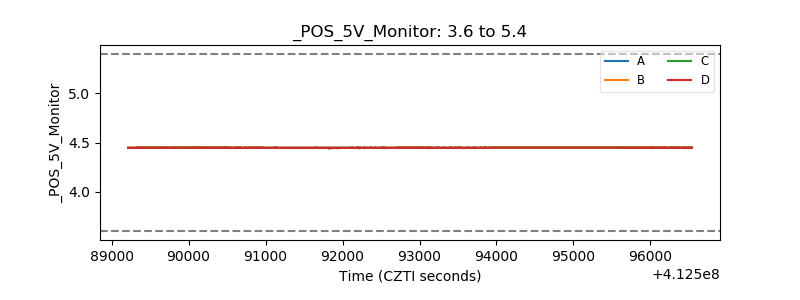 |
| _ROLL_ROT | 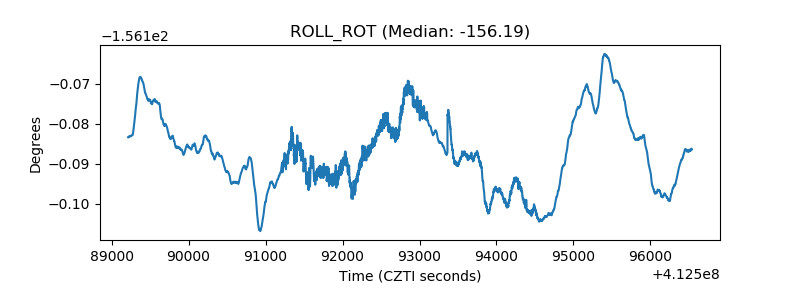 |
| _Roll_DEC | 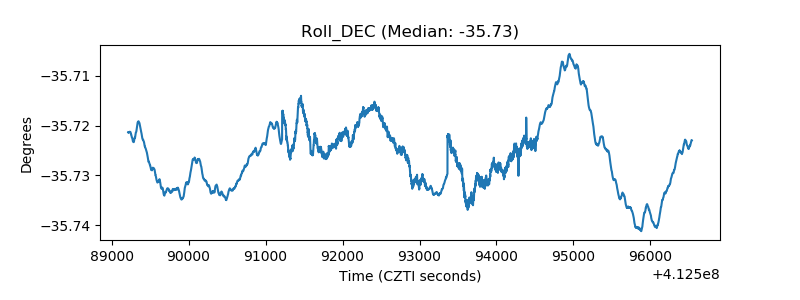 |
| _Roll_RA | 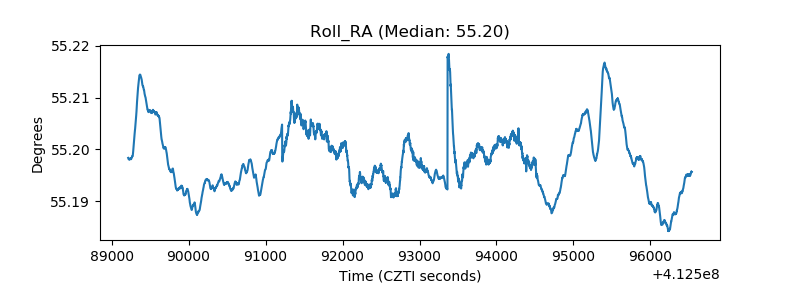 |
| Veto Counter | 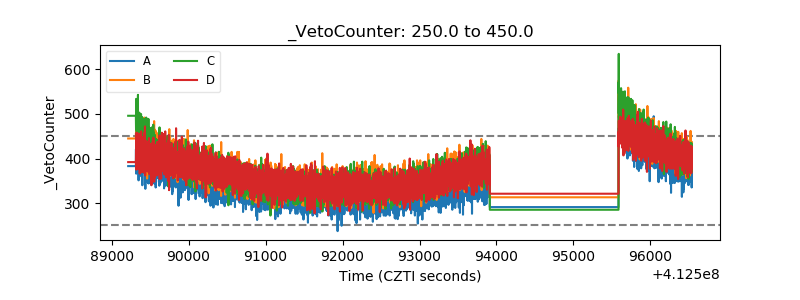 |