| Param | Original file | Final file |
|---|---|---|
| Filename | modeM0/AS1A12_051T01_9000005490_39661cztM0_level2.fits | modeM0/AS1A12_051T01_9000005490_39661cztM0_level2_quad_clean.evt |
| Size (bytes) | 388,025,280 | 89,000,640 |
| Size | 370.0 MB | 84.9 MB |
| Events in quadrant A | 4,467,454 | 595,980 |
| Events in quadrant B | 2,820,251 | 612,671 |
| Events in quadrant C | 3,634,635 | 580,669 |
| Events in quadrant D | 3,041,285 | 544,861 |
| Mode M9 | |||
|---|---|---|---|
| Quadrant | BADHDUFLAG | Total packets | Discarded packets |
| A | 0 | 18 | 0 |
| B | 0 | 18 | 0 |
| C | 0 | 18 | 0 |
| D | 0 | 18 | 0 |
| Mode M0 | |||
|---|---|---|---|
| Quadrant | BADHDUFLAG | Total packets | Discarded packets |
| A | 0 | 16964 | 2 |
| B | 0 | 11831 | 1 |
| C | 0 | 14226 | 1 |
| D | 0 | 12504 | 1 |
| Mode SS | |||
|---|---|---|---|
| Quadrant | BADHDUFLAG | Total packets | Discarded packets |
| A | 0 | 106 | 0 |
| B | 0 | 106 | 0 |
| C | 0 | 106 | 0 |
| D | 0 | 106 | 0 |
| Quadrant | Total seconds | Saturated seconds | Saturation percentage |
|---|---|---|---|
| A | 5145 | 148 | 2.876579% |
| B | 5145 | 92 | 1.788144% |
| C | 5145 | 173 | 3.362488% |
| D | 5145 | 101 | 1.963071% |
Noise dominated data is calculated using 1-second bins in cleaned event files. If a bin has >2000 counts, and if more than 50% of those come from <1% of pixels, then it is considered to be noise-dominated and hence unusable.
| Quadrant | # 1 sec bins | Bins with >0 counts | Bins with >2000 counts | High rate bins dominated by noise | Noise dominated (total time) | Noise dominated (detector-on time) | Marked lightcurve |
|---|---|---|---|---|---|---|---|
| A | 6938 | 5146 | 97 | 97 | 1.40% | 1.88% | 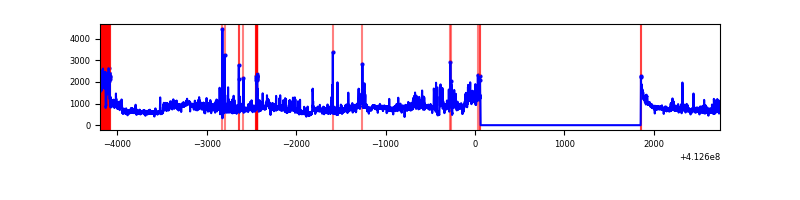 |
| B | 6938 | 5146 | 59 | 59 | 0.85% | 1.15% | 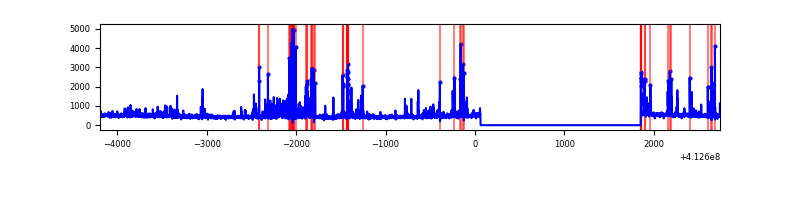 |
| C | 6938 | 5146 | 152 | 152 | 2.19% | 2.95% | 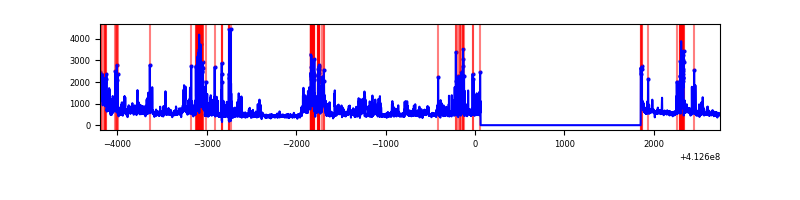 |
| D | 6938 | 5146 | 91 | 91 | 1.31% | 1.77% | 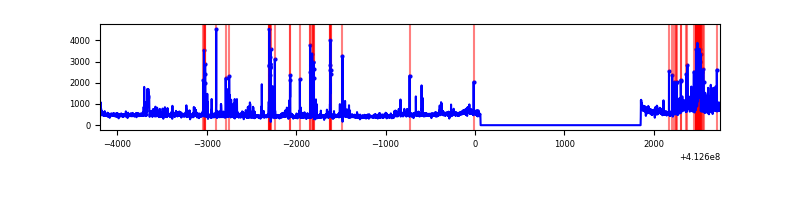 |
Top three noisy pixels from each quadrant. If the there are fewer than three noisy pixels in the level2.evt file, extra rows are filled as -1
| Pixel properties | Quadrant properties | ||||||
|---|---|---|---|---|---|---|---|
| Quadrant | DetID | PixID | Counts | Sigma | Mean | Median | Sigma |
| A | 15 | 222 | 1670551 | 13997.35 | 583 | 573 | 119.3 |
| A | 10 | 83 | 380573 | 3185.07 | 583 | 573 | 119.3 |
| A | 15 | 174 | 78056 | 649.44 | 583 | 573 | 119.3 |
| B | 5 | 172 | 481370 | 4331.46 | 575 | 560 | 111.0 |
| B | 15 | 32 | 40950 | 363.86 | 575 | 560 | 111.0 |
| B | 15 | 85 | 14363 | 124.35 | 575 | 560 | 111.0 |
| C | 15 | 208 | 806757 | 6162.58 | 559 | 563 | 130.8 |
| C | 9 | 187 | 401704 | 3066.34 | 559 | 563 | 130.8 |
| C | 15 | 214 | 209932 | 1600.43 | 559 | 563 | 130.8 |
| D | 13 | 174 | 267792 | 1923.82 | 565 | 549 | 138.9 |
| D | 13 | 249 | 161805 | 1160.85 | 565 | 549 | 138.9 |
| D | 12 | 227 | 157377 | 1128.97 | 565 | 549 | 138.9 |
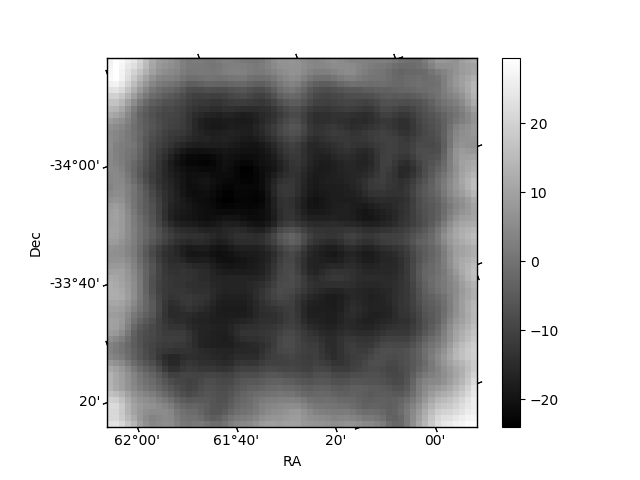
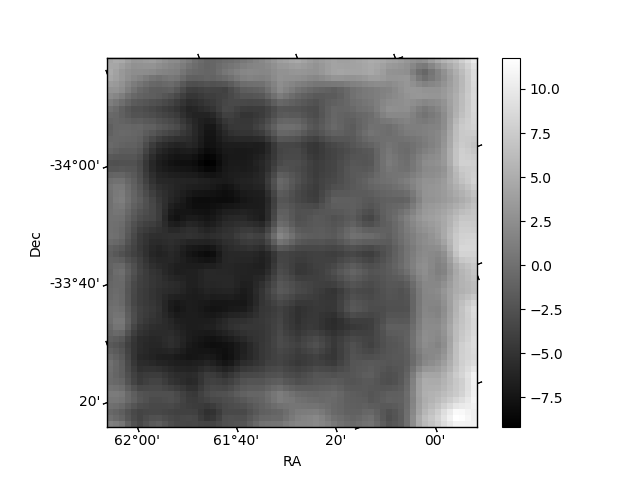
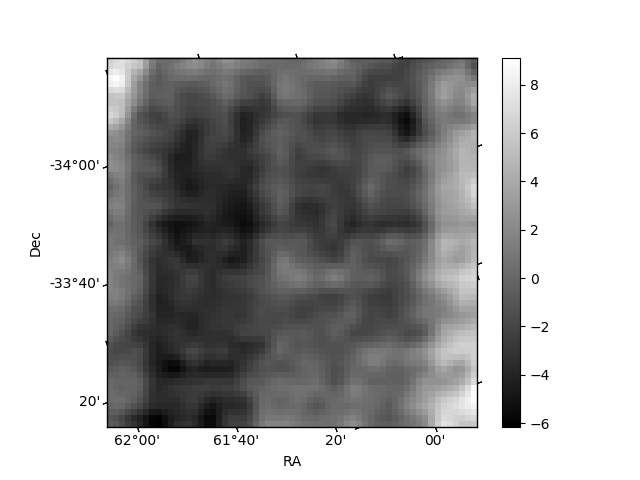
Histogram calculated using DETX and DETY for each event in the final _common_clean file
| Quadrant A | 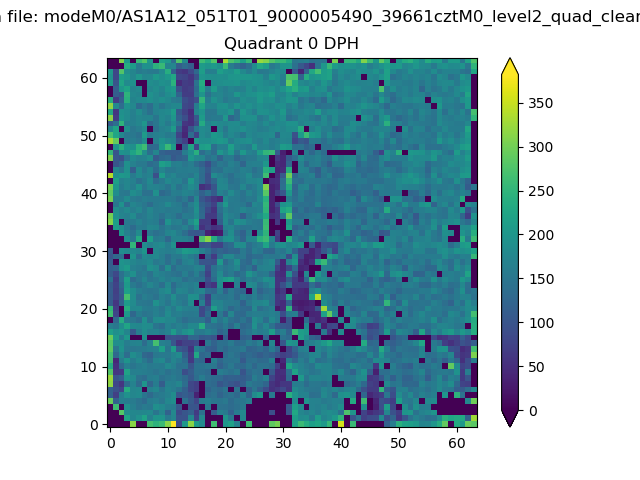 |
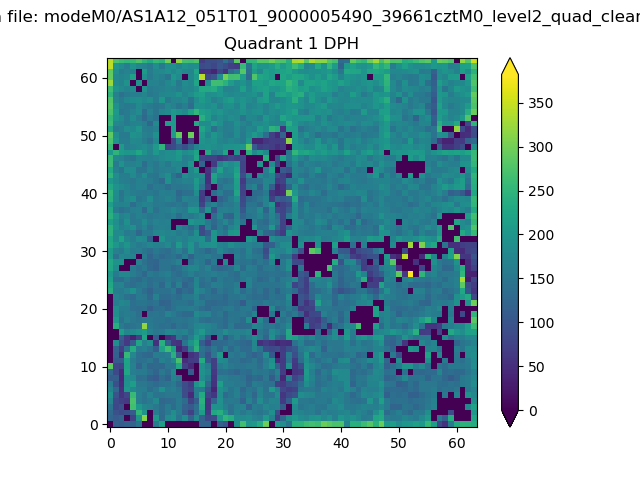 |
Quadrant B |
|---|---|---|---|
| Quadrant D | 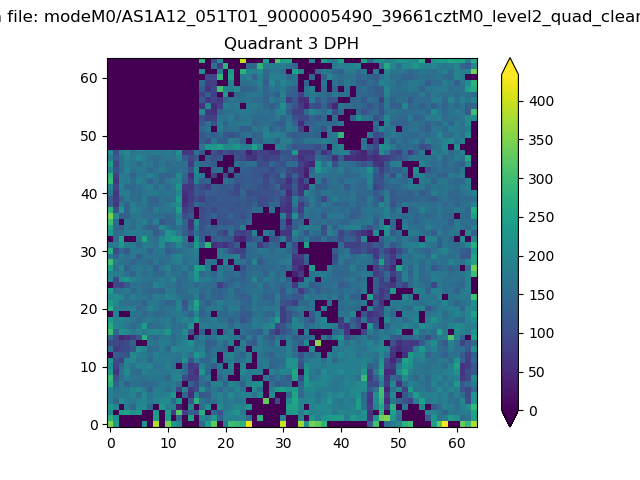 |
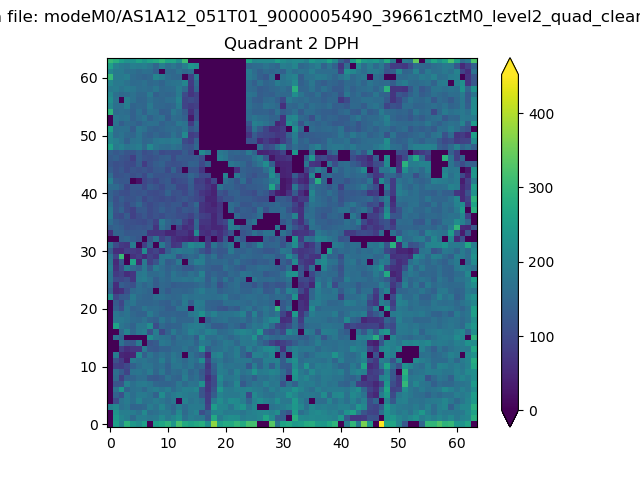 |
Quadrant C |
| Plot type | Count rate plots | Images |
|---|---|---|
| Comparison with Poisson distribution Blue bars denote a histogram of data divided into 1 sec bins. Red curve is a Poisson curve with rate = median count rate of data. |
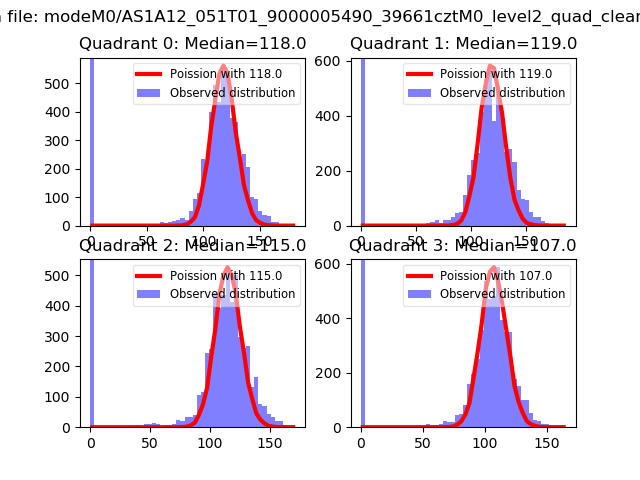 |
 |
| Quadrant-wise count rates Data is divided into 100 sec bins |
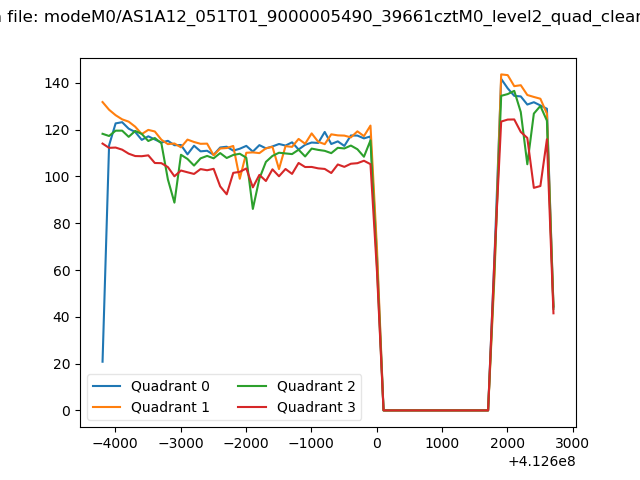 |
|
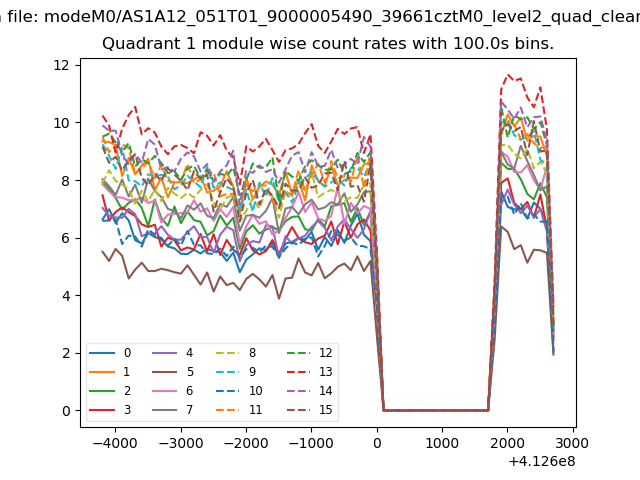
| Module-wise count rates for Quadrant A Data is divided into 100 sec bins |
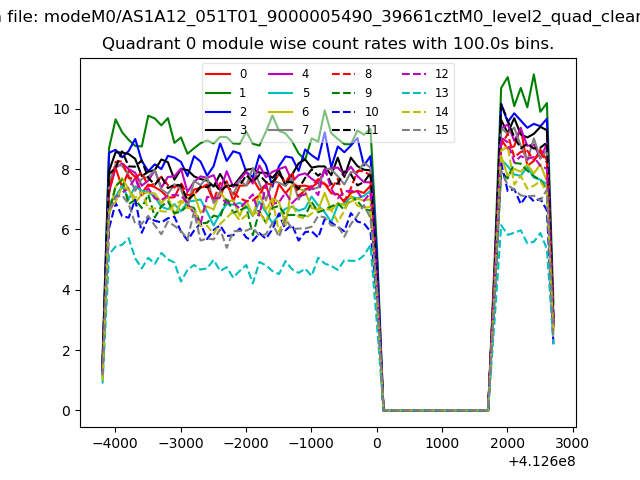 |
 |
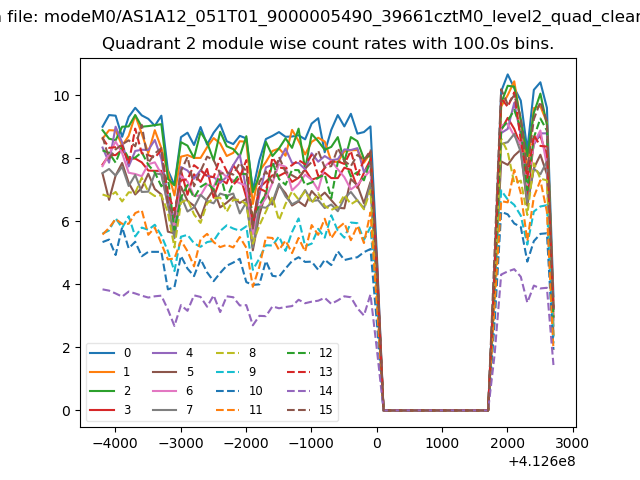
| Module-wise count rates for Quadrant B Data is divided into 100 sec bins |
 |
 |
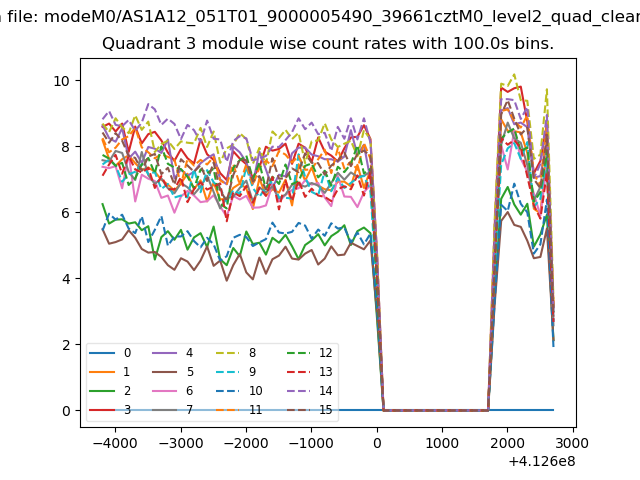
| Module-wise count rates for Quadrant C Data is divided into 100 sec bins |
 |
 |
| Module-wise count rates for Quadrant D Data is divided into 100 sec bins |
 |
 |
| Parameter | Plot |
|---|---|
| CZT HV Monitor | 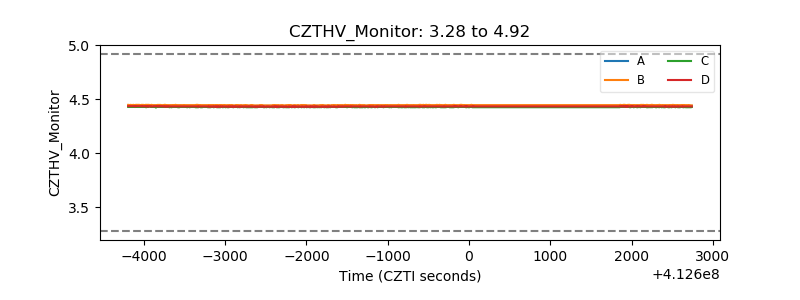 |
| D_VDD | 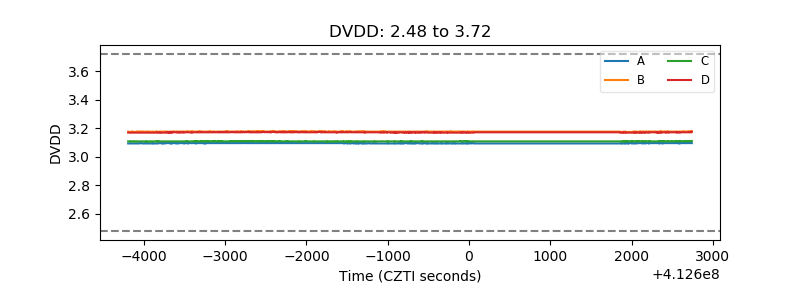 |
| Temperature 1 | 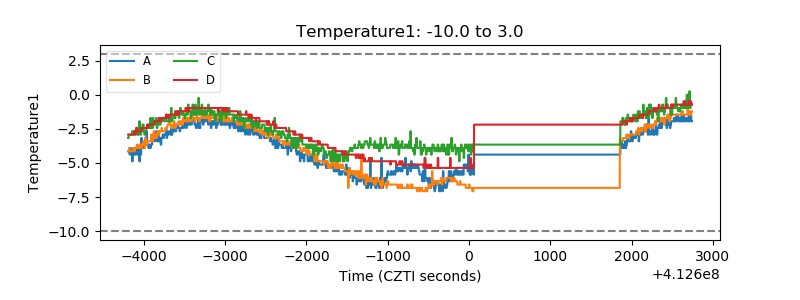 |
| Veto HV Monitor | 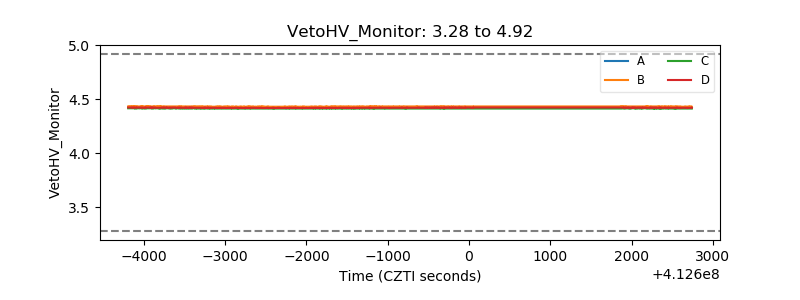 |
| Veto LLD | 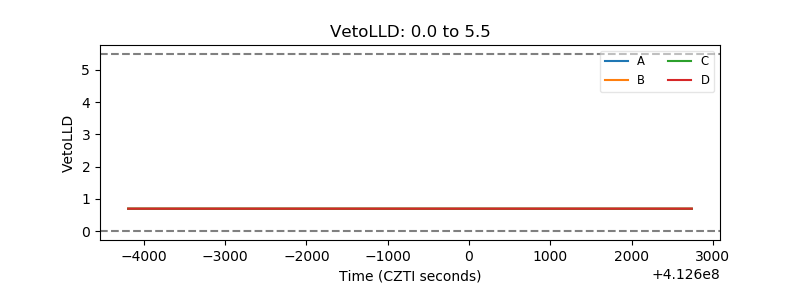 |
| Alpha Counter | 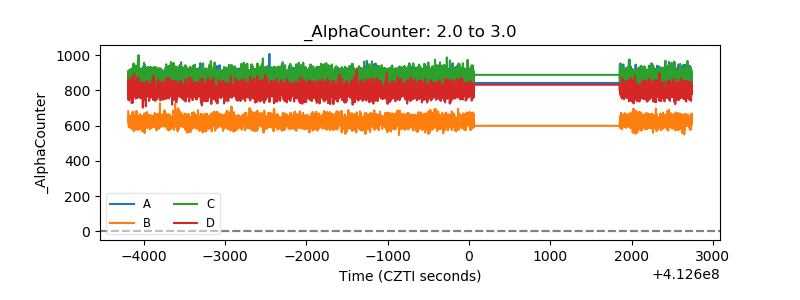 |
| _CPM_Rate | 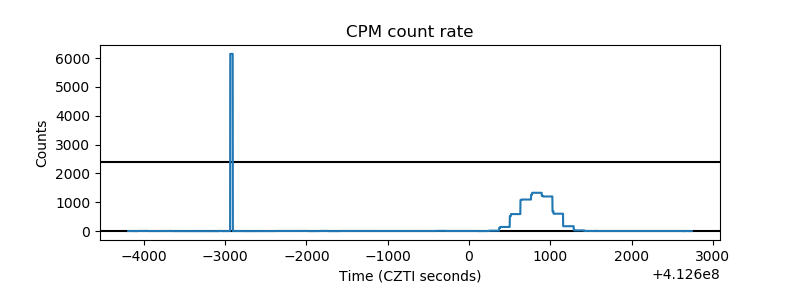 |
| CZT Counter | 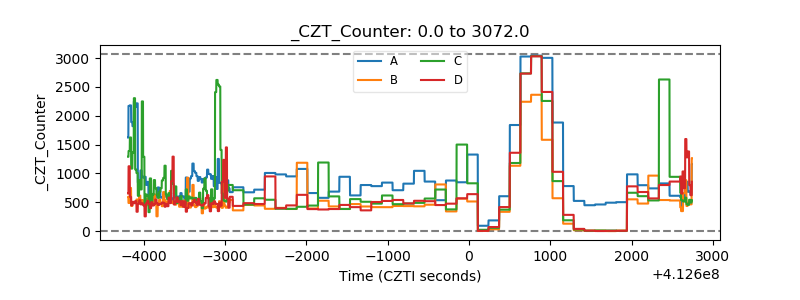 |
| +2.5 Volts monitor | 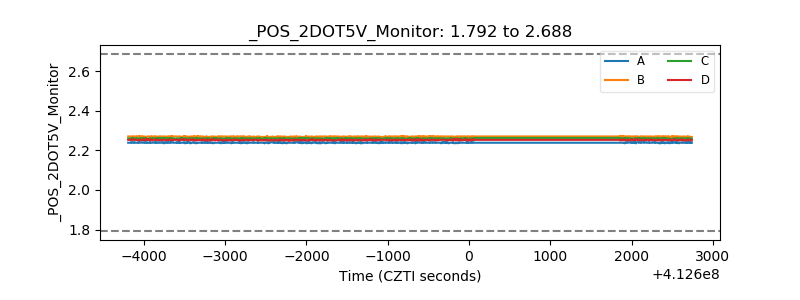 |
| +5 Volts monitor | 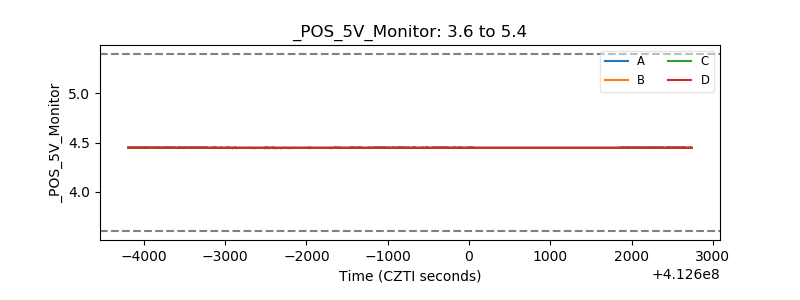 |
| _ROLL_ROT | 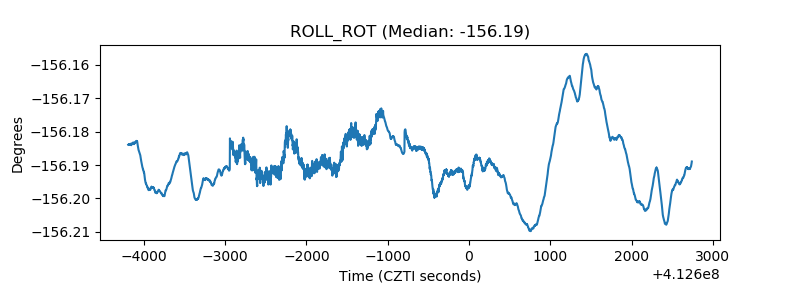 |
| _Roll_DEC | 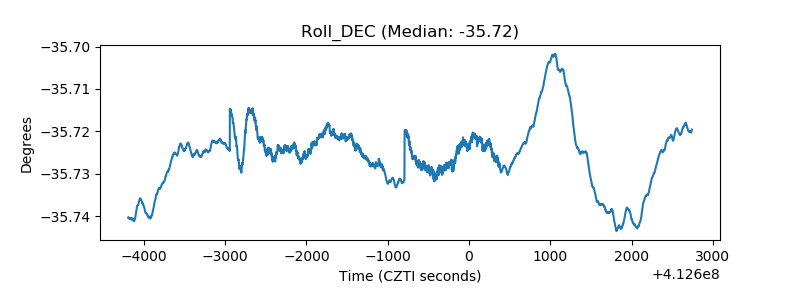 |
| _Roll_RA | 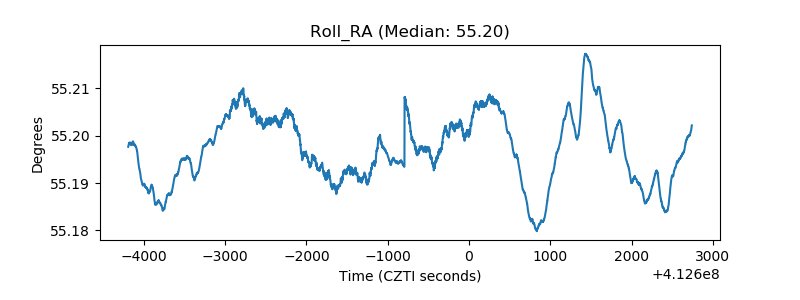 |
| Veto Counter | 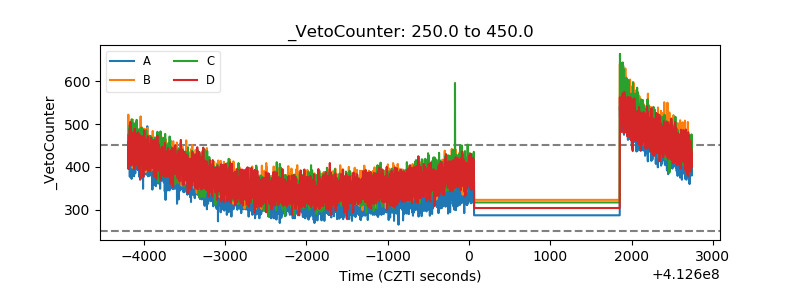 |