| Param | Original file | Final file |
|---|---|---|
| Filename | modeM0/AS1A12_051T01_9000005490_39662cztM0_level2.fits | modeM0/AS1A12_051T01_9000005490_39662cztM0_level2_quad_clean.evt |
| Size (bytes) | 469,477,440 | 90,921,600 |
| Size | 447.7 MB | 86.7 MB |
| Events in quadrant A | 4,876,005 | 568,337 |
| Events in quadrant B | 3,005,050 | 653,413 |
| Events in quadrant C | 4,549,901 | 594,212 |
| Events in quadrant D | 4,545,973 | 574,240 |
| Mode M9 | |||
|---|---|---|---|
| Quadrant | BADHDUFLAG | Total packets | Discarded packets |
| A | 0 | 21 | 0 |
| B | 0 | 21 | 0 |
| C | 0 | 21 | 0 |
| D | 0 | 22 | 0 |
| Mode M0 | |||
|---|---|---|---|
| Quadrant | BADHDUFLAG | Total packets | Discarded packets |
| A | 0 | 18253 | 3 |
| B | 0 | 12321 | 2 |
| C | 0 | 16977 | 2 |
| D | 0 | 17161 | 2 |
| Mode SS | |||
|---|---|---|---|
| Quadrant | BADHDUFLAG | Total packets | Discarded packets |
| A | 0 | 106 | 0 |
| B | 0 | 106 | 0 |
| C | 0 | 106 | 0 |
| D | 0 | 106 | 0 |
| Quadrant | Total seconds | Saturated seconds | Saturation percentage |
|---|---|---|---|
| A | 5179 | 653 | 12.608612% |
| B | 5179 | 108 | 2.085345% |
| C | 5179 | 403 | 7.781425% |
| D | 5179 | 127 | 2.452211% |
Noise dominated data is calculated using 1-second bins in cleaned event files. If a bin has >2000 counts, and if more than 50% of those come from <1% of pixels, then it is considered to be noise-dominated and hence unusable.
| Quadrant | # 1 sec bins | Bins with >0 counts | Bins with >2000 counts | High rate bins dominated by noise | Noise dominated (total time) | Noise dominated (detector-on time) | Marked lightcurve |
|---|---|---|---|---|---|---|---|
| A | 7093 | 5180 | 573 | 573 | 8.08% | 11.06% | 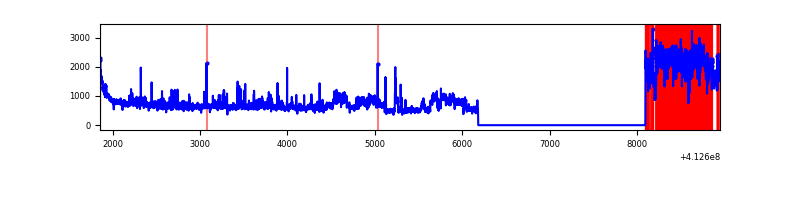 |
| B | 7093 | 5180 | 70 | 70 | 0.99% | 1.35% | 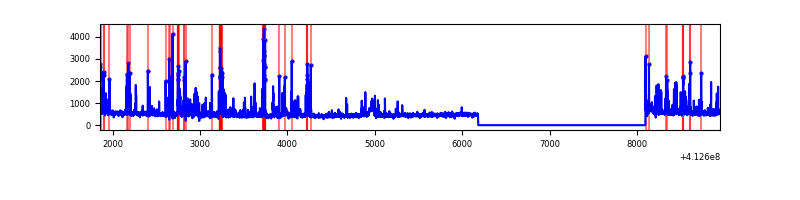 |
| C | 7093 | 5180 | 390 | 390 | 5.50% | 7.53% |  |
| D | 7093 | 5180 | 107 | 107 | 1.51% | 2.07% | 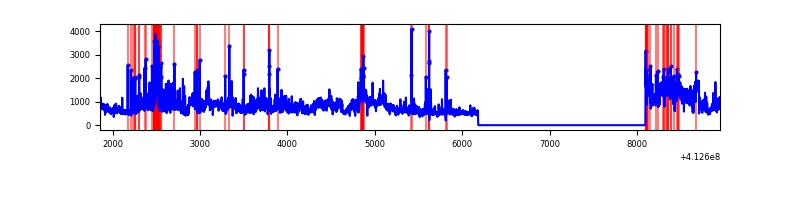 |
Top three noisy pixels from each quadrant. If the there are fewer than three noisy pixels in the level2.evt file, extra rows are filled as -1
| Pixel properties | Quadrant properties | ||||||
|---|---|---|---|---|---|---|---|
| Quadrant | DetID | PixID | Counts | Sigma | Mean | Median | Sigma |
| A | 15 | 222 | 2081905 | 17444.31 | 588 | 580 | 119.3 |
| A | 10 | 83 | 439355 | 3677.53 | 588 | 580 | 119.3 |
| A | 6 | 10 | 33995 | 280.06 | 588 | 580 | 119.3 |
| B | 5 | 172 | 409780 | 3595.81 | 599 | 586 | 113.8 |
| B | 5 | 255 | 175286 | 1535.18 | 599 | 586 | 113.8 |
| B | 15 | 85 | 34852 | 301.11 | 599 | 586 | 113.8 |
| C | 15 | 208 | 2058488 | 15644.87 | 566 | 571 | 131.5 |
| C | 15 | 214 | 213444 | 1618.32 | 566 | 571 | 131.5 |
| C | 0 | 10 | 32764 | 244.74 | 566 | 571 | 131.5 |
| D | 13 | 174 | 1611861 | 11297.28 | 582 | 567 | 142.6 |
| D | 12 | 227 | 264741 | 1852.2 | 582 | 567 | 142.6 |
| D | 1 | 52 | 102261 | 713.0 | 582 | 567 | 142.6 |
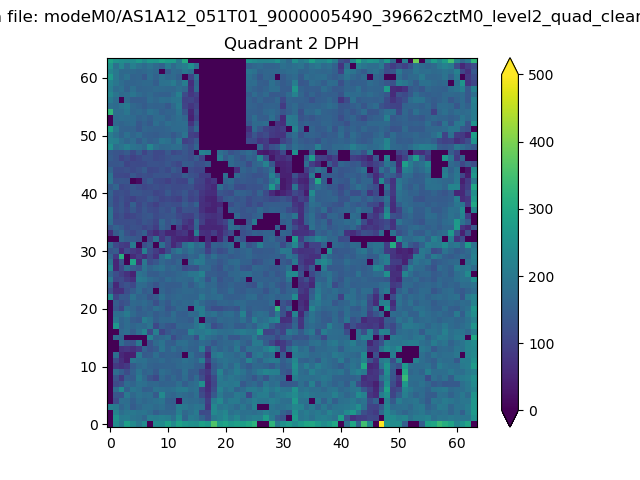
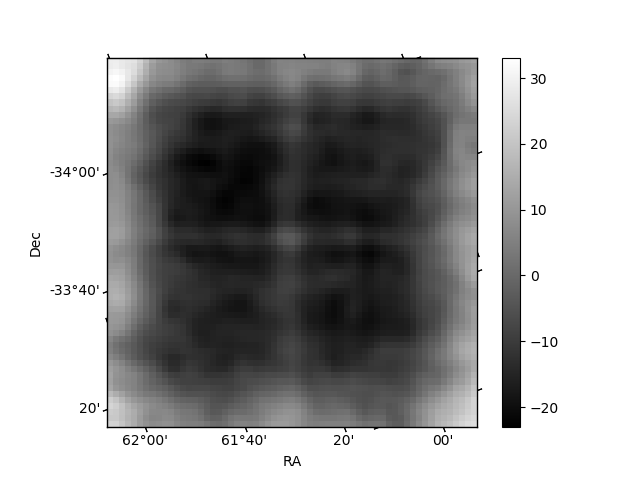
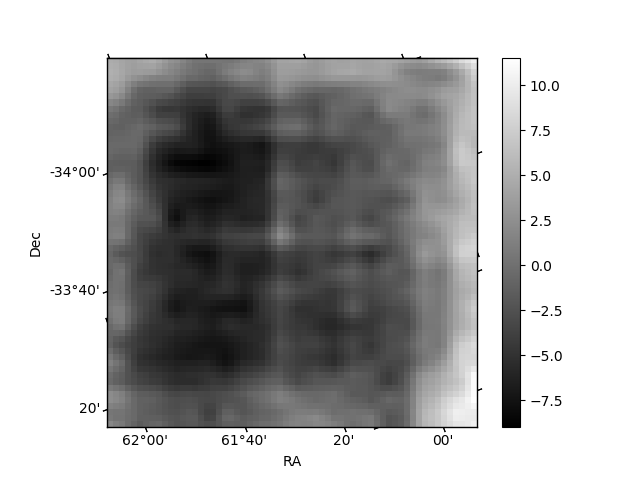
Histogram calculated using DETX and DETY for each event in the final _common_clean file
| Quadrant A | 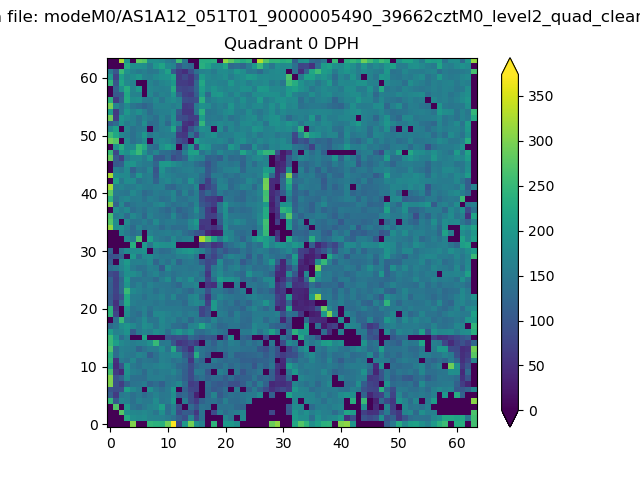 |
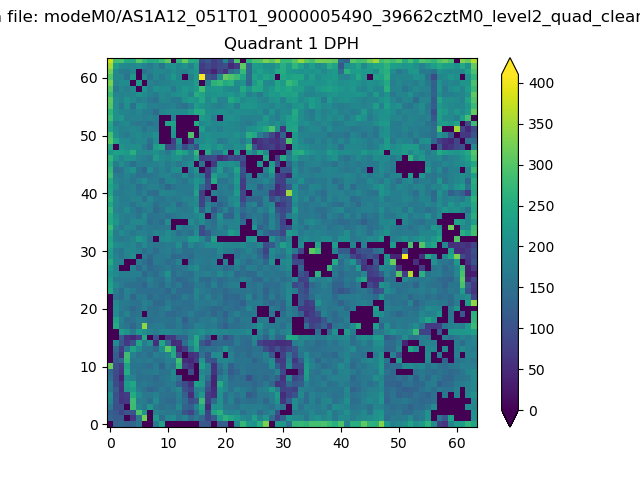 |
Quadrant B |
|---|---|---|---|
| Quadrant D | 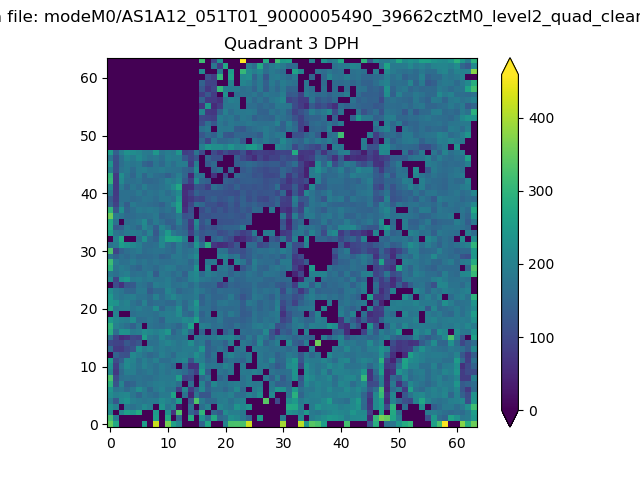 |
 |
Quadrant C |
| Plot type | Count rate plots | Images |
|---|---|---|
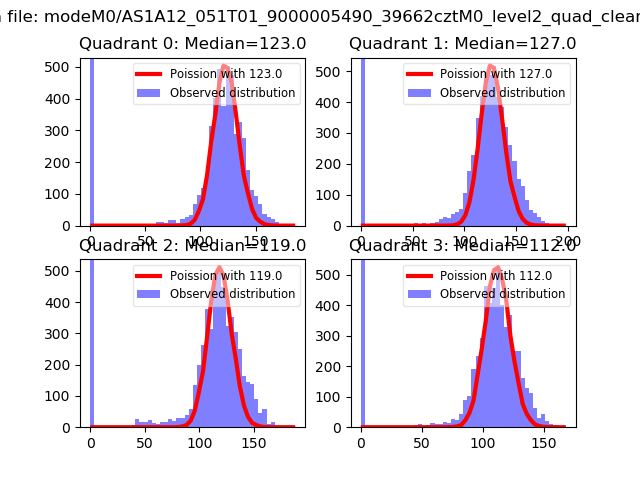
| Comparison with Poisson distribution Blue bars denote a histogram of data divided into 1 sec bins. Red curve is a Poisson curve with rate = median count rate of data. |
 |
 |
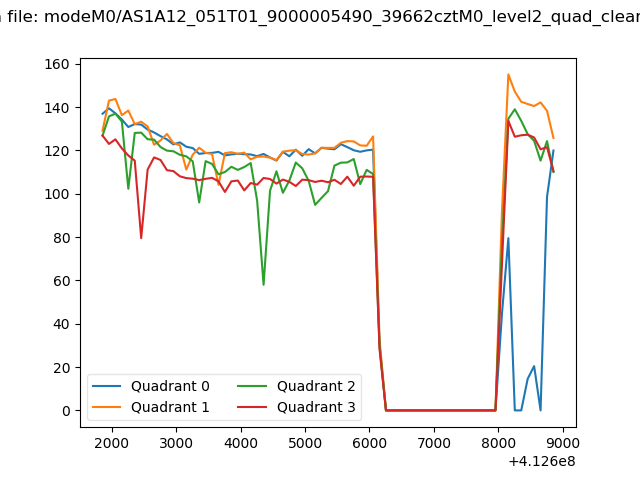
| Quadrant-wise count rates Data is divided into 100 sec bins |
 |
|
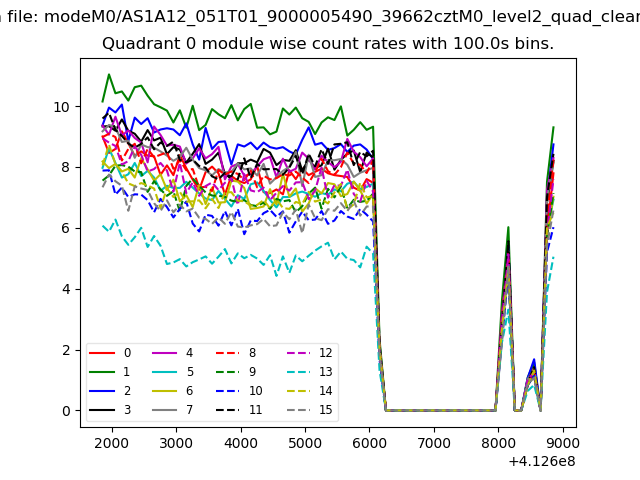
| Module-wise count rates for Quadrant A Data is divided into 100 sec bins |
 |
 |
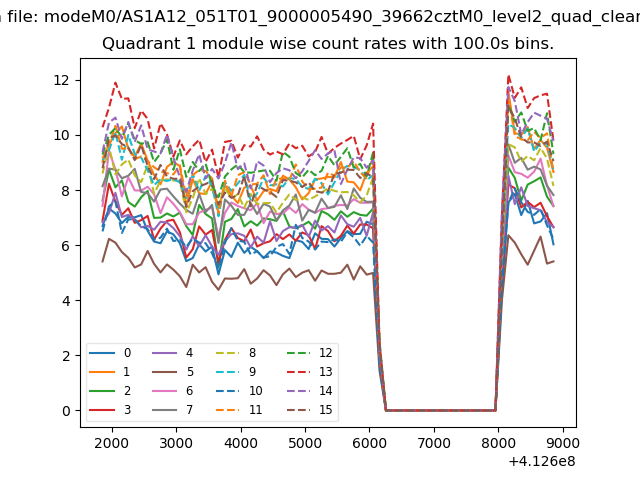
| Module-wise count rates for Quadrant B Data is divided into 100 sec bins |
 |
 |
| Module-wise count rates for Quadrant C Data is divided into 100 sec bins |
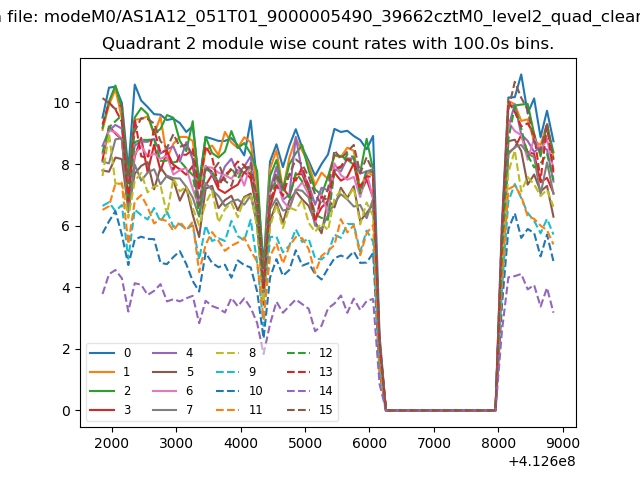 |
 |
| Module-wise count rates for Quadrant D Data is divided into 100 sec bins |
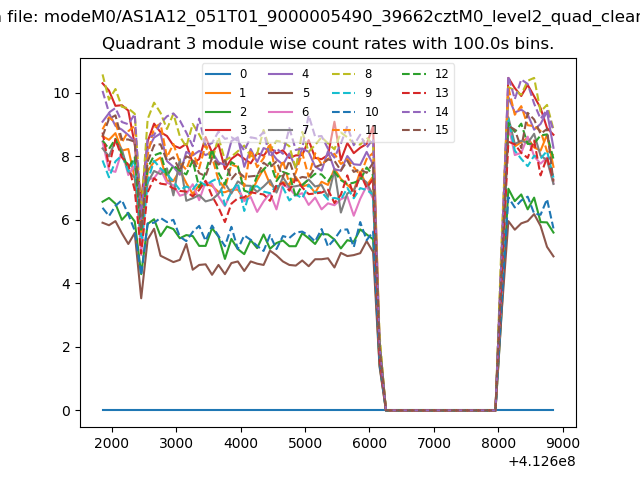 |
 |
| Parameter | Plot |
|---|---|
| CZT HV Monitor | 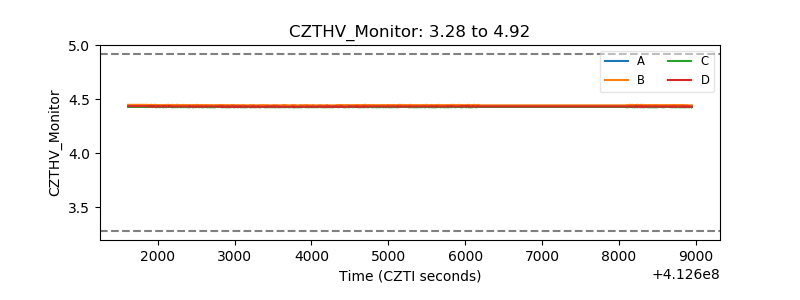 |
| D_VDD | 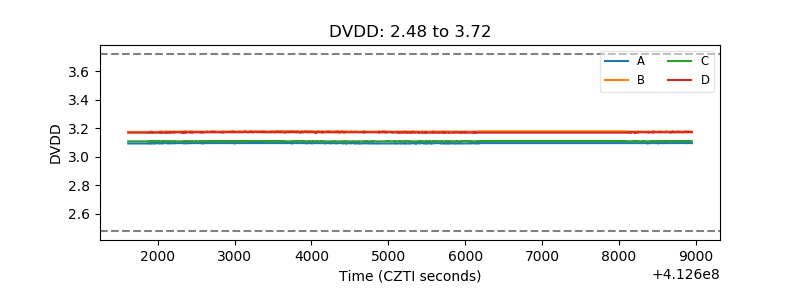 |
| Temperature 1 | 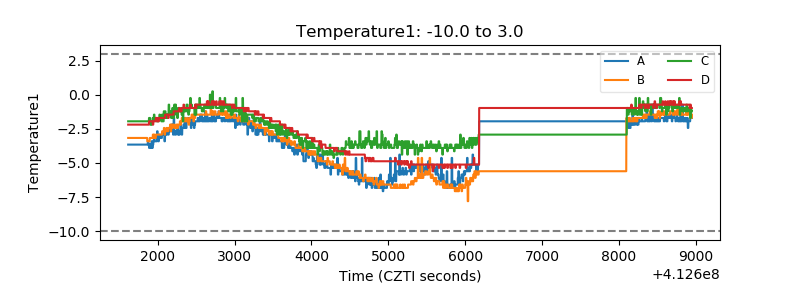 |
| Veto HV Monitor | 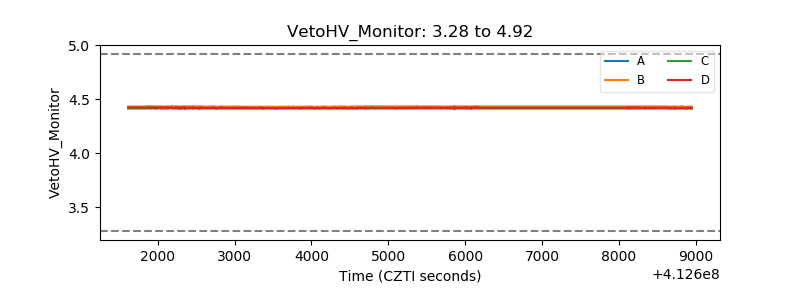 |
| Veto LLD | 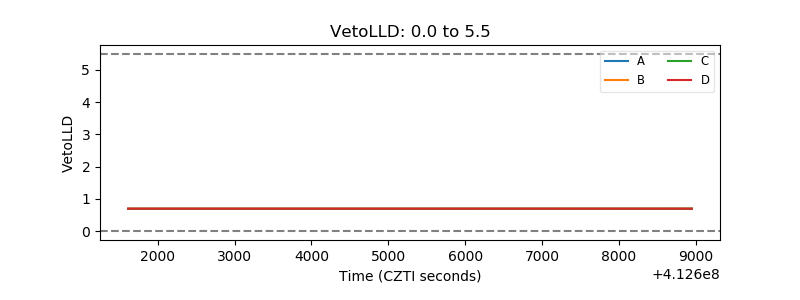 |
| Alpha Counter | 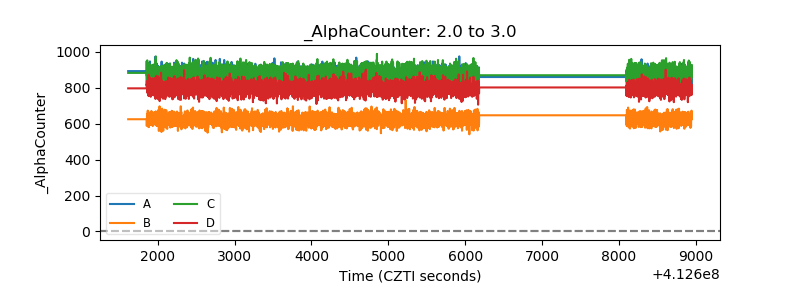 |
| _CPM_Rate | 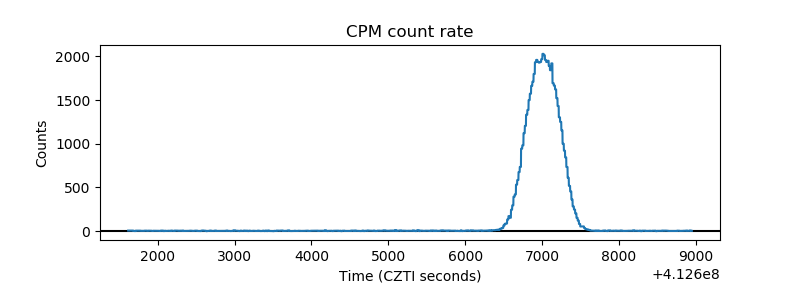 |
| CZT Counter | 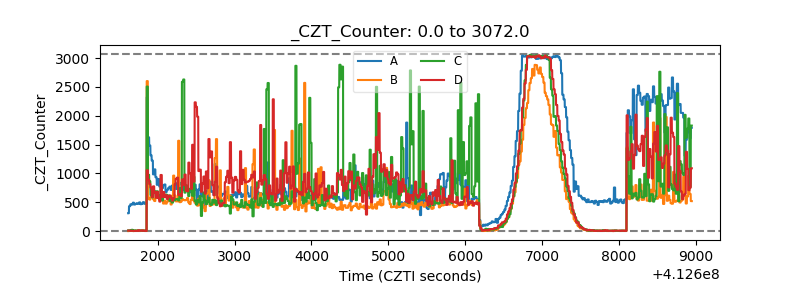 |
| +2.5 Volts monitor | 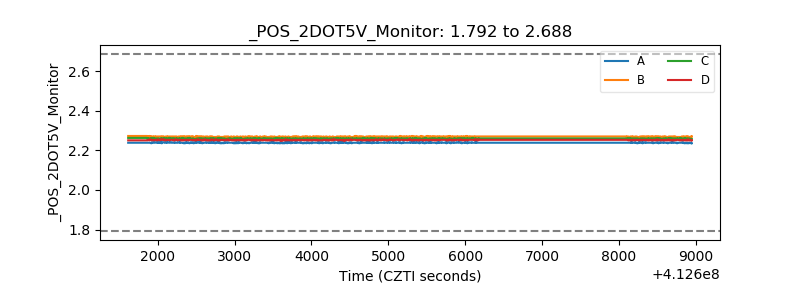 |
| +5 Volts monitor | 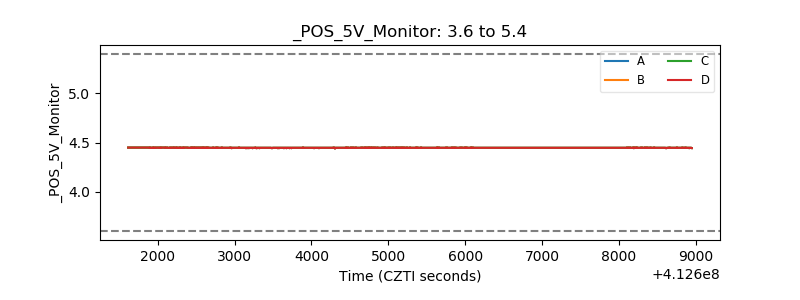 |
| _ROLL_ROT | 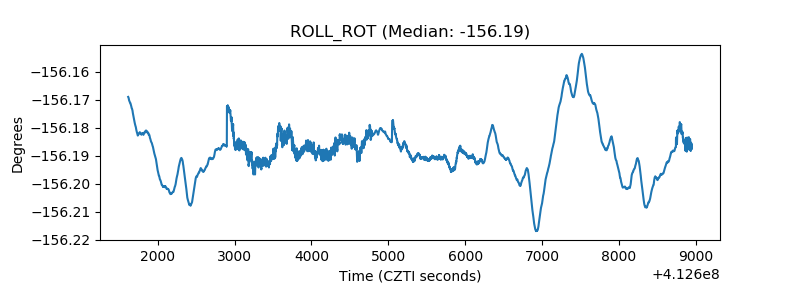 |
| _Roll_DEC | 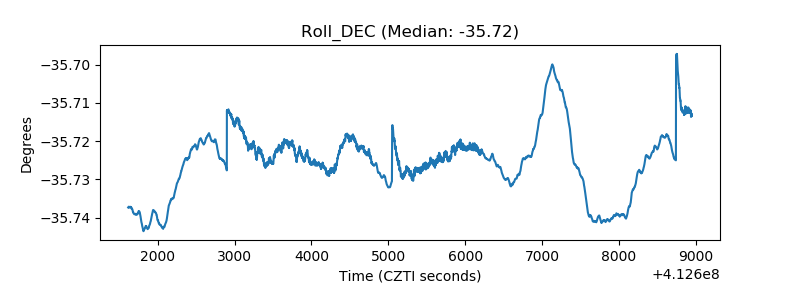 |
| _Roll_RA | 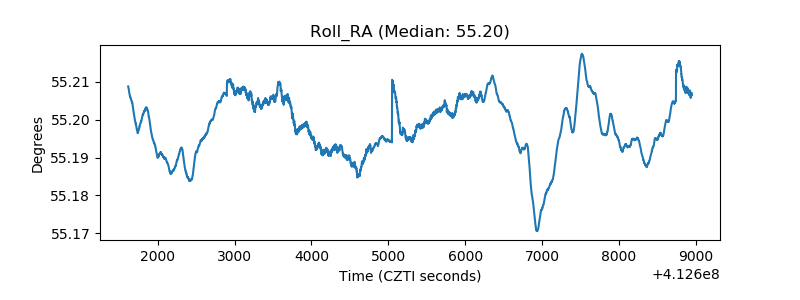 |
| Veto Counter | 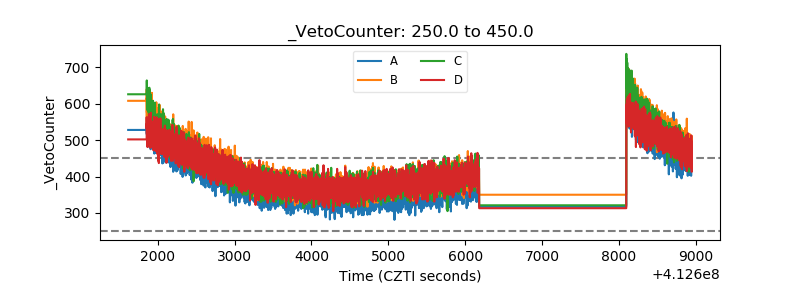 |