| Param | Original file | Final file |
|---|---|---|
| Filename | modeM0/AS1A12_051T01_9000005490_39663cztM0_level2.fits | modeM0/AS1A12_051T01_9000005490_39663cztM0_level2_quad_clean.evt |
| Size (bytes) | 570,623,040 | 87,883,200 |
| Size | 544.2 MB | 83.8 MB |
| Events in quadrant A | 7,273,914 | 483,429 |
| Events in quadrant B | 3,293,220 | 664,558 |
| Events in quadrant C | 5,618,768 | 565,802 |
| Events in quadrant D | 4,534,920 | 583,857 |
| Mode M9 | |||
|---|---|---|---|
| Quadrant | BADHDUFLAG | Total packets | Discarded packets |
| A | 0 | 20 | 0 |
| B | 0 | 20 | 0 |
| C | 0 | 20 | 0 |
| D | 0 | 20 | 0 |
| Mode M0 | |||
|---|---|---|---|
| Quadrant | BADHDUFLAG | Total packets | Discarded packets |
| A | 0 | 25274 | 2 |
| B | 0 | 13139 | 1 |
| C | 0 | 20176 | 1 |
| D | 0 | 17066 | 1 |
| Mode SS | |||
|---|---|---|---|
| Quadrant | BADHDUFLAG | Total packets | Discarded packets |
| A | 0 | 106 | 0 |
| B | 0 | 106 | 0 |
| C | 0 | 106 | 0 |
| D | 0 | 106 | 0 |
| Quadrant | Total seconds | Saturated seconds | Saturation percentage |
|---|---|---|---|
| A | 5188 | 1619 | 31.206631% |
| B | 5188 | 192 | 3.700848% |
| C | 5188 | 769 | 14.822668% |
| D | 5188 | 208 | 4.009252% |
Noise dominated data is calculated using 1-second bins in cleaned event files. If a bin has >2000 counts, and if more than 50% of those come from <1% of pixels, then it is considered to be noise-dominated and hence unusable.
| Quadrant | # 1 sec bins | Bins with >0 counts | Bins with >2000 counts | High rate bins dominated by noise | Noise dominated (total time) | Noise dominated (detector-on time) | Marked lightcurve |
|---|---|---|---|---|---|---|---|
| A | 7221 | 5189 | 1575 | 1575 | 21.81% | 30.35% | 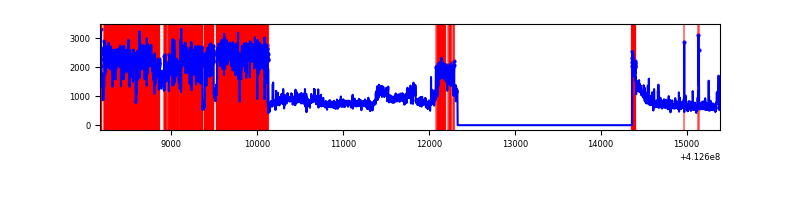 |
| B | 7221 | 5189 | 140 | 140 | 1.94% | 2.70% | 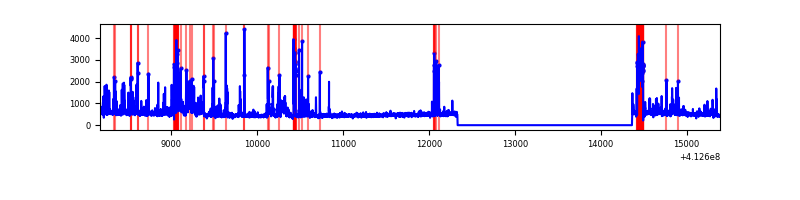 |
| C | 7221 | 5189 | 766 | 766 | 10.61% | 14.76% | 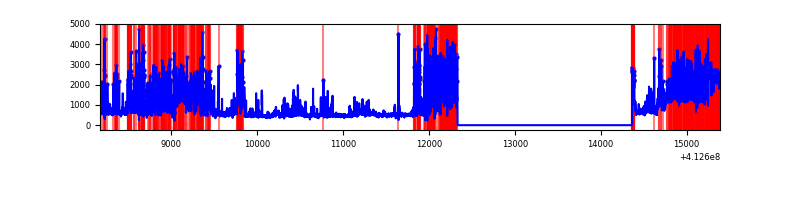 |
| D | 7221 | 5189 | 214 | 214 | 2.96% | 4.12% | 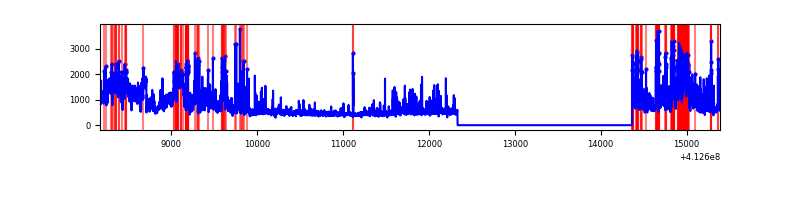 |
Top three noisy pixels from each quadrant. If the there are fewer than three noisy pixels in the level2.evt file, extra rows are filled as -1
| Pixel properties | Quadrant properties | ||||||
|---|---|---|---|---|---|---|---|
| Quadrant | DetID | PixID | Counts | Sigma | Mean | Median | Sigma |
| A | 15 | 222 | 4610421 | 40334.83 | 571 | 563 | 114.3 |
| A | 10 | 83 | 410104 | 3583.36 | 571 | 563 | 114.3 |
| A | 15 | 174 | 14282 | 120.04 | 571 | 563 | 114.3 |
| B | 5 | 172 | 836124 | 7345.59 | 601 | 588 | 113.7 |
| B | 15 | 32 | 28537 | 245.71 | 601 | 588 | 113.7 |
| B | 0 | 186 | 17906 | 152.25 | 601 | 588 | 113.7 |
| C | 15 | 208 | 2982676 | 23155.78 | 556 | 561 | 128.8 |
| C | 15 | 214 | 208564 | 1615.12 | 556 | 561 | 128.8 |
| C | 3 | 233 | 207238 | 1604.82 | 556 | 561 | 128.8 |
| D | 13 | 174 | 1172648 | 8281.39 | 584 | 569 | 141.5 |
| D | 9 | 64 | 584270 | 4124.17 | 584 | 569 | 141.5 |
| D | 1 | 52 | 268495 | 1893.05 | 584 | 569 | 141.5 |
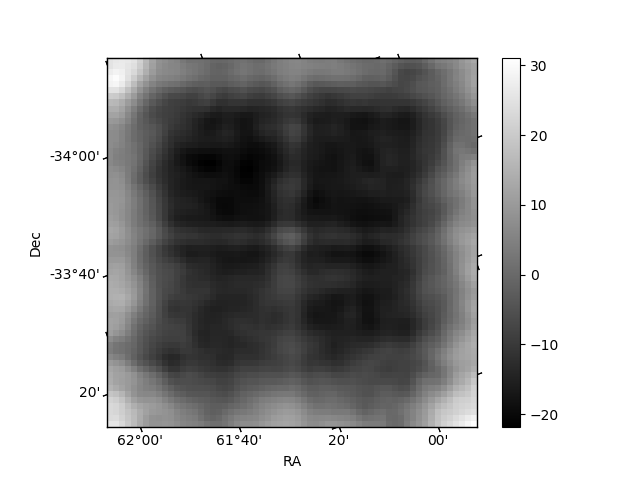
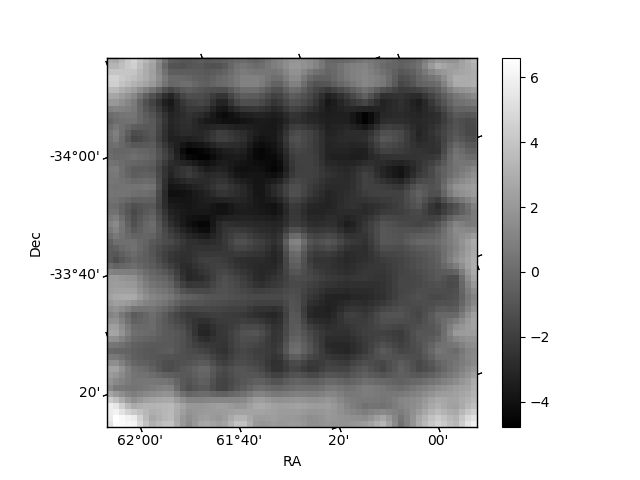
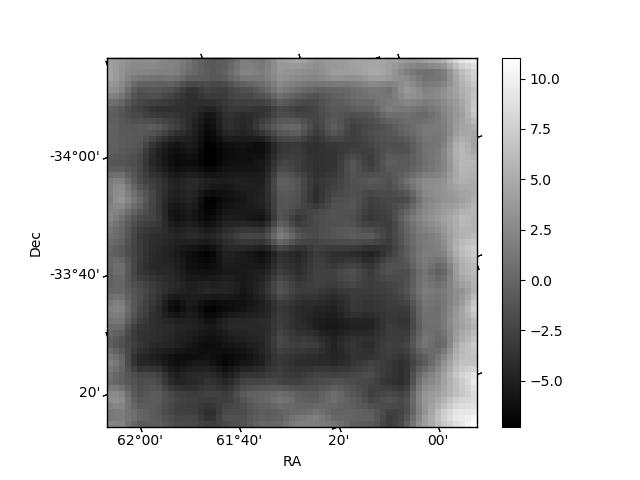
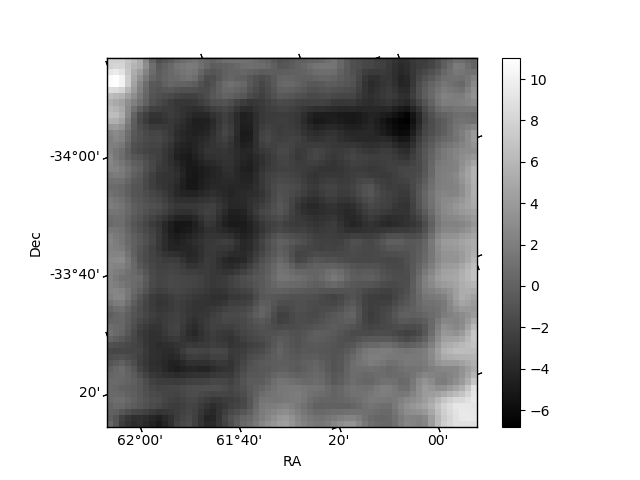
Histogram calculated using DETX and DETY for each event in the final _common_clean file
| Quadrant A | 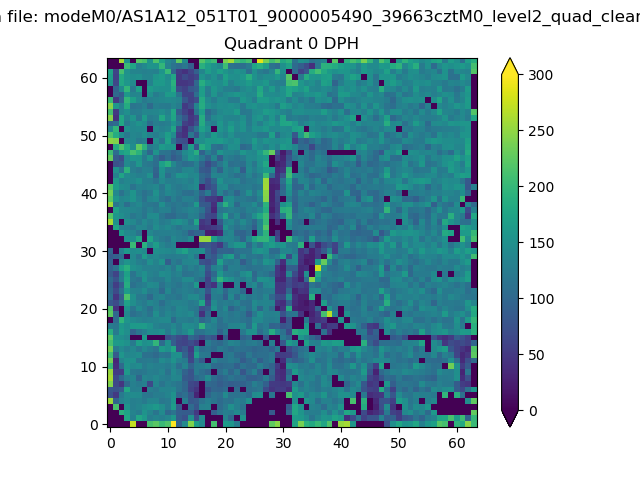 |
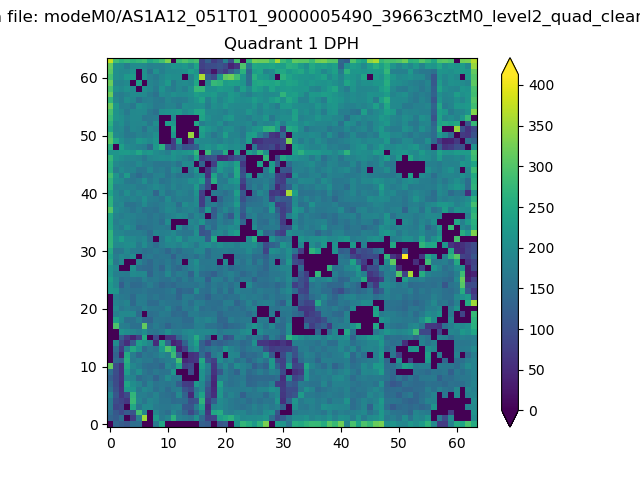 |
Quadrant B |
|---|---|---|---|
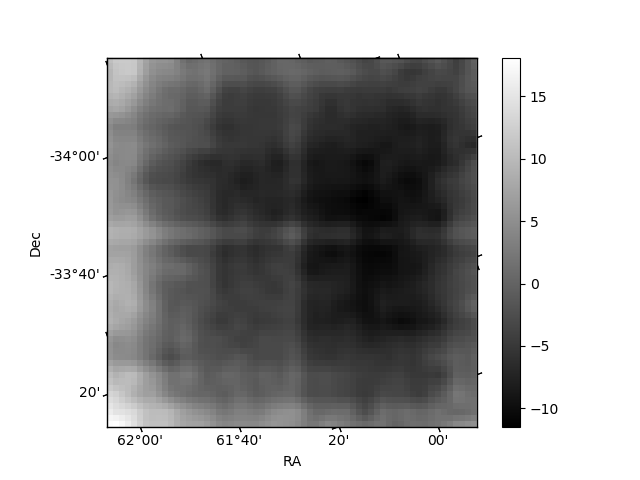
| Quadrant D | 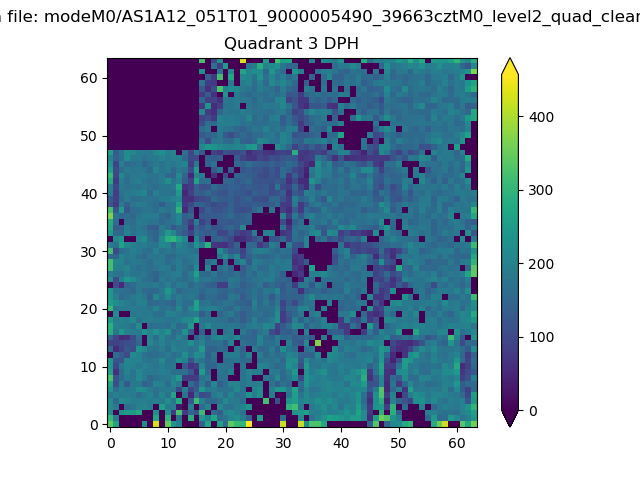 |
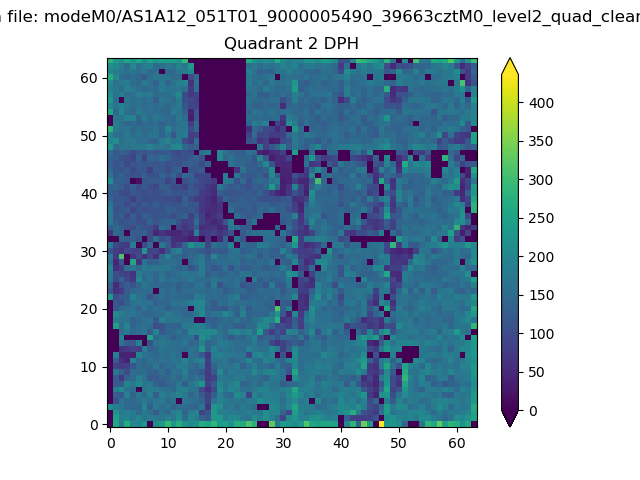 |
Quadrant C |
| Plot type | Count rate plots | Images |
|---|---|---|
| Comparison with Poisson distribution Blue bars denote a histogram of data divided into 1 sec bins. Red curve is a Poisson curve with rate = median count rate of data. |
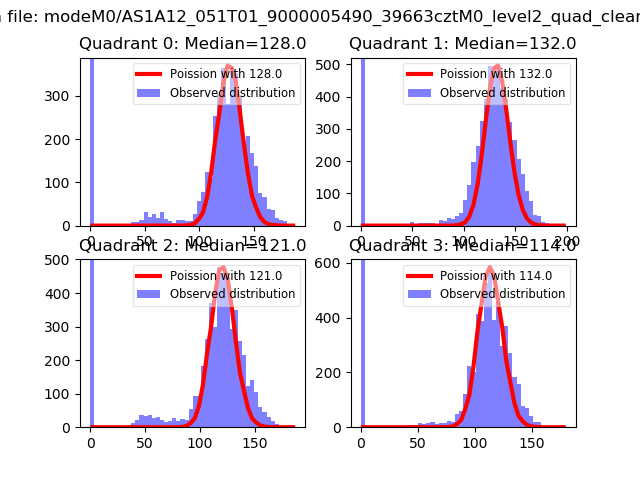 |
 |
| Quadrant-wise count rates Data is divided into 100 sec bins |
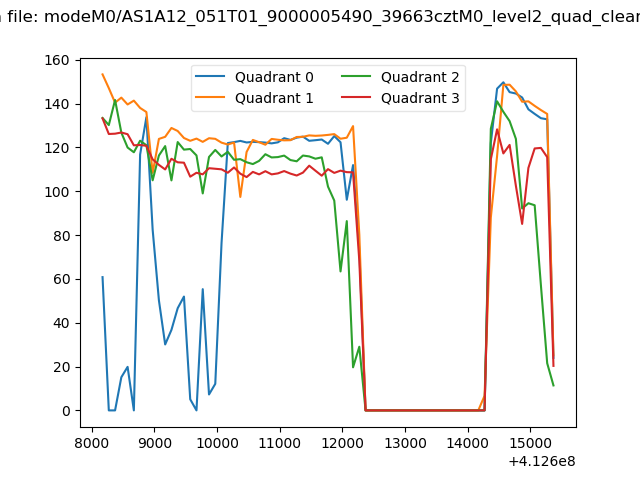 |
|
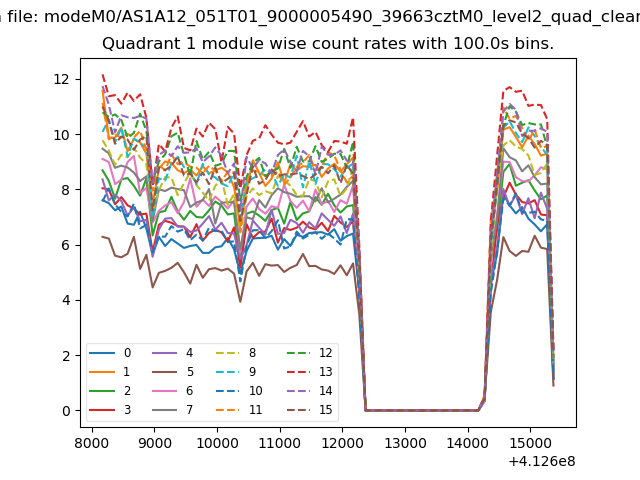
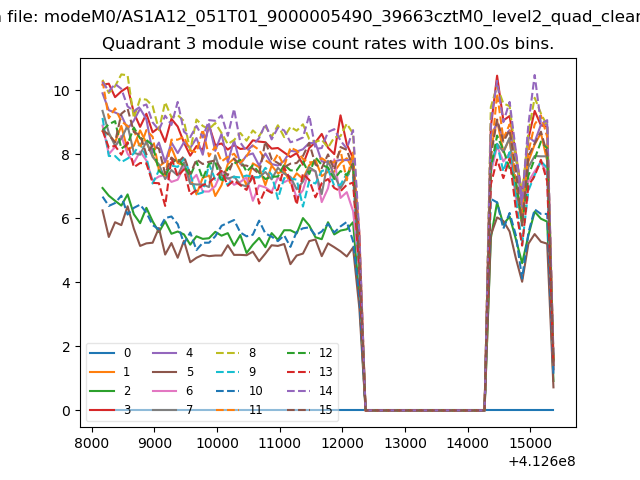
| Module-wise count rates for Quadrant A Data is divided into 100 sec bins |
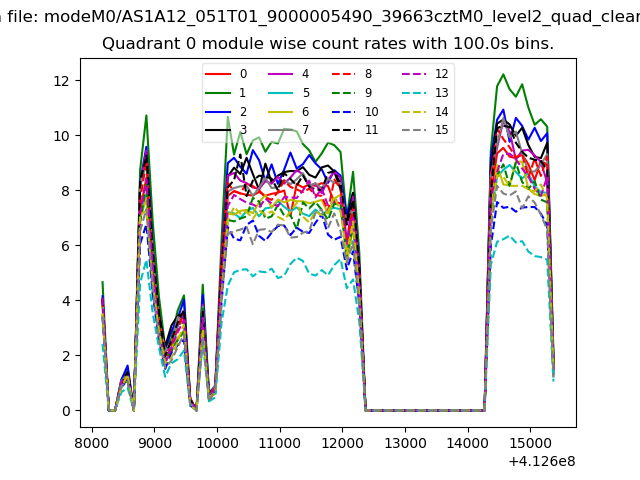 |
 |
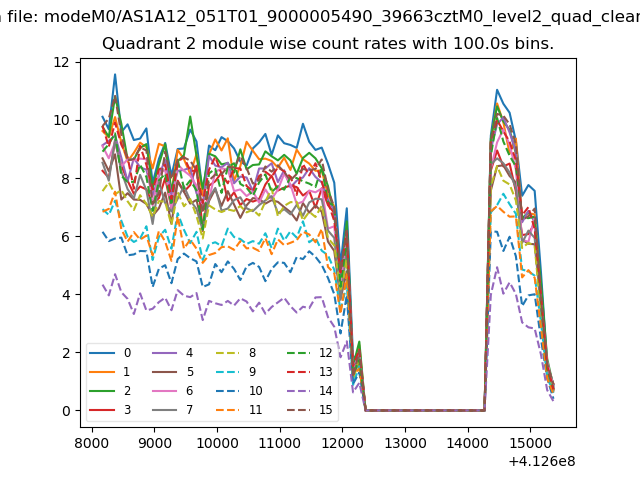
| Module-wise count rates for Quadrant B Data is divided into 100 sec bins |
 |
 |
| Module-wise count rates for Quadrant C Data is divided into 100 sec bins |
 |
 |
| Module-wise count rates for Quadrant D Data is divided into 100 sec bins |
 |
 |
| Parameter | Plot |
|---|---|
| CZT HV Monitor |  |
| D_VDD | 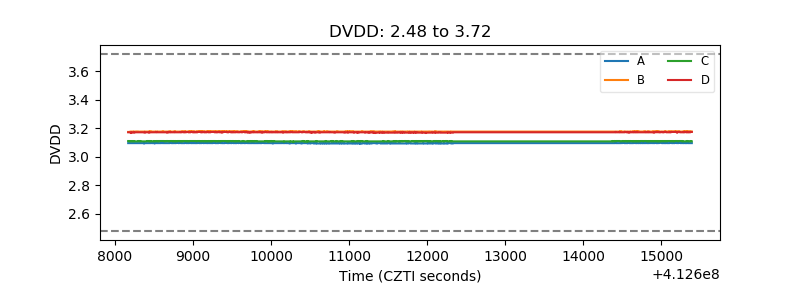 |
| Temperature 1 | 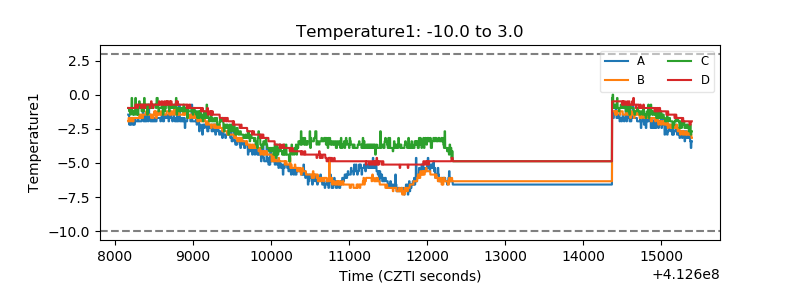 |
| Veto HV Monitor | 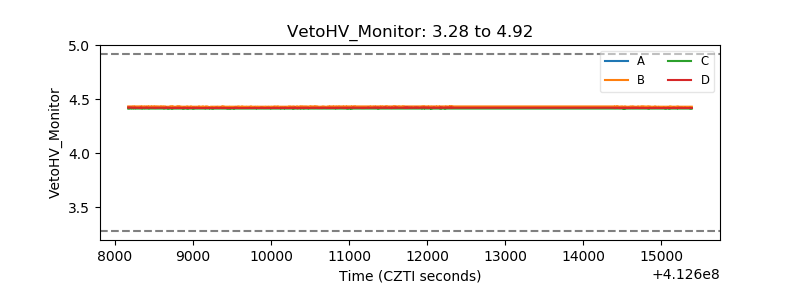 |
| Veto LLD | 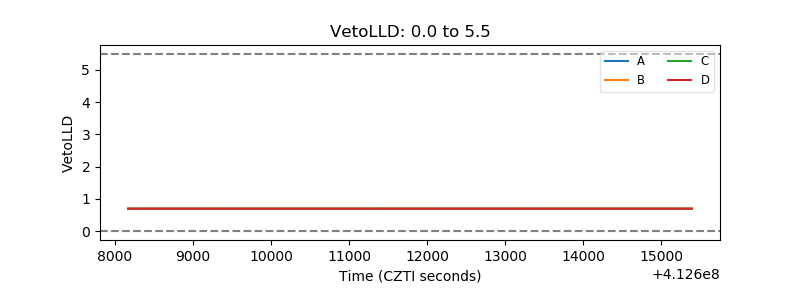 |
| Alpha Counter | 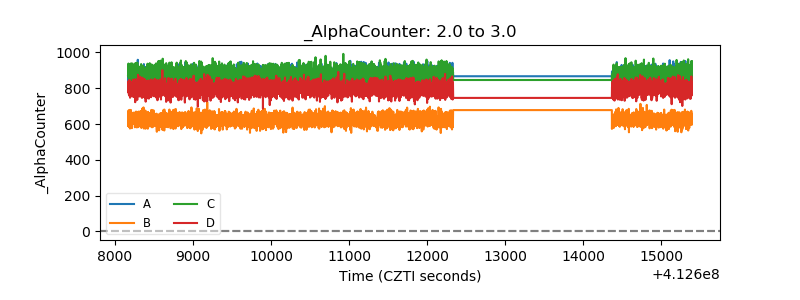 |
| _CPM_Rate | 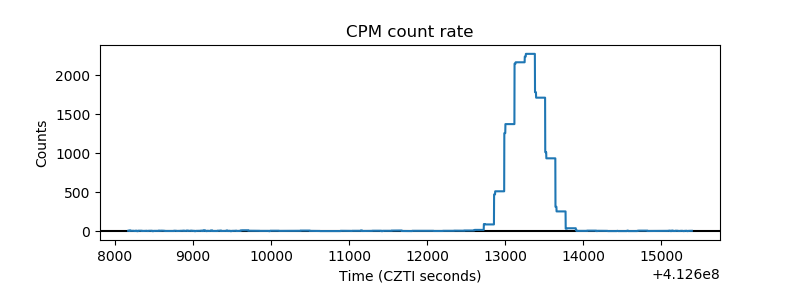 |
| CZT Counter | 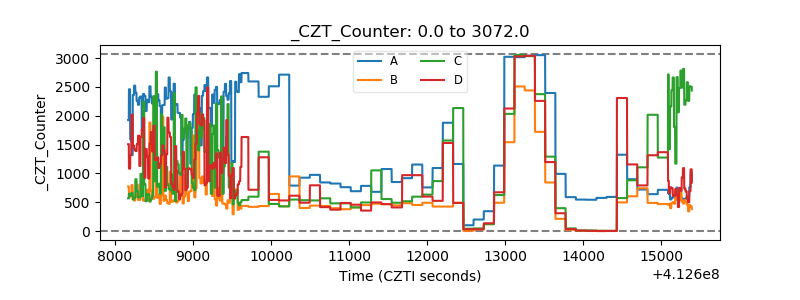 |
| +2.5 Volts monitor | 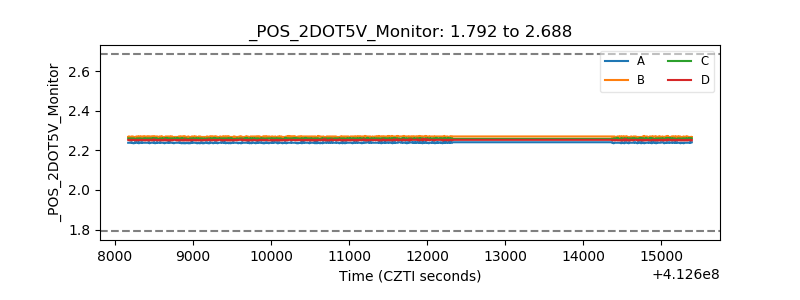 |
| +5 Volts monitor | 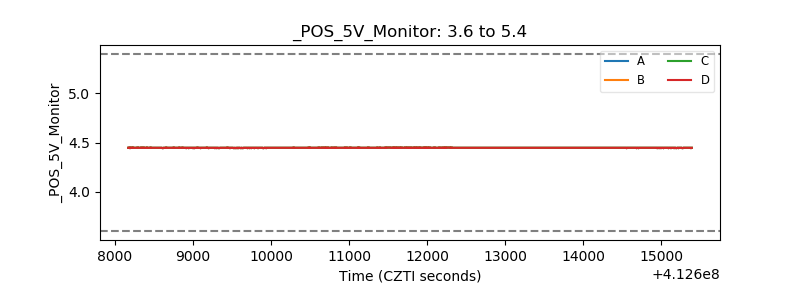 |
| _ROLL_ROT | 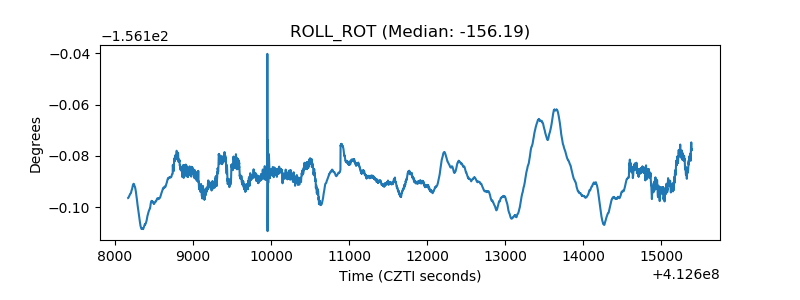 |
| _Roll_DEC | 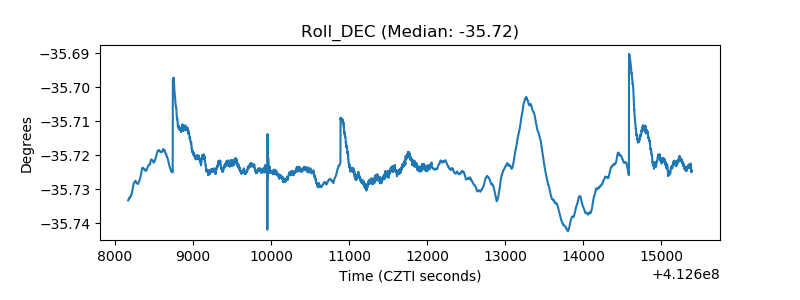 |
| _Roll_RA | 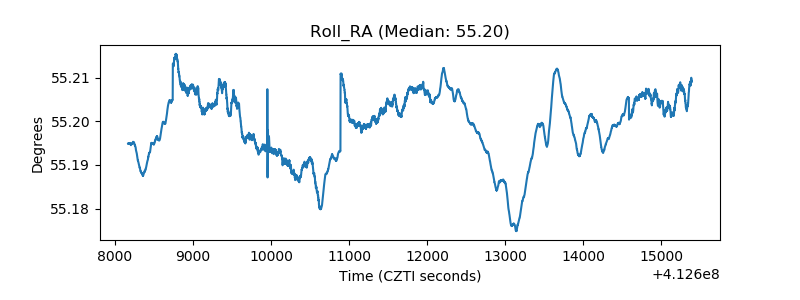 |
| Veto Counter | 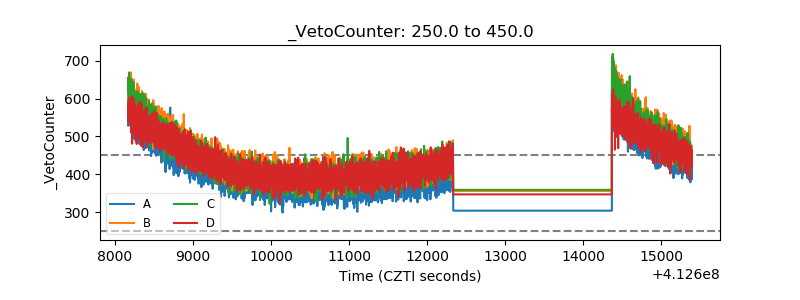 |