| Param | Original file | Final file |
|---|---|---|
| Filename | modeM0/AS1A12_051T01_9000005490_39664cztM0_level2.fits | modeM0/AS1A12_051T01_9000005490_39664cztM0_level2_quad_clean.evt |
| Size (bytes) | 513,008,640 | 88,197,120 |
| Size | 489.2 MB | 84.1 MB |
| Events in quadrant A | 3,936,158 | 646,372 |
| Events in quadrant B | 2,820,152 | 658,178 |
| Events in quadrant C | 7,868,357 | 436,230 |
| Events in quadrant D | 3,965,540 | 569,315 |
| Mode M9 | |||
|---|---|---|---|
| Quadrant | BADHDUFLAG | Total packets | Discarded packets |
| A | 0 | 21 | 0 |
| B | 0 | 21 | 0 |
| C | 0 | 21 | 0 |
| D | 0 | 21 | 0 |
| Mode M0 | |||
|---|---|---|---|
| Quadrant | BADHDUFLAG | Total packets | Discarded packets |
| A | 0 | 15215 | 2 |
| B | 0 | 11759 | 1 |
| C | 0 | 26824 | 1 |
| D | 0 | 15266 | 1 |
| Mode SS | |||
|---|---|---|---|
| Quadrant | BADHDUFLAG | Total packets | Discarded packets |
| A | 0 | 104 | 0 |
| B | 0 | 104 | 0 |
| C | 0 | 104 | 0 |
| D | 0 | 104 | 0 |
| Quadrant | Total seconds | Saturated seconds | Saturation percentage |
|---|---|---|---|
| A | 5149 | 224 | 4.350359% |
| B | 5149 | 139 | 2.699553% |
| C | 5149 | 1838 | 35.696252% |
| D | 5149 | 230 | 4.466887% |
Noise dominated data is calculated using 1-second bins in cleaned event files. If a bin has >2000 counts, and if more than 50% of those come from <1% of pixels, then it is considered to be noise-dominated and hence unusable.
| Quadrant | # 1 sec bins | Bins with >0 counts | Bins with >2000 counts | High rate bins dominated by noise | Noise dominated (total time) | Noise dominated (detector-on time) | Marked lightcurve |
|---|---|---|---|---|---|---|---|
| A | 7241 | 5150 | 245 | 245 | 3.38% | 4.76% |  |
| B | 7241 | 5150 | 105 | 105 | 1.45% | 2.04% |  |
| C | 7241 | 5149 | 1703 | 1703 | 23.52% | 33.07% | 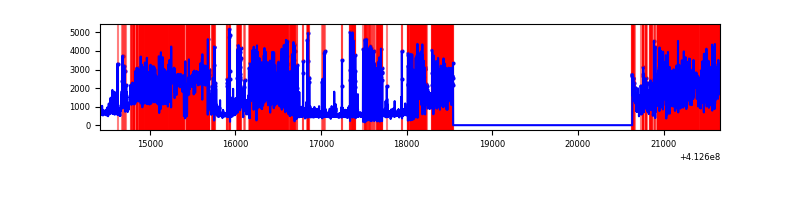 |
| D | 7241 | 5150 | 240 | 240 | 3.31% | 4.66% | 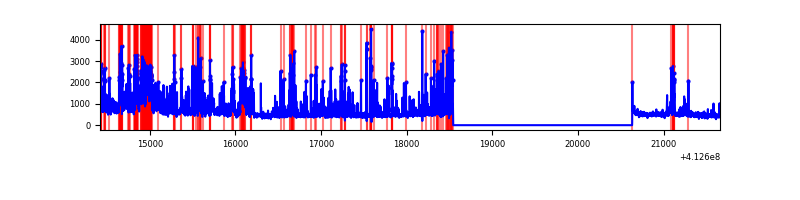 |
Top three noisy pixels from each quadrant. If the there are fewer than three noisy pixels in the level2.evt file, extra rows are filled as -1
| Pixel properties | Quadrant properties | ||||||
|---|---|---|---|---|---|---|---|
| Quadrant | DetID | PixID | Counts | Sigma | Mean | Median | Sigma |
| A | 15 | 222 | 994891 | 8261.0 | 599 | 590 | 120.4 |
| A | 10 | 83 | 445480 | 3696.3 | 599 | 590 | 120.4 |
| A | 15 | 174 | 98078 | 809.96 | 599 | 590 | 120.4 |
| B | 5 | 172 | 450716 | 4033.62 | 591 | 577 | 111.6 |
| B | 0 | 186 | 23007 | 200.99 | 591 | 577 | 111.6 |
| B | 12 | 111 | 13438 | 115.25 | 591 | 577 | 111.6 |
| C | 15 | 208 | 5171935 | 45361.92 | 492 | 496 | 114.0 |
| C | 9 | 187 | 392786 | 3441.02 | 492 | 496 | 114.0 |
| C | 15 | 214 | 191138 | 1672.24 | 492 | 496 | 114.0 |
| D | 9 | 64 | 612323 | 4419.57 | 569 | 553 | 138.4 |
| D | 12 | 227 | 473869 | 3419.35 | 569 | 553 | 138.4 |
| D | 13 | 174 | 303124 | 2185.85 | 569 | 553 | 138.4 |
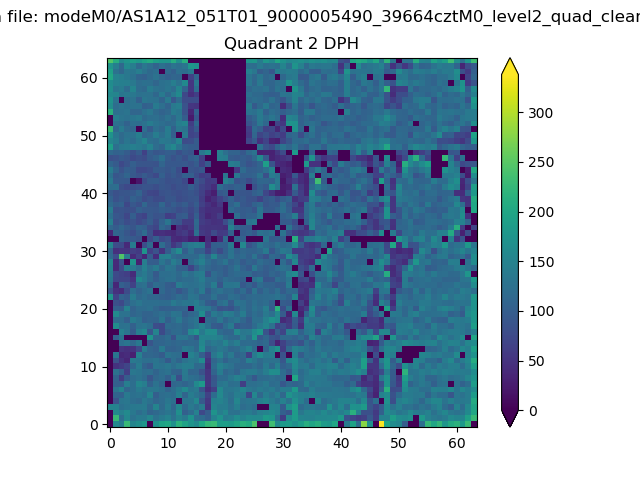
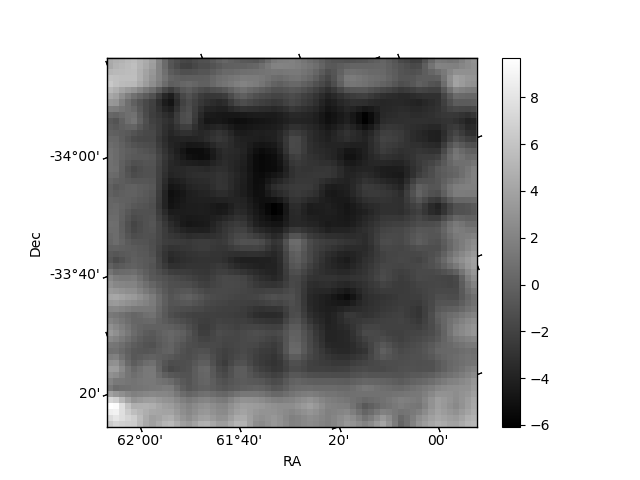
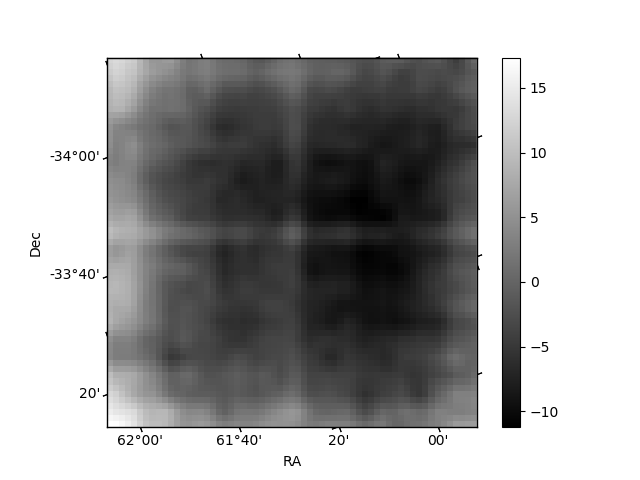
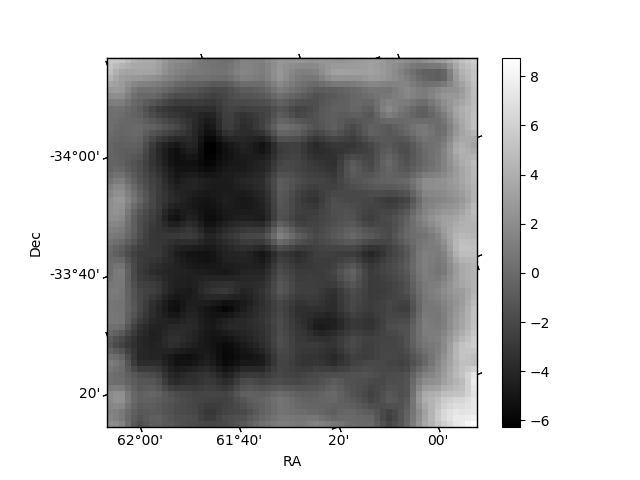
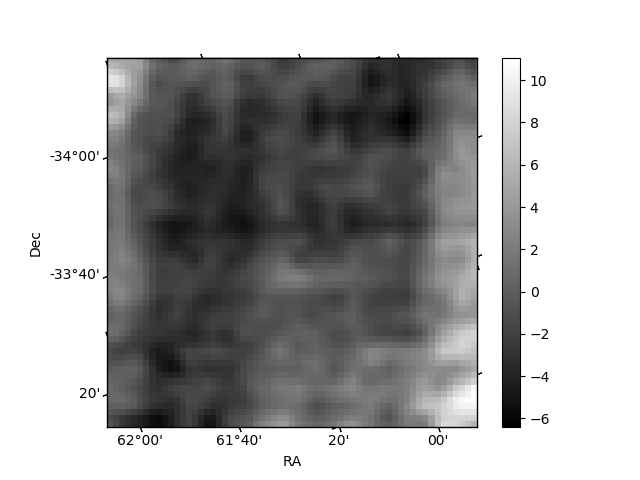
Histogram calculated using DETX and DETY for each event in the final _common_clean file
| Quadrant A | 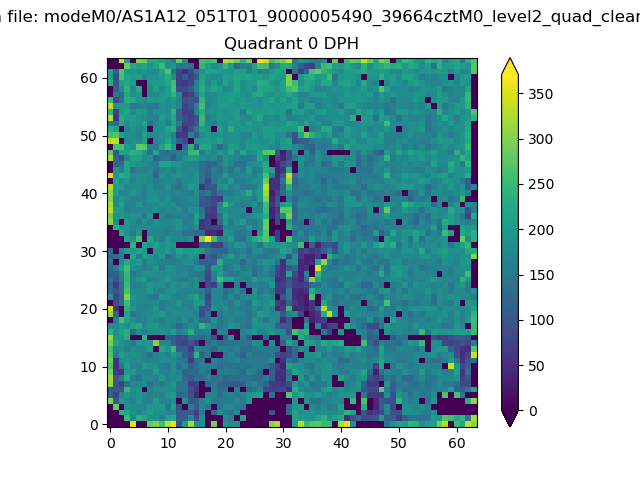 |
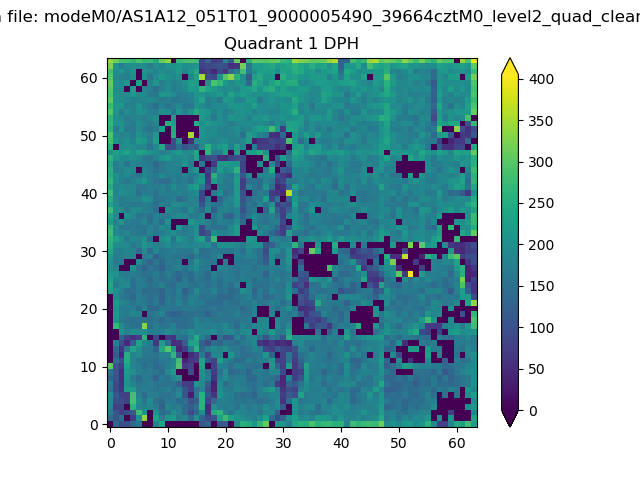 |
Quadrant B |
|---|---|---|---|
| Quadrant D | 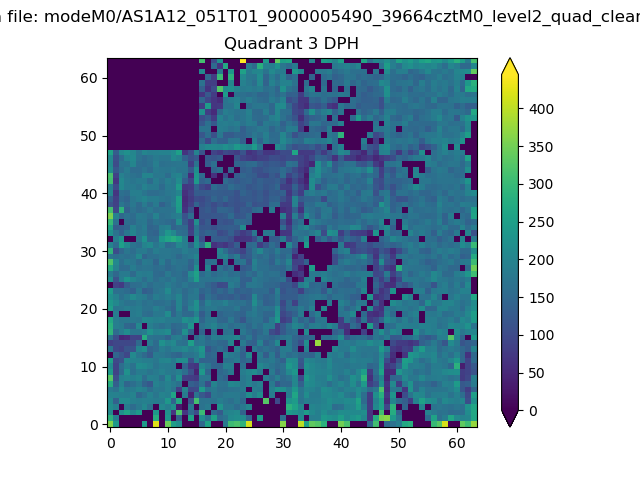 |
 |
Quadrant C |
| Plot type | Count rate plots | Images |
|---|---|---|
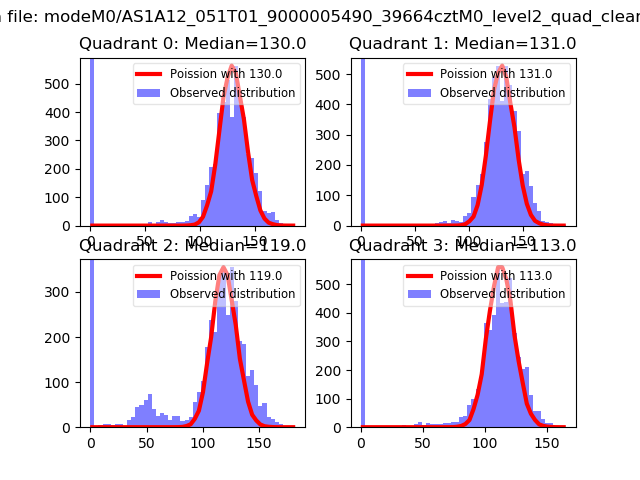
| Comparison with Poisson distribution Blue bars denote a histogram of data divided into 1 sec bins. Red curve is a Poisson curve with rate = median count rate of data. |
 |
 |
| Quadrant-wise count rates Data is divided into 100 sec bins |
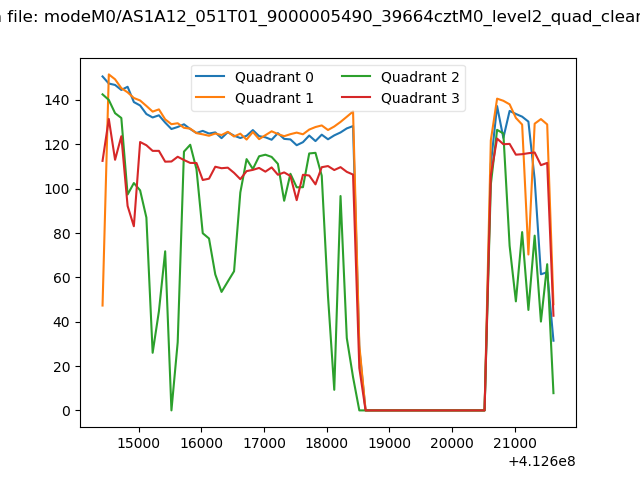 |
|
| Module-wise count rates for Quadrant A Data is divided into 100 sec bins |
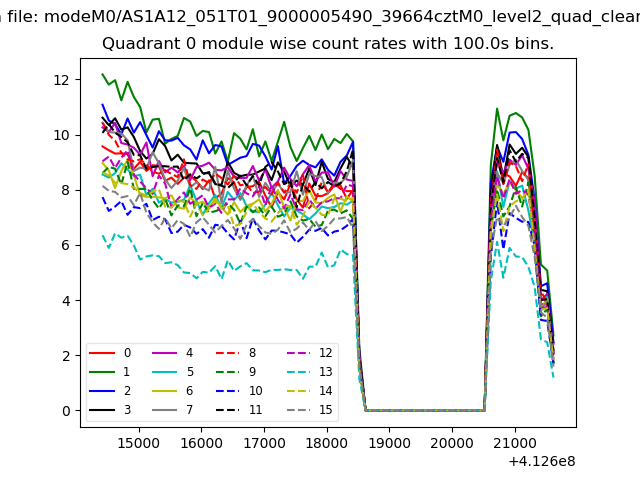 |
 |
| Module-wise count rates for Quadrant B Data is divided into 100 sec bins |
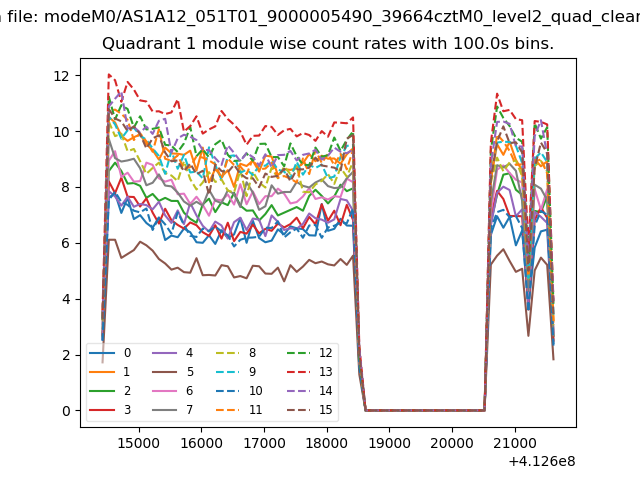 |
 |
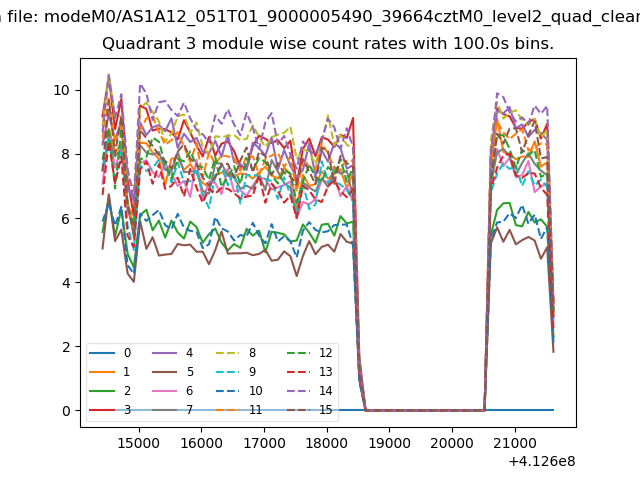
| Module-wise count rates for Quadrant C Data is divided into 100 sec bins |
 |
 |
| Module-wise count rates for Quadrant D Data is divided into 100 sec bins |
 |
 |
| Parameter | Plot |
|---|---|
| CZT HV Monitor | 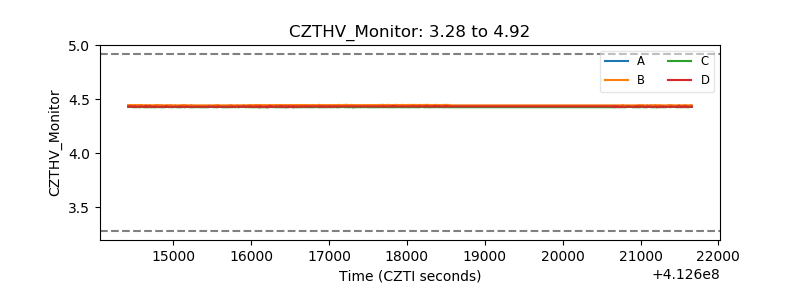 |
| D_VDD | 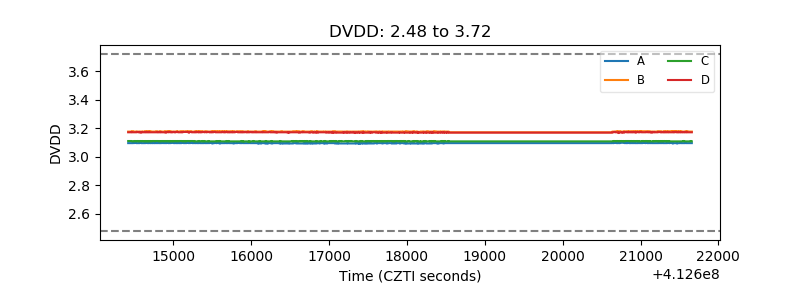 |
| Temperature 1 | 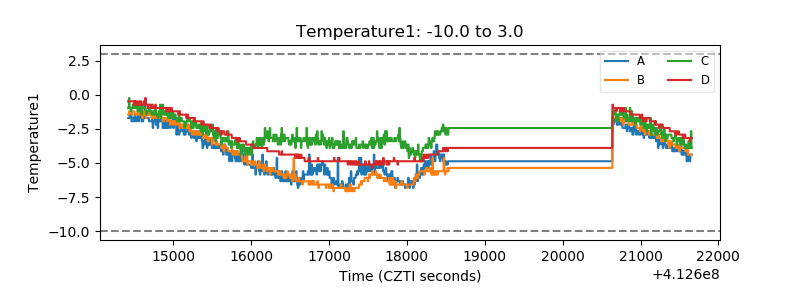 |
| Veto HV Monitor | 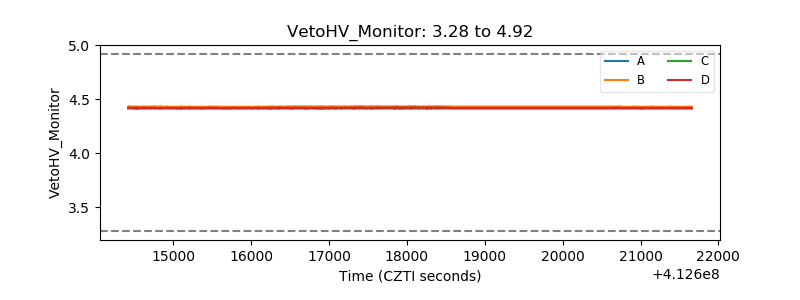 |
| Veto LLD | 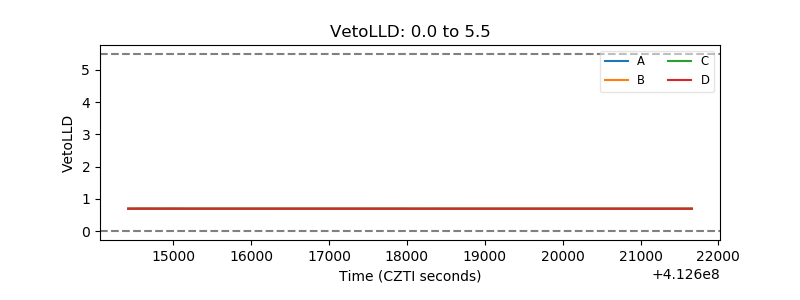 |
| Alpha Counter | 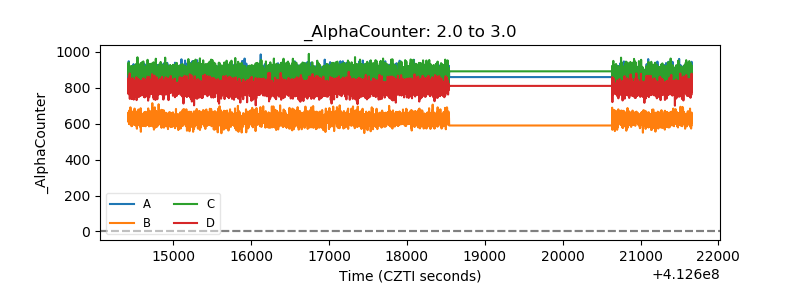 |
| _CPM_Rate | 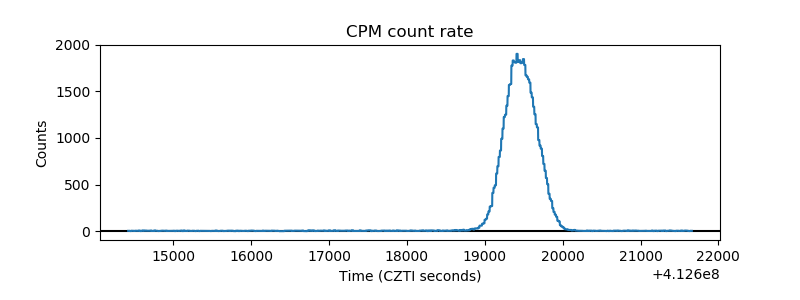 |
| CZT Counter | 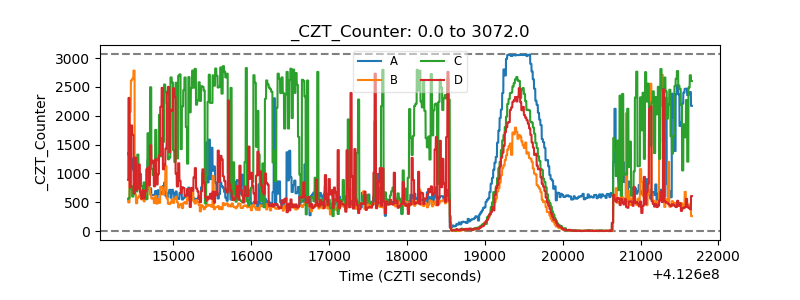 |
| +2.5 Volts monitor | 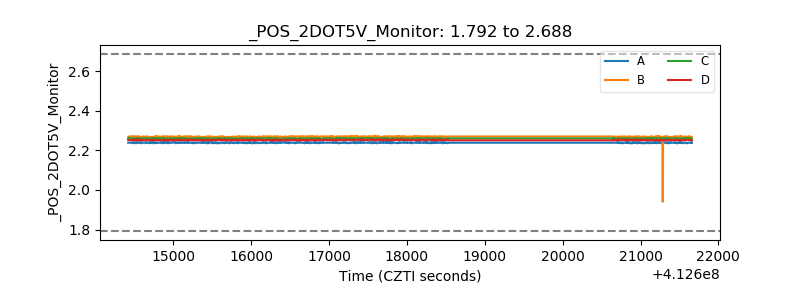 |
| +5 Volts monitor | 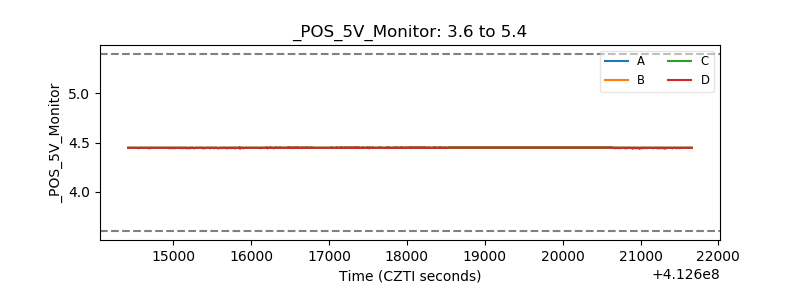 |
| _ROLL_ROT | 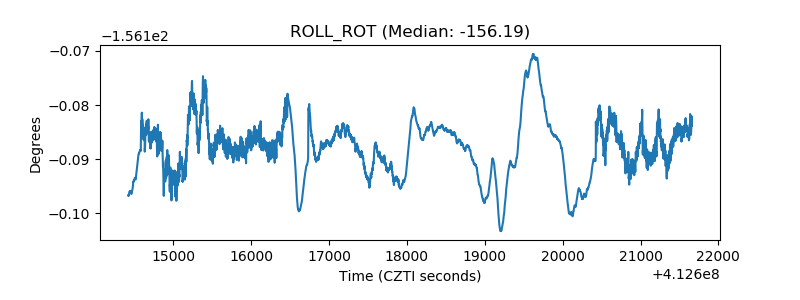 |
| _Roll_DEC |  |
| _Roll_RA | 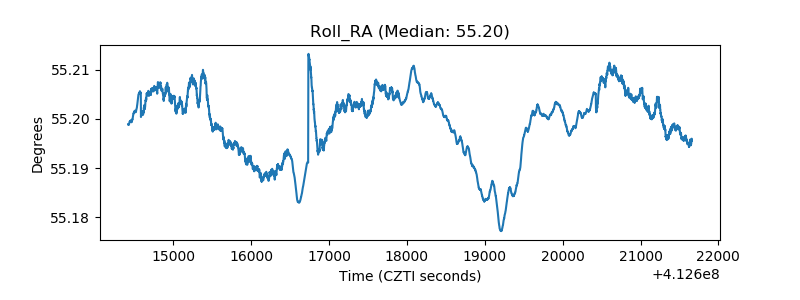 |
| Veto Counter | 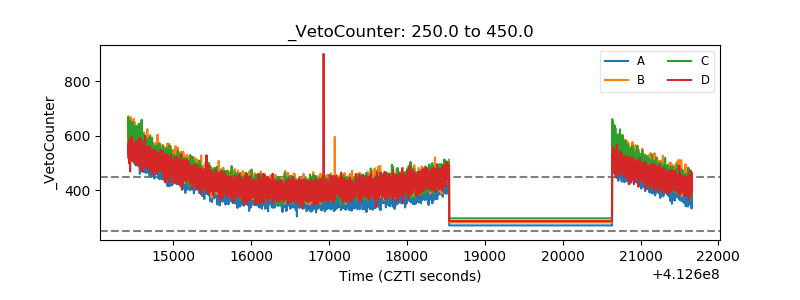 |