| Param | Original file | Final file |
|---|---|---|
| Filename | modeM0/AS1A12_051T01_9000005490_39665cztM0_level2.fits | modeM0/AS1A12_051T01_9000005490_39665cztM0_level2_quad_clean.evt |
| Size (bytes) | 534,651,840 | 78,310,080 |
| Size | 509.9 MB | 74.7 MB |
| Events in quadrant A | 5,188,219 | 510,572 |
| Events in quadrant B | 2,700,527 | 615,813 |
| Events in quadrant C | 7,796,392 | 412,783 |
| Events in quadrant D | 3,721,654 | 484,894 |
| Mode M9 | |||
|---|---|---|---|
| Quadrant | BADHDUFLAG | Total packets | Discarded packets |
| A | 0 | 27 | 0 |
| B | 0 | 27 | 0 |
| C | 0 | 27 | 0 |
| D | 0 | 28 | 0 |
| Mode M0 | |||
|---|---|---|---|
| Quadrant | BADHDUFLAG | Total packets | Discarded packets |
| A | 0 | 18686 | 3 |
| B | 0 | 11282 | 2 |
| C | 0 | 26634 | 2 |
| D | 0 | 14521 | 2 |
| Mode SS | |||
|---|---|---|---|
| Quadrant | BADHDUFLAG | Total packets | Discarded packets |
| A | 0 | 100 | 0 |
| B | 0 | 100 | 0 |
| C | 0 | 100 | 0 |
| D | 0 | 100 | 0 |
| Quadrant | Total seconds | Saturated seconds | Saturation percentage |
|---|---|---|---|
| A | 4950 | 960 | 19.393939% |
| B | 4950 | 110 | 2.222222% |
| C | 4950 | 1707 | 34.484848% |
| D | 4950 | 561 | 11.333333% |
Noise dominated data is calculated using 1-second bins in cleaned event files. If a bin has >2000 counts, and if more than 50% of those come from <1% of pixels, then it is considered to be noise-dominated and hence unusable.
| Quadrant | # 1 sec bins | Bins with >0 counts | Bins with >2000 counts | High rate bins dominated by noise | Noise dominated (total time) | Noise dominated (detector-on time) | Marked lightcurve |
|---|---|---|---|---|---|---|---|
| A | 7073 | 4951 | 1046 | 1046 | 14.79% | 21.13% | 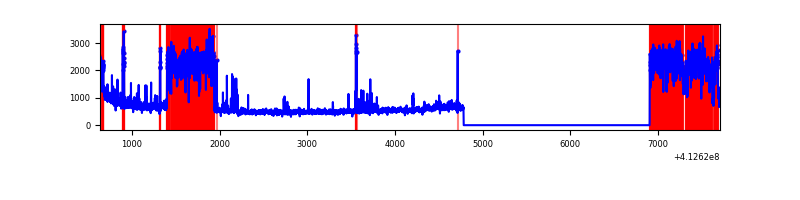 |
| B | 7073 | 4951 | 69 | 69 | 0.98% | 1.39% | 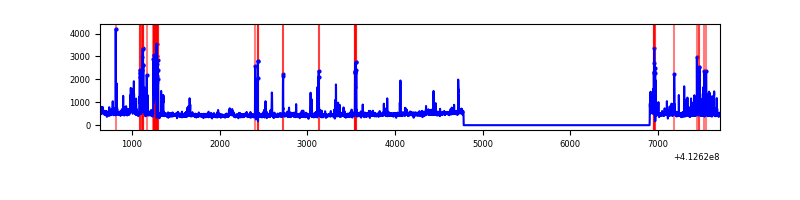 |
| C | 7073 | 4951 | 1466 | 1466 | 20.73% | 29.61% | 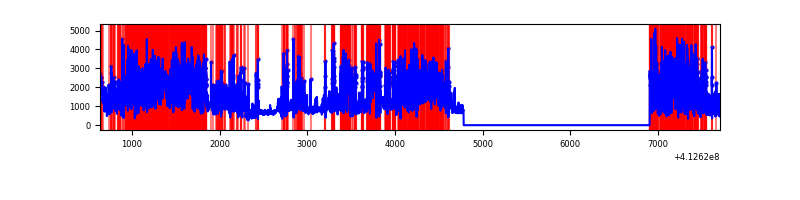 |
| D | 7073 | 4951 | 581 | 581 | 8.21% | 11.74% | 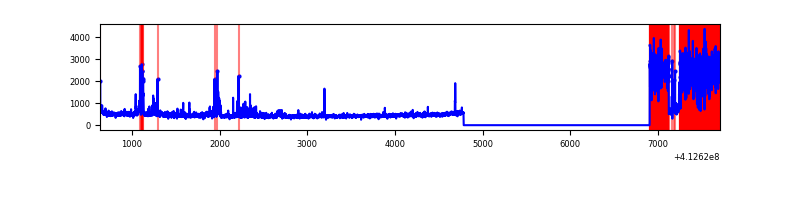 |
Top three noisy pixels from each quadrant. If the there are fewer than three noisy pixels in the level2.evt file, extra rows are filled as -1
| Pixel properties | Quadrant properties | ||||||
|---|---|---|---|---|---|---|---|
| Quadrant | DetID | PixID | Counts | Sigma | Mean | Median | Sigma |
| A | 15 | 222 | 2481144 | 22467.16 | 542 | 533 | 110.4 |
| A | 10 | 83 | 428757 | 3878.47 | 542 | 533 | 110.4 |
| A | 15 | 174 | 85707 | 771.43 | 542 | 533 | 110.4 |
| B | 5 | 172 | 303412 | 2845.91 | 559 | 545 | 106.4 |
| B | 5 | 255 | 148632 | 1391.51 | 559 | 545 | 106.4 |
| B | 0 | 186 | 28102 | 258.94 | 559 | 545 | 106.4 |
| C | 15 | 208 | 5171372 | 47092.58 | 472 | 476 | 109.8 |
| C | 9 | 187 | 473417 | 4307.19 | 472 | 476 | 109.8 |
| C | 15 | 214 | 194946 | 1771.08 | 472 | 476 | 109.8 |
| D | 13 | 174 | 1276538 | 9929.63 | 522 | 507 | 128.5 |
| D | 12 | 233 | 151706 | 1176.58 | 522 | 507 | 128.5 |
| D | 12 | 227 | 92366 | 714.81 | 522 | 507 | 128.5 |
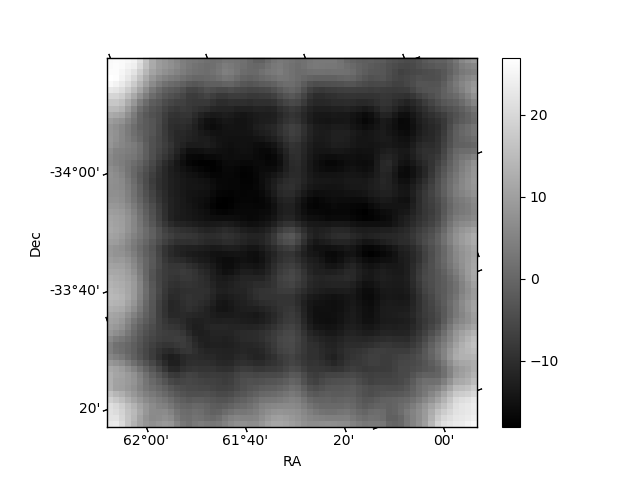
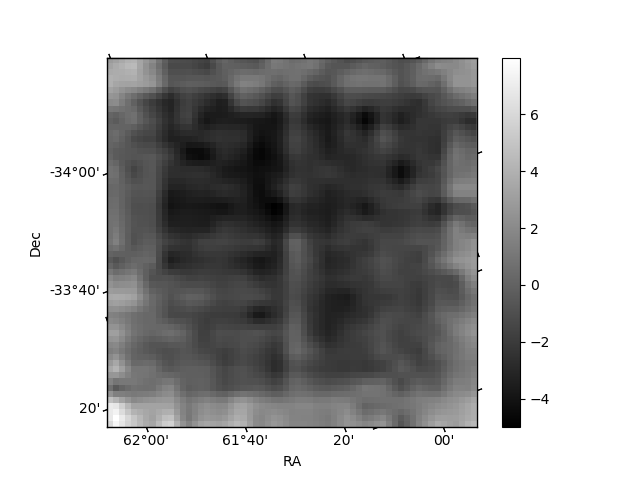
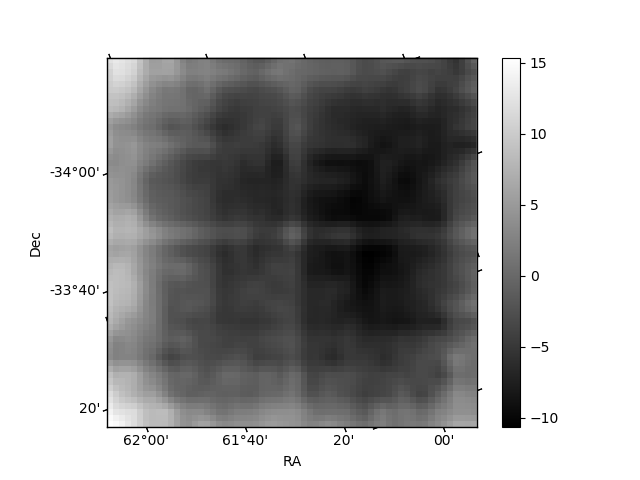
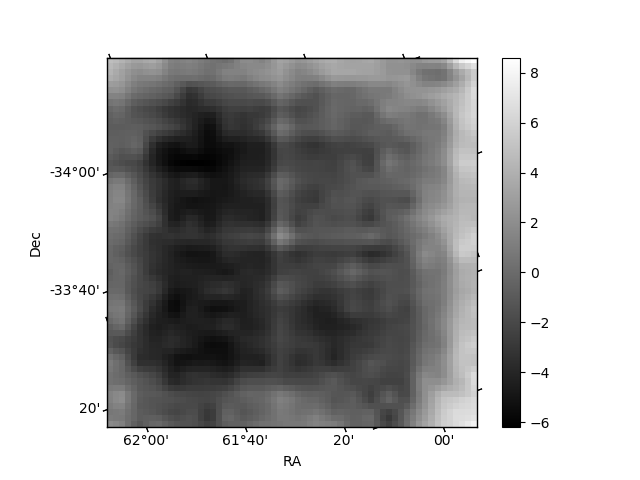
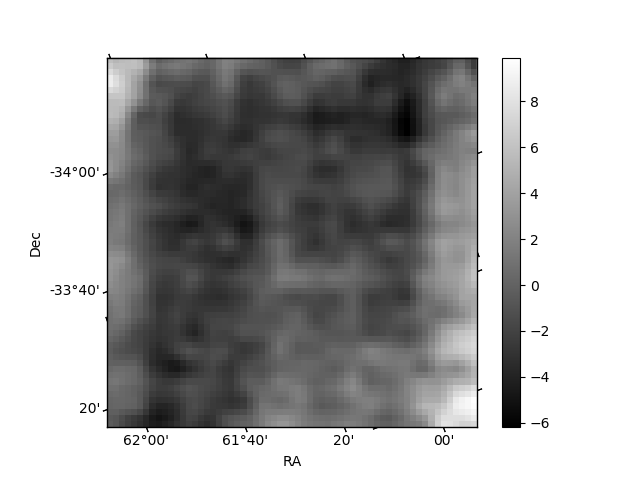
Histogram calculated using DETX and DETY for each event in the final _common_clean file
| Quadrant A | 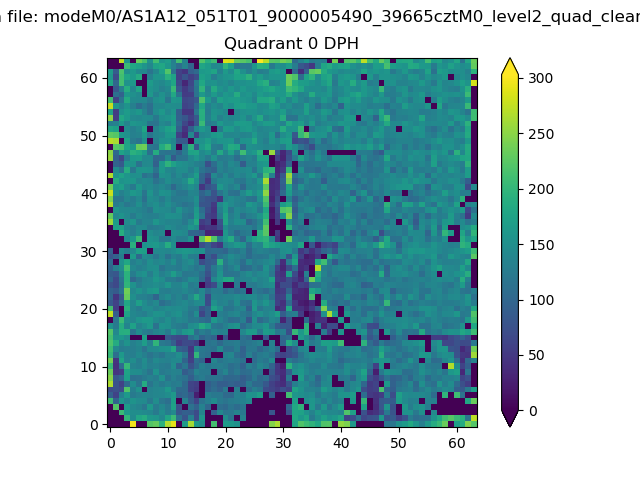 |
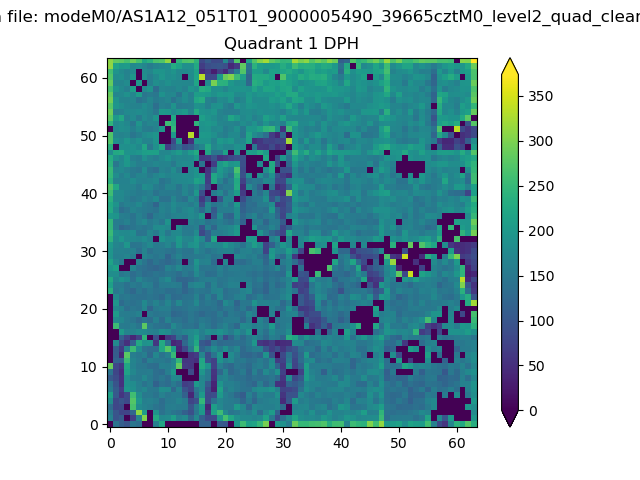 |
Quadrant B |
|---|---|---|---|
| Quadrant D |  |
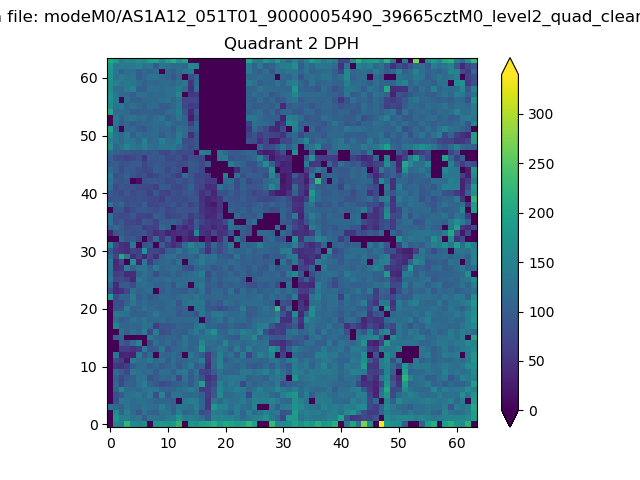 |
Quadrant C |
| Plot type | Count rate plots | Images |
|---|---|---|
| Comparison with Poisson distribution Blue bars denote a histogram of data divided into 1 sec bins. Red curve is a Poisson curve with rate = median count rate of data. |
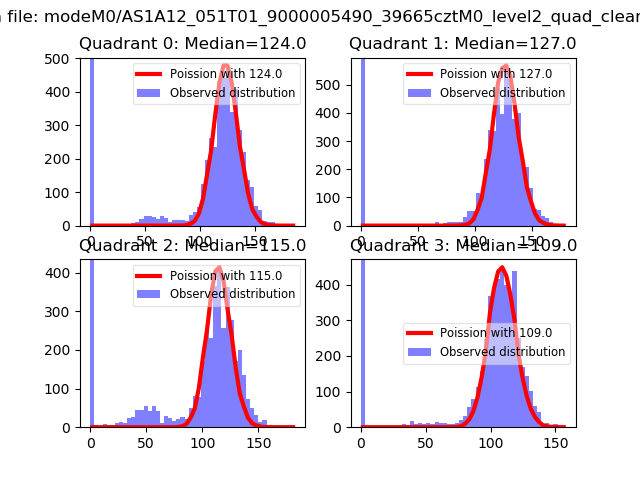 |
 |
| Quadrant-wise count rates Data is divided into 100 sec bins |
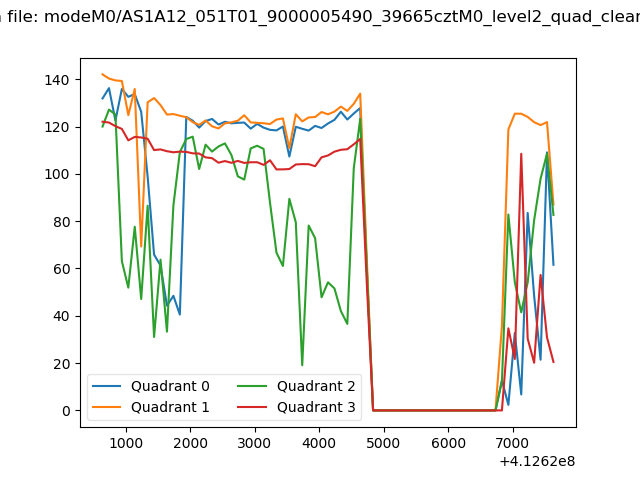 |
|
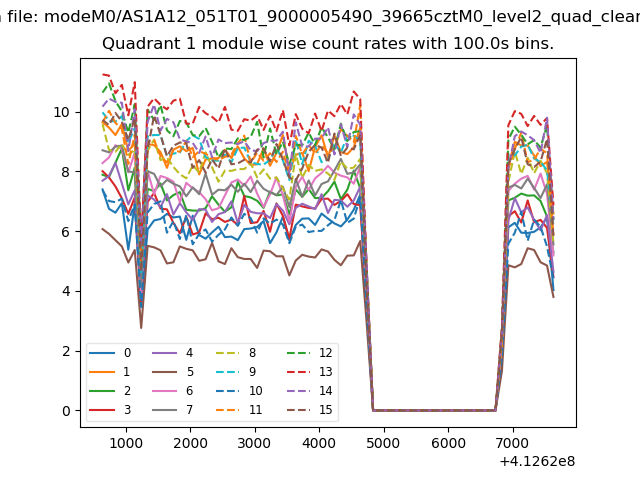
| Module-wise count rates for Quadrant A Data is divided into 100 sec bins |
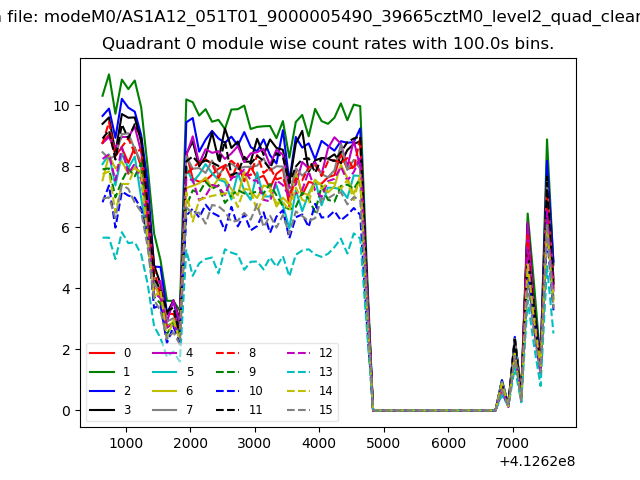 |
 |
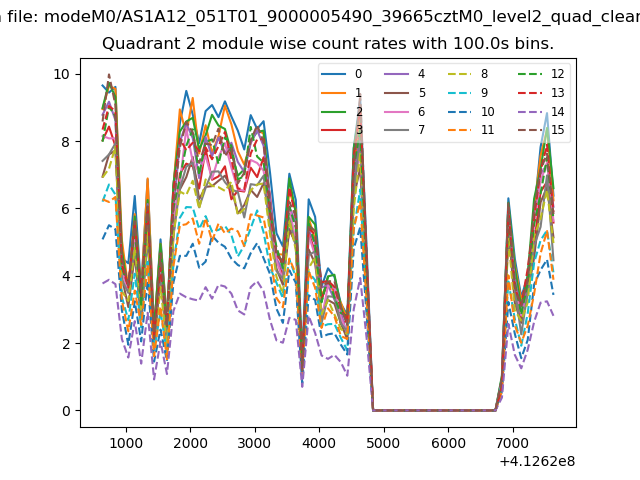
| Module-wise count rates for Quadrant B Data is divided into 100 sec bins |
 |
 |
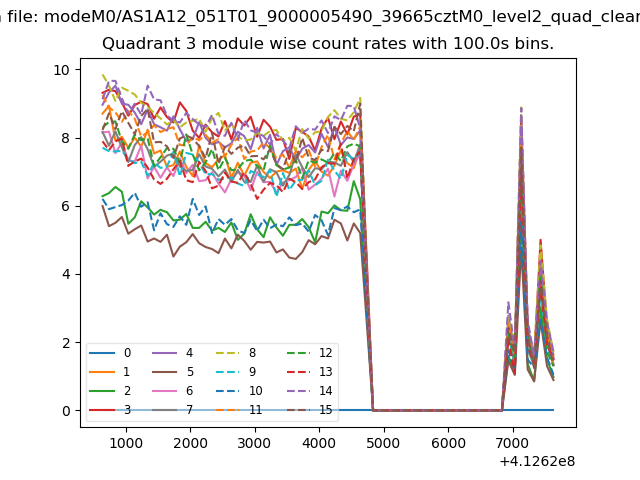
| Module-wise count rates for Quadrant C Data is divided into 100 sec bins |
 |
 |
| Module-wise count rates for Quadrant D Data is divided into 100 sec bins |
 |
 |
| Parameter | Plot |
|---|---|
| CZT HV Monitor | 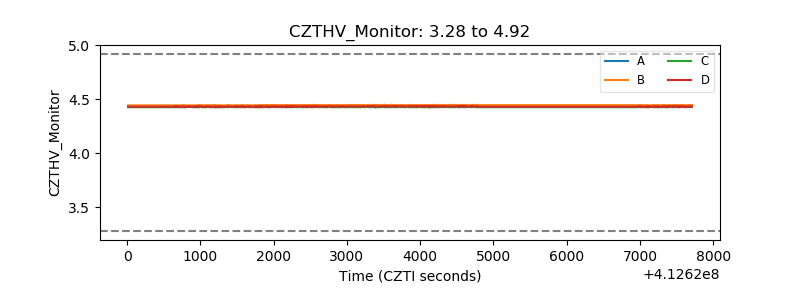 |
| D_VDD | 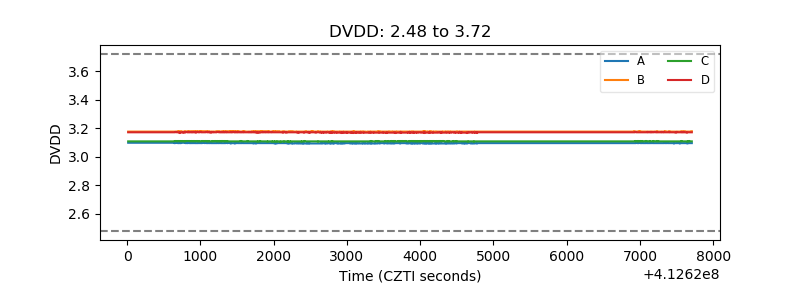 |
| Temperature 1 | 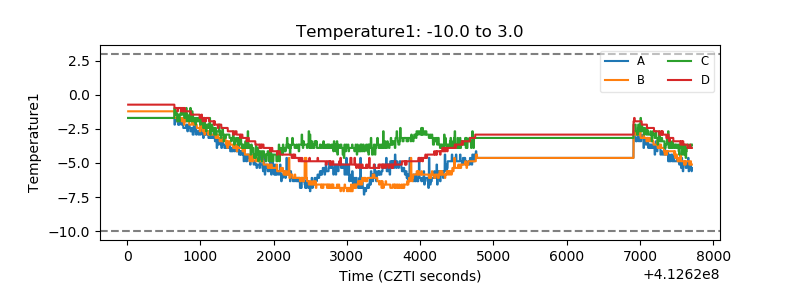 |
| Veto HV Monitor | 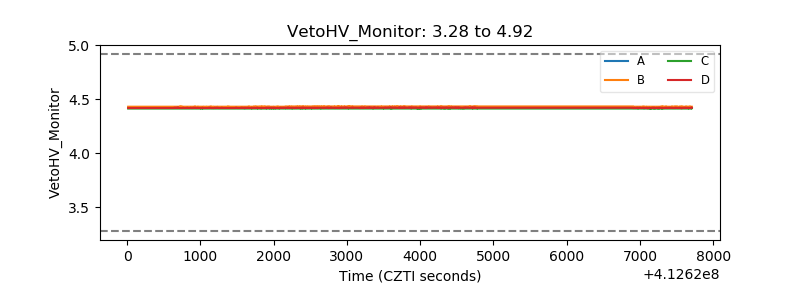 |
| Veto LLD | 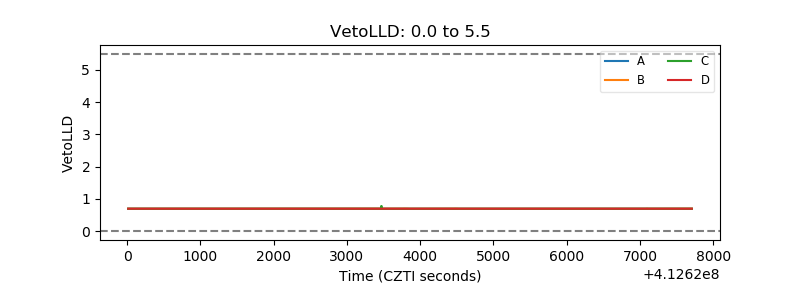 |
| Alpha Counter | 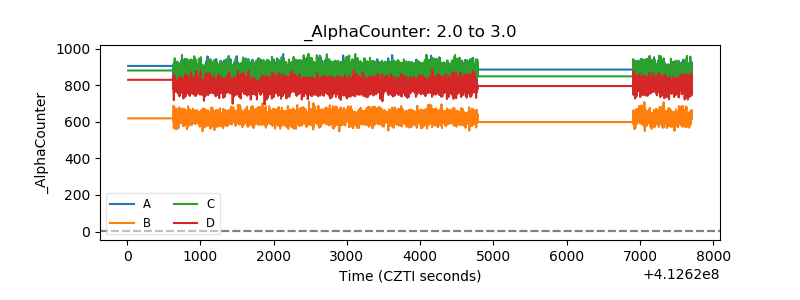 |
| _CPM_Rate | 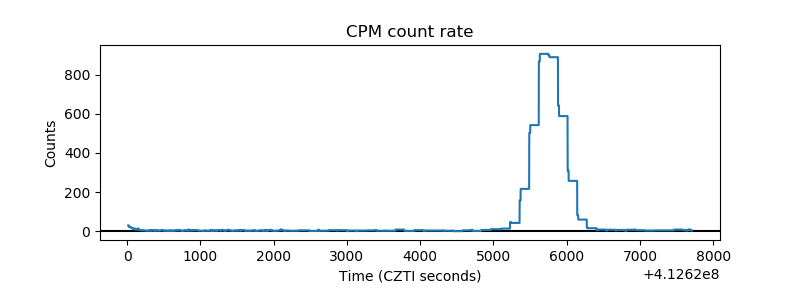 |
| CZT Counter | 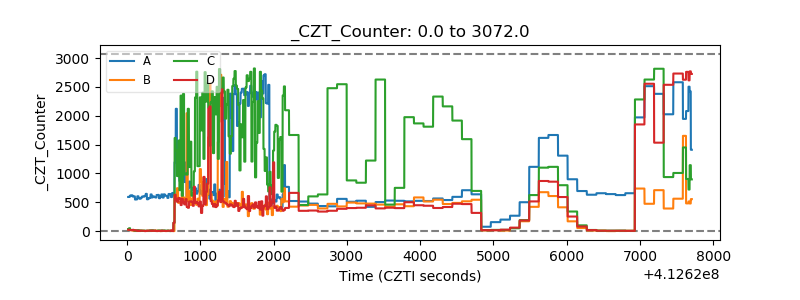 |
| +2.5 Volts monitor | 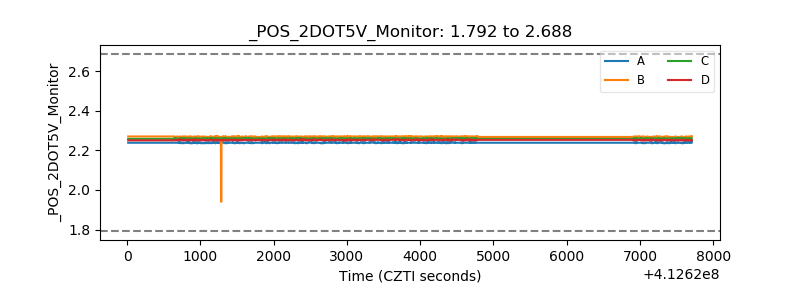 |
| +5 Volts monitor | 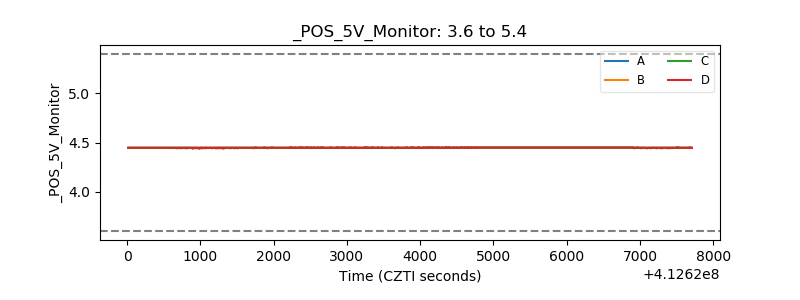 |
| _ROLL_ROT | 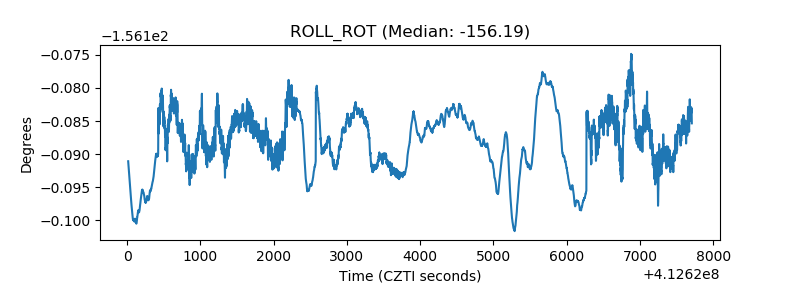 |
| _Roll_DEC | 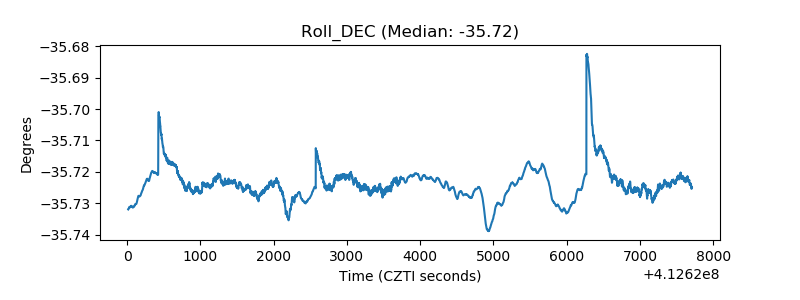 |
| _Roll_RA | 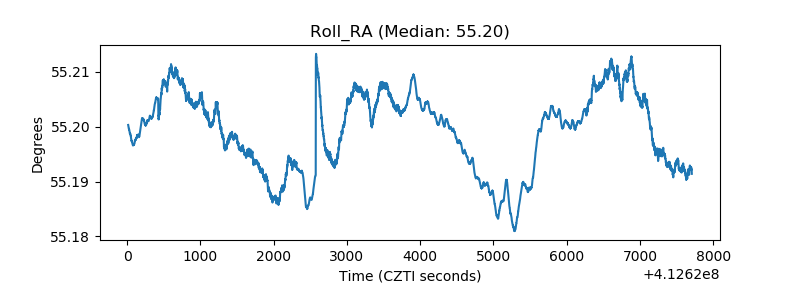 |
| Veto Counter | 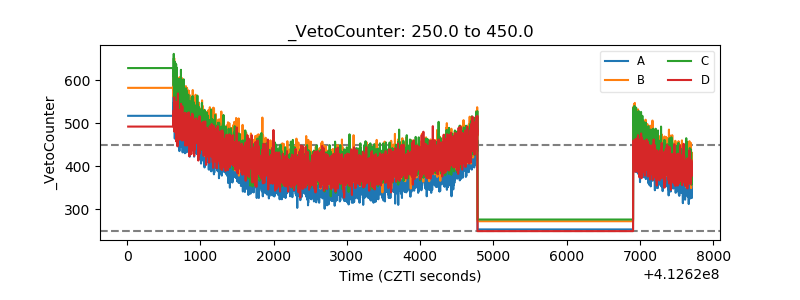 |