| Param | Original file | Final file |
|---|---|---|
| Filename | modeM0/AS1A12_051T01_9000005490_39667cztM0_level2.fits | modeM0/AS1A12_051T01_9000005490_39667cztM0_level2_quad_clean.evt |
| Size (bytes) | 437,356,800 | 84,510,720 |
| Size | 417.1 MB | 80.6 MB |
| Events in quadrant A | 4,639,393 | 576,688 |
| Events in quadrant B | 2,690,384 | 601,751 |
| Events in quadrant C | 4,644,883 | 517,018 |
| Events in quadrant D | 3,804,544 | 493,490 |
| Mode M9 | |||
|---|---|---|---|
| Quadrant | BADHDUFLAG | Total packets | Discarded packets |
| A | 0 | 22 | 0 |
| B | 0 | 22 | 0 |
| C | 0 | 22 | 0 |
| D | 0 | 23 | 0 |
| Mode M0 | |||
|---|---|---|---|
| Quadrant | BADHDUFLAG | Total packets | Discarded packets |
| A | 0 | 17489 | 3 |
| B | 0 | 11661 | 2 |
| C | 0 | 17195 | 2 |
| D | 0 | 15008 | 2 |
| Mode SS | |||
|---|---|---|---|
| Quadrant | BADHDUFLAG | Total packets | Discarded packets |
| A | 0 | 108 | 0 |
| B | 0 | 108 | 0 |
| C | 0 | 108 | 0 |
| D | 0 | 108 | 0 |
| Quadrant | Total seconds | Saturated seconds | Saturation percentage |
|---|---|---|---|
| A | 5281 | 216 | 4.090134% |
| B | 5281 | 85 | 1.609544% |
| C | 5281 | 667 | 12.630184% |
| D | 5281 | 392 | 7.422837% |
Noise dominated data is calculated using 1-second bins in cleaned event files. If a bin has >2000 counts, and if more than 50% of those come from <1% of pixels, then it is considered to be noise-dominated and hence unusable.
| Quadrant | # 1 sec bins | Bins with >0 counts | Bins with >2000 counts | High rate bins dominated by noise | Noise dominated (total time) | Noise dominated (detector-on time) | Marked lightcurve |
|---|---|---|---|---|---|---|---|
| A | 7074 | 5282 | 185 | 185 | 2.62% | 3.50% |  |
| B | 7074 | 5282 | 54 | 54 | 0.76% | 1.02% |  |
| C | 7074 | 5282 | 591 | 591 | 8.35% | 11.19% | 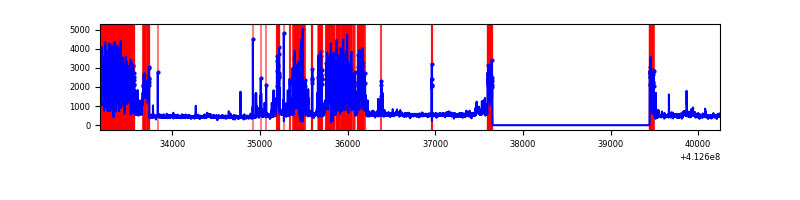 |
| D | 7074 | 5282 | 361 | 361 | 5.10% | 6.83% |  |
Top three noisy pixels from each quadrant. If the there are fewer than three noisy pixels in the level2.evt file, extra rows are filled as -1
| Pixel properties | Quadrant properties | ||||||
|---|---|---|---|---|---|---|---|
| Quadrant | DetID | PixID | Counts | Sigma | Mean | Median | Sigma |
| A | 15 | 222 | 1399604 | 12044.28 | 565 | 554 | 116.2 |
| A | 15 | 174 | 600864 | 5168.01 | 565 | 554 | 116.2 |
| A | 10 | 83 | 440589 | 3788.22 | 565 | 554 | 116.2 |
| B | 5 | 172 | 285082 | 2544.74 | 575 | 558 | 111.8 |
| B | 5 | 255 | 75507 | 670.33 | 575 | 558 | 111.8 |
| B | 15 | 32 | 28776 | 252.38 | 575 | 558 | 111.8 |
| C | 15 | 208 | 1970526 | 15549.66 | 538 | 541 | 126.7 |
| C | 9 | 187 | 272433 | 2146.12 | 538 | 541 | 126.7 |
| C | 15 | 214 | 226328 | 1782.2 | 538 | 541 | 126.7 |
| D | 12 | 233 | 691882 | 5142.62 | 543 | 527 | 134.4 |
| D | 13 | 174 | 530056 | 3938.89 | 543 | 527 | 134.4 |
| D | 13 | 249 | 183347 | 1359.9 | 543 | 527 | 134.4 |
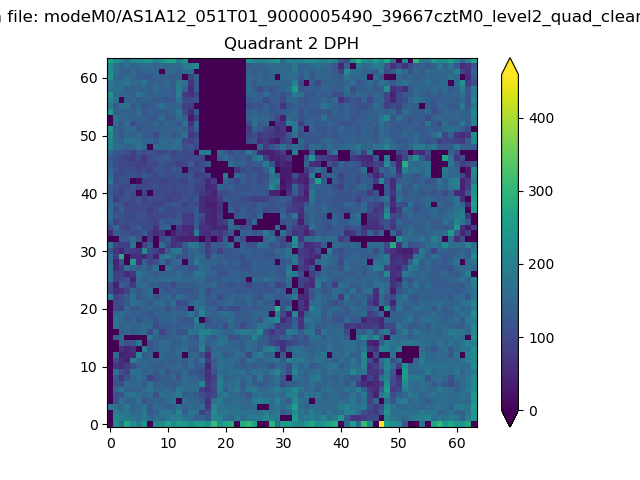
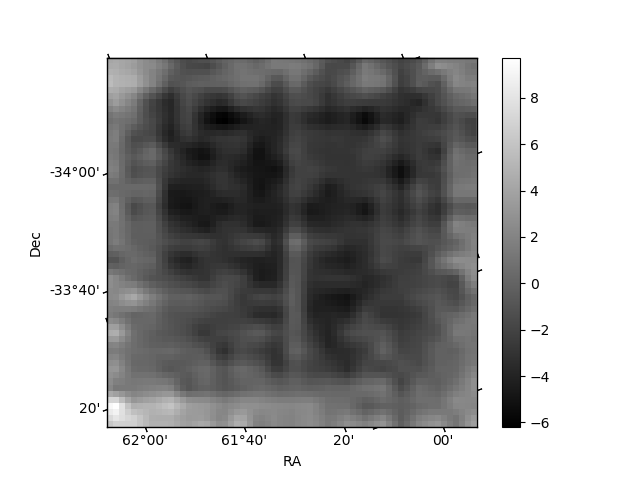
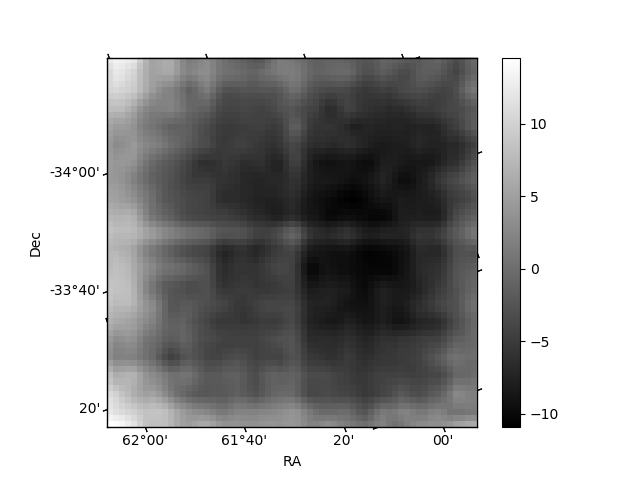
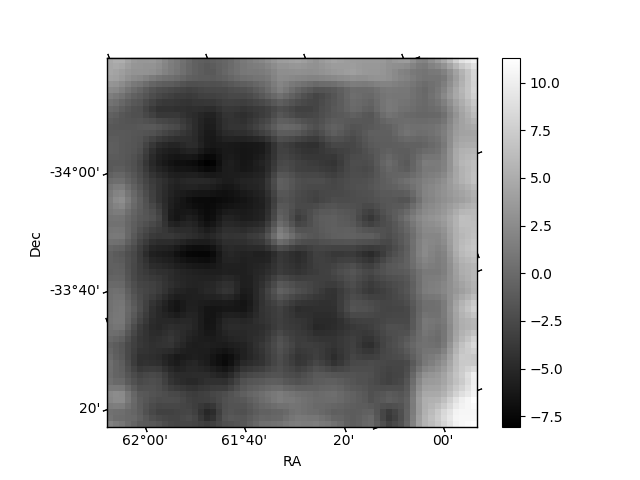
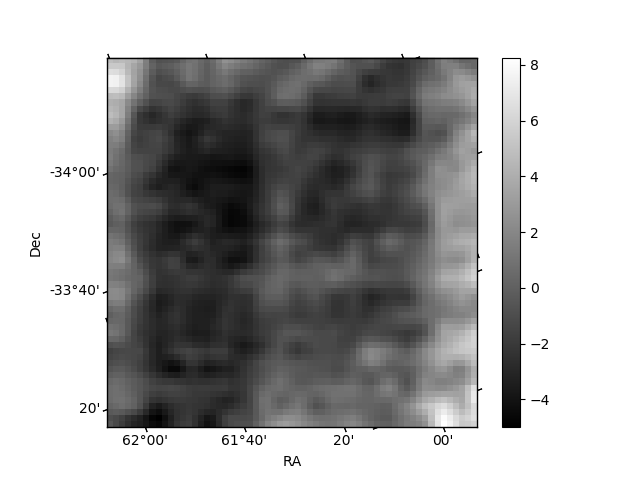
Histogram calculated using DETX and DETY for each event in the final _common_clean file
| Quadrant A | 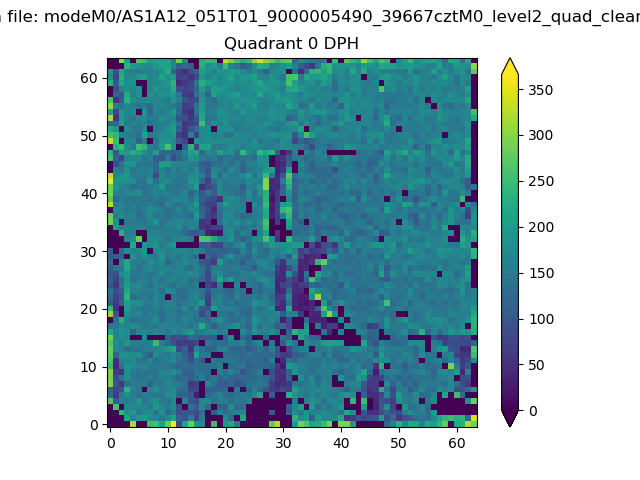 |
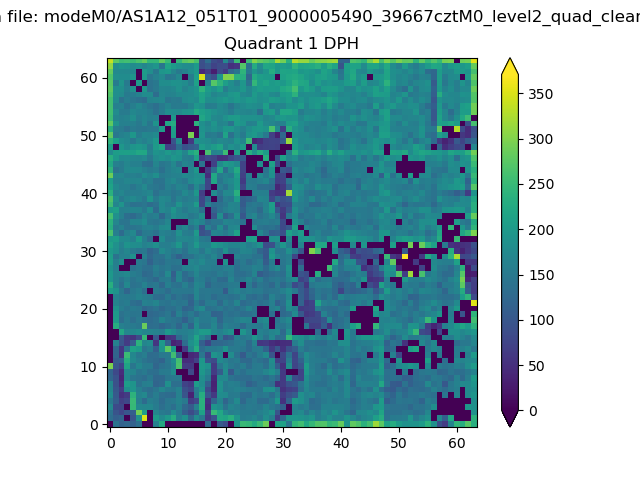 |
Quadrant B |
|---|---|---|---|
| Quadrant D | 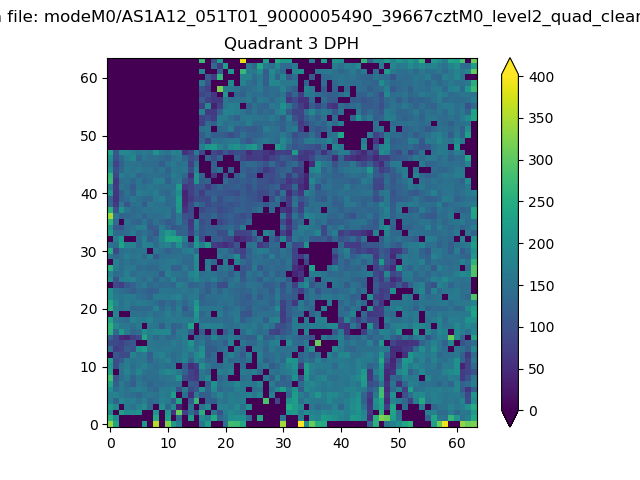 |
 |
Quadrant C |
| Plot type | Count rate plots | Images |
|---|---|---|
| Comparison with Poisson distribution Blue bars denote a histogram of data divided into 1 sec bins. Red curve is a Poisson curve with rate = median count rate of data. |
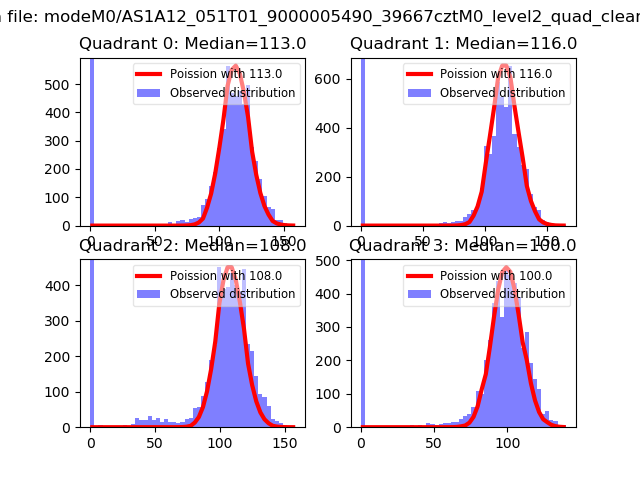 |
 |
| Quadrant-wise count rates Data is divided into 100 sec bins |
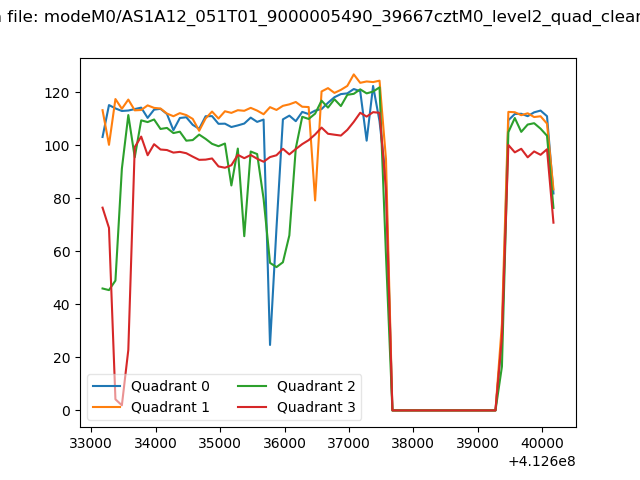 |
|
| Module-wise count rates for Quadrant A Data is divided into 100 sec bins |
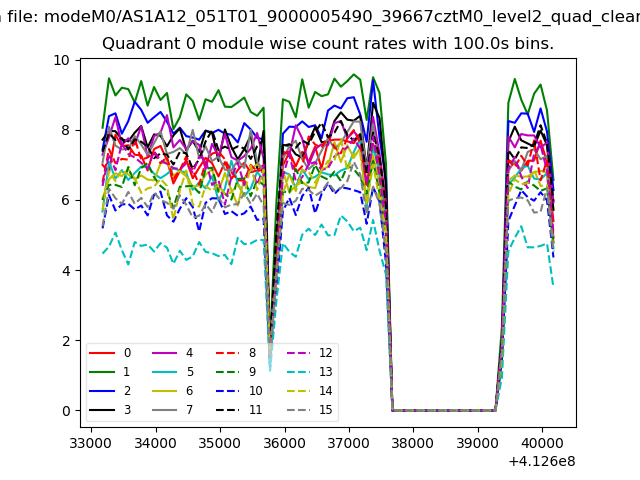 |
 |
| Module-wise count rates for Quadrant B Data is divided into 100 sec bins |
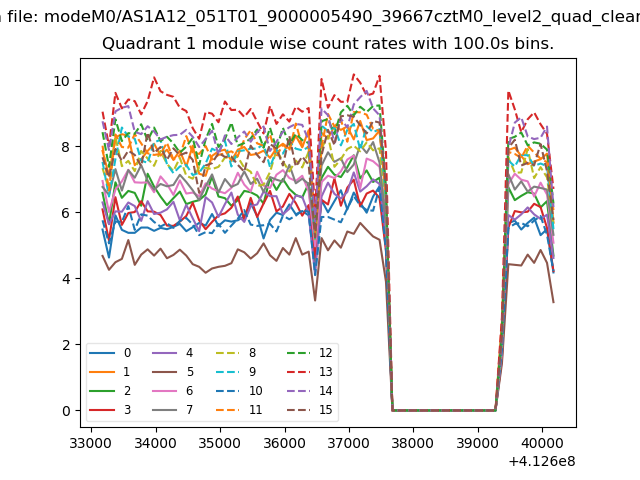 |
 |
| Module-wise count rates for Quadrant C Data is divided into 100 sec bins |
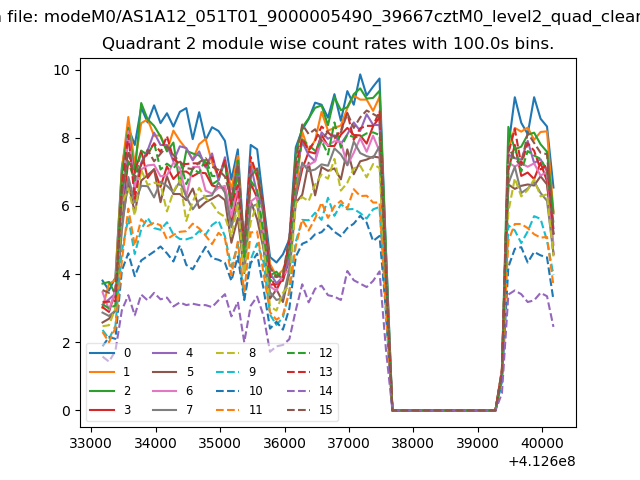 |
 |
| Module-wise count rates for Quadrant D Data is divided into 100 sec bins |
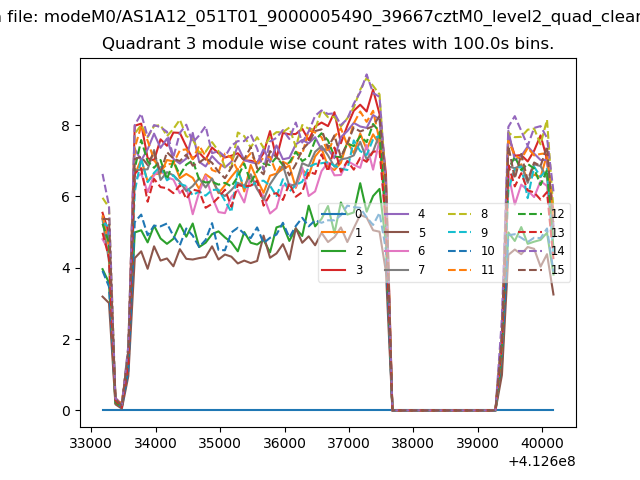 |
 |
| Parameter | Plot |
|---|---|
| CZT HV Monitor |  |
| D_VDD | 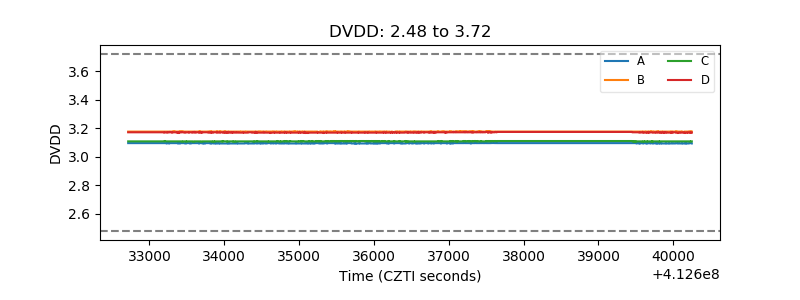 |
| Temperature 1 | 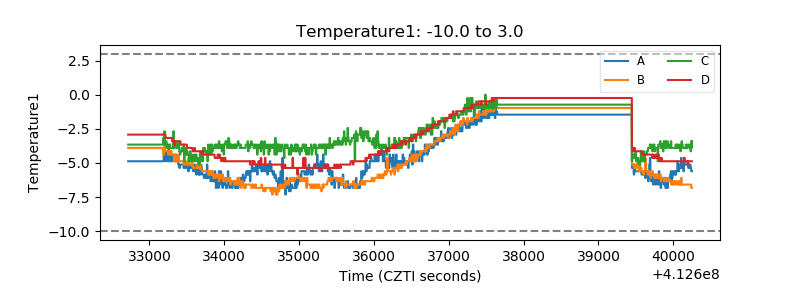 |
| Veto HV Monitor | 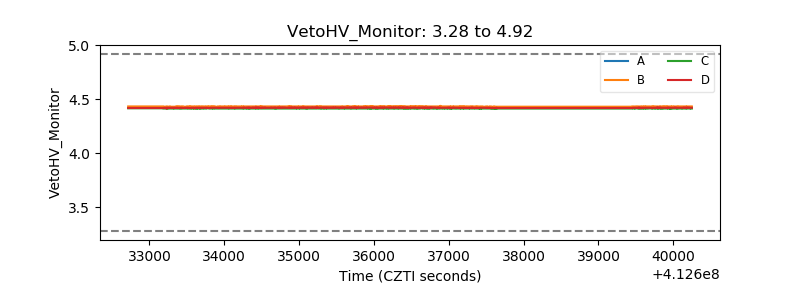 |
| Veto LLD | 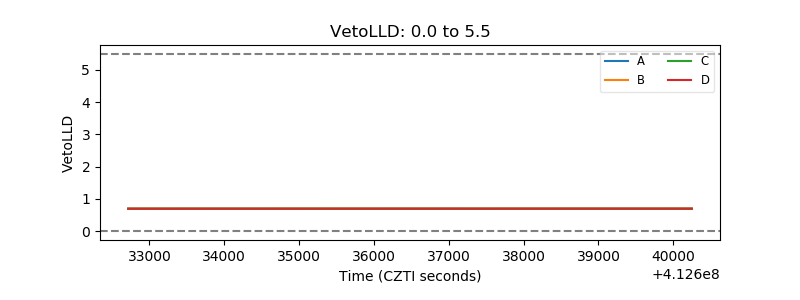 |
| Alpha Counter | 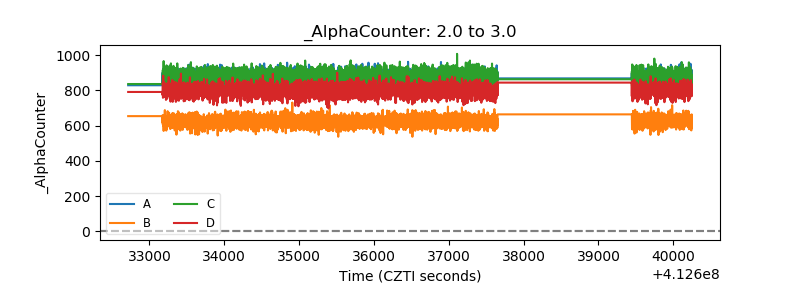 |
| _CPM_Rate | 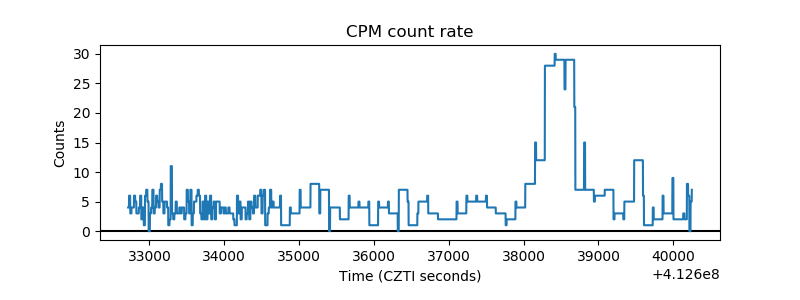 |
| CZT Counter | 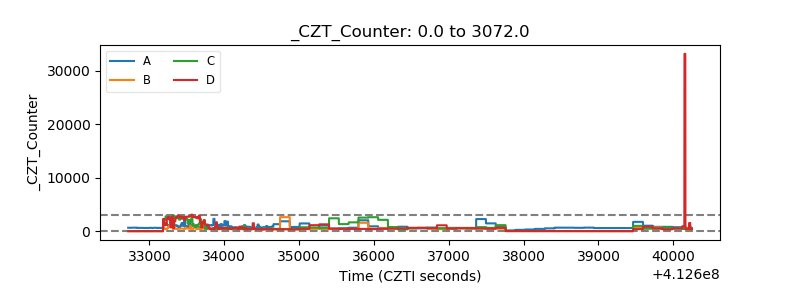 |
| +2.5 Volts monitor | 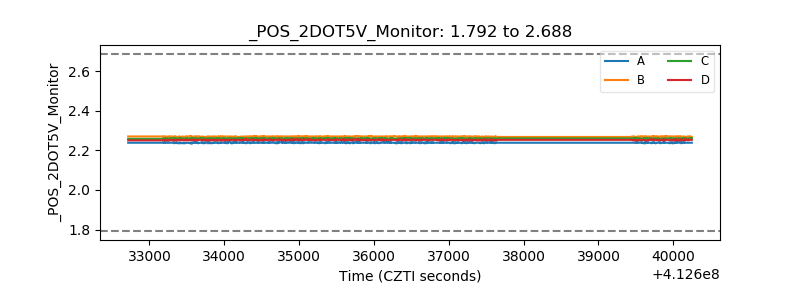 |
| +5 Volts monitor | 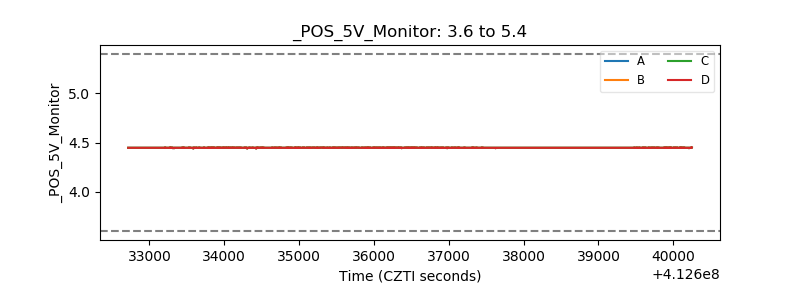 |
| _ROLL_ROT | 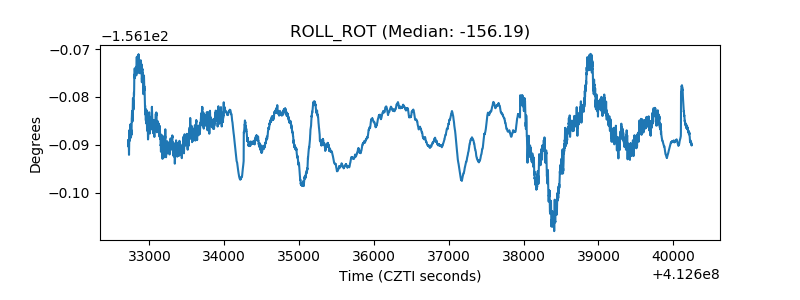 |
| _Roll_DEC | 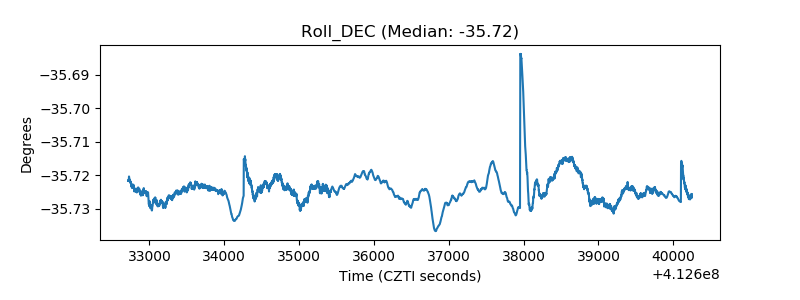 |
| _Roll_RA | 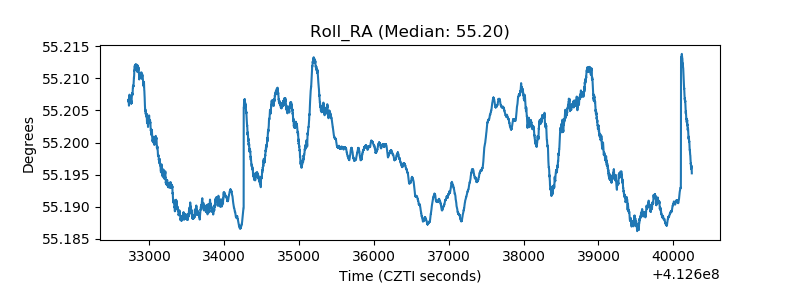 |
| Veto Counter | 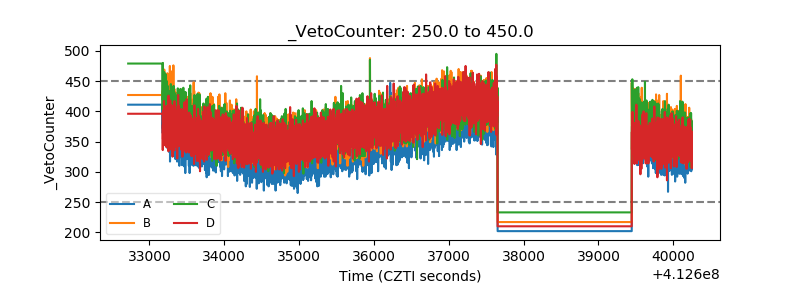 |