| Param | Original file | Final file |
|---|---|---|
| Filename | modeM0/AS1A12_051T01_9000005490_39668cztM0_level2.fits | modeM0/AS1A12_051T01_9000005490_39668cztM0_level2_quad_clean.evt |
| Size (bytes) | 490,881,600 | 91,304,640 |
| Size | 468.1 MB | 87.1 MB |
| Events in quadrant A | 5,153,676 | 599,379 |
| Events in quadrant B | 3,173,488 | 649,032 |
| Events in quadrant C | 5,620,464 | 569,953 |
| Events in quadrant D | 3,769,484 | 538,080 |
| Mode M9 | |||
|---|---|---|---|
| Quadrant | BADHDUFLAG | Total packets | Discarded packets |
| A | 0 | 27 | 0 |
| B | 0 | 27 | 0 |
| C | 0 | 27 | 0 |
| D | 0 | 28 | 0 |
| Mode M0 | |||
|---|---|---|---|
| Quadrant | BADHDUFLAG | Total packets | Discarded packets |
| A | 0 | 19461 | 3 |
| B | 0 | 13473 | 2 |
| C | 0 | 20648 | 2 |
| D | 0 | 15405 | 2 |
| Mode SS | |||
|---|---|---|---|
| Quadrant | BADHDUFLAG | Total packets | Discarded packets |
| A | 0 | 118 | 0 |
| B | 0 | 118 | 0 |
| C | 0 | 118 | 0 |
| D | 0 | 118 | 0 |
| Quadrant | Total seconds | Saturated seconds | Saturation percentage |
|---|---|---|---|
| A | 5844 | 550 | 9.411362% |
| B | 5844 | 130 | 2.224504% |
| C | 5844 | 650 | 11.122519% |
| D | 5844 | 407 | 6.964408% |
Noise dominated data is calculated using 1-second bins in cleaned event files. If a bin has >2000 counts, and if more than 50% of those come from <1% of pixels, then it is considered to be noise-dominated and hence unusable.
| Quadrant | # 1 sec bins | Bins with >0 counts | Bins with >2000 counts | High rate bins dominated by noise | Noise dominated (total time) | Noise dominated (detector-on time) | Marked lightcurve |
|---|---|---|---|---|---|---|---|
| A | 7307 | 5845 | 322 | 322 | 4.41% | 5.51% | 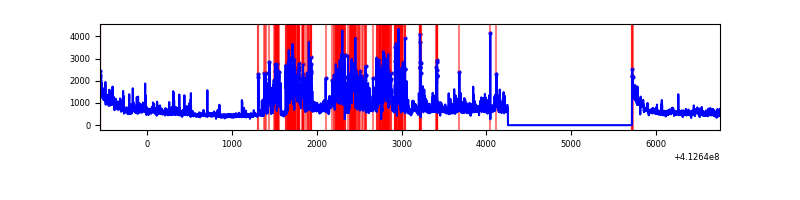 |
| B | 7307 | 5845 | 85 | 85 | 1.16% | 1.45% | 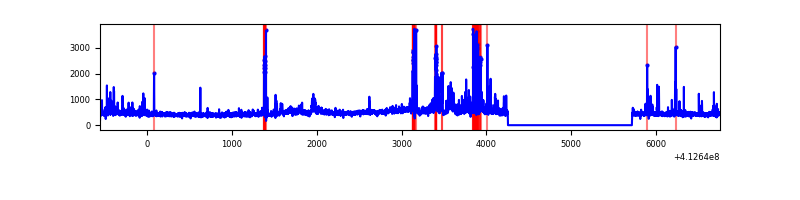 |
| C | 7307 | 5845 | 577 | 577 | 7.90% | 9.87% | 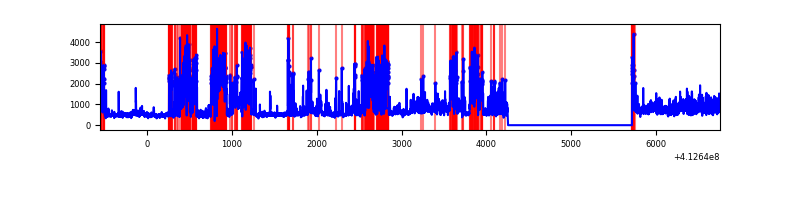 |
| D | 7307 | 5845 | 387 | 387 | 5.30% | 6.62% | 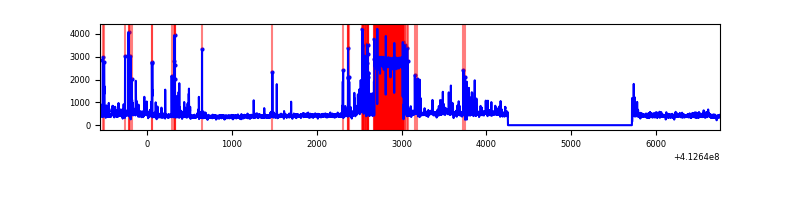 |
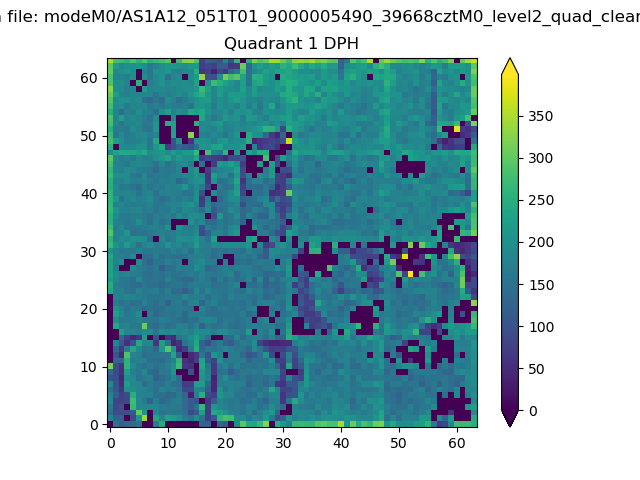
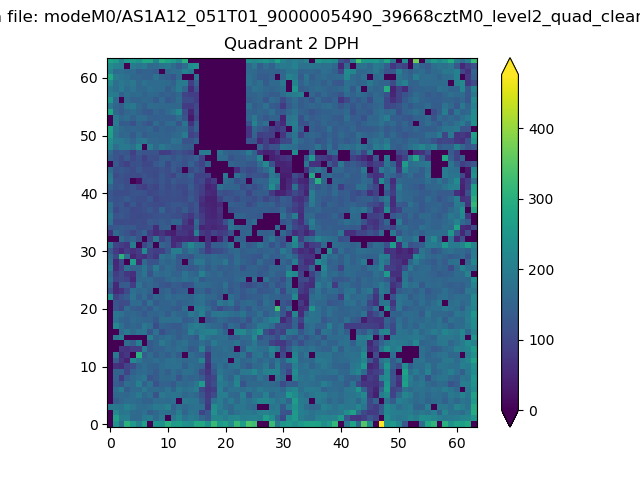
Top three noisy pixels from each quadrant. If the there are fewer than three noisy pixels in the level2.evt file, extra rows are filled as -1
| Pixel properties | Quadrant properties | ||||||
|---|---|---|---|---|---|---|---|
| Quadrant | DetID | PixID | Counts | Sigma | Mean | Median | Sigma |
| A | 15 | 174 | 1509811 | 11894.04 | 620 | 608 | 126.9 |
| A | 15 | 222 | 602323 | 4742.12 | 620 | 608 | 126.9 |
| A | 10 | 83 | 471851 | 3713.87 | 620 | 608 | 126.9 |
| B | 5 | 172 | 440325 | 3603.28 | 630 | 611 | 122.0 |
| B | 5 | 255 | 128419 | 1047.34 | 630 | 611 | 122.0 |
| B | 4 | 170 | 61949 | 502.64 | 630 | 611 | 122.0 |
| C | 15 | 208 | 2701452 | 19197.05 | 600 | 603 | 140.7 |
| C | 15 | 214 | 250457 | 1775.9 | 600 | 603 | 140.7 |
| C | 9 | 187 | 242405 | 1718.67 | 600 | 603 | 140.7 |
| D | 12 | 227 | 1098623 | 7680.28 | 586 | 570 | 143.0 |
| D | 13 | 249 | 256220 | 1788.13 | 586 | 570 | 143.0 |
| D | 13 | 174 | 49636 | 343.19 | 586 | 570 | 143.0 |
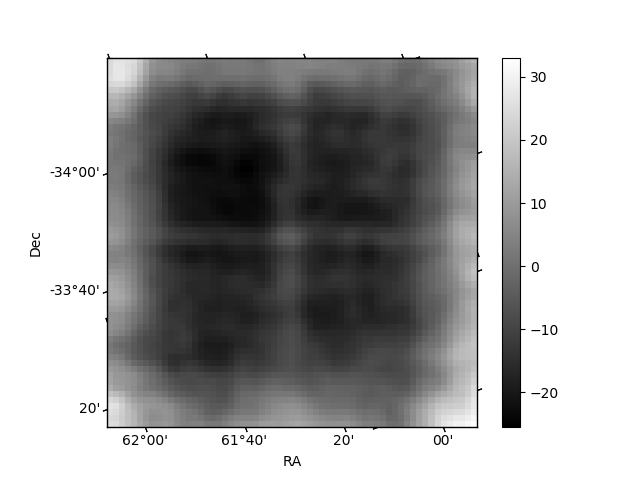
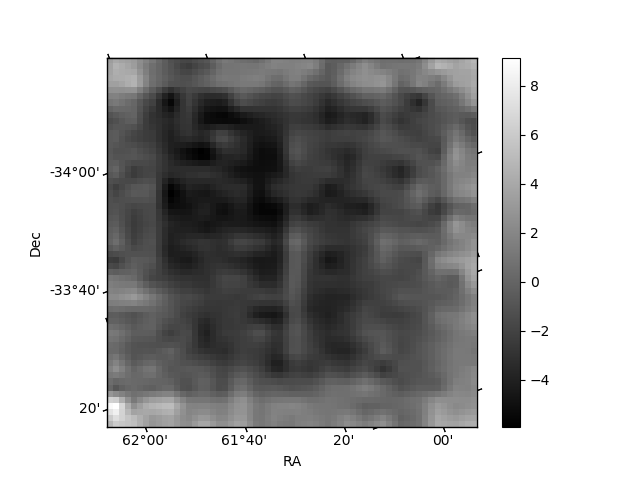
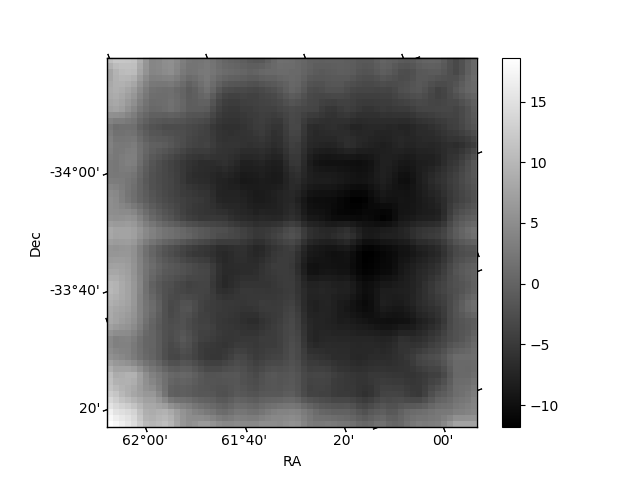
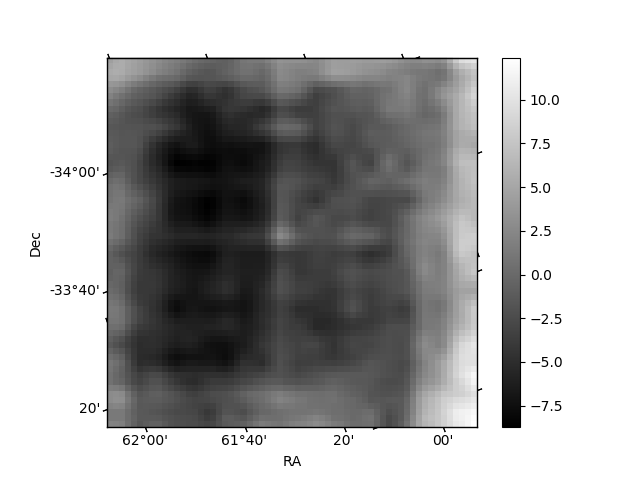
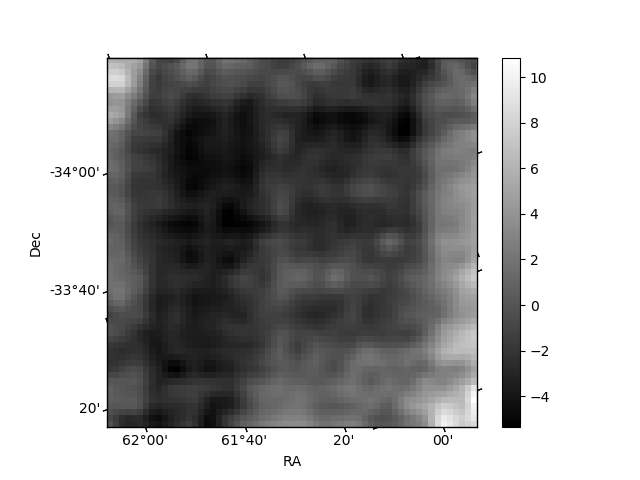
Histogram calculated using DETX and DETY for each event in the final _common_clean file
| Quadrant A | 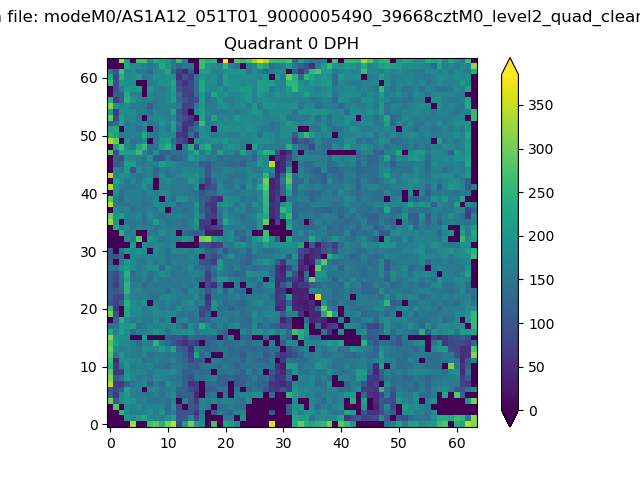 |
 |
Quadrant B |
|---|---|---|---|
| Quadrant D | 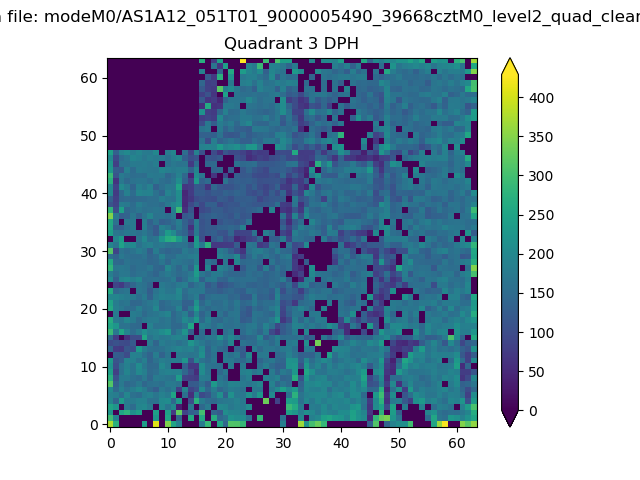 |
 |
Quadrant C |
| Plot type | Count rate plots | Images |
|---|---|---|
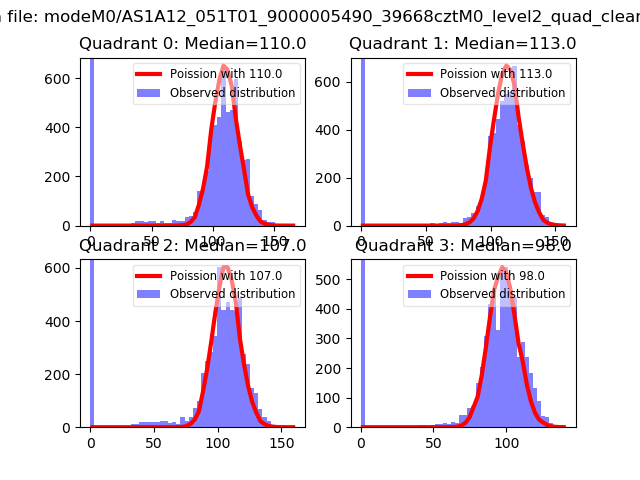
| Comparison with Poisson distribution Blue bars denote a histogram of data divided into 1 sec bins. Red curve is a Poisson curve with rate = median count rate of data. |
 |
 |
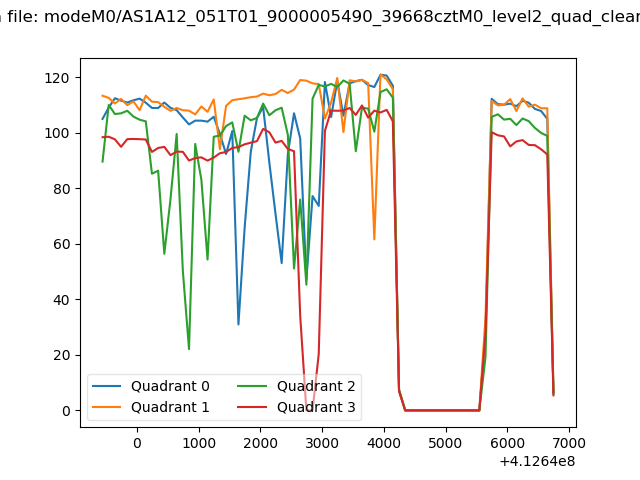
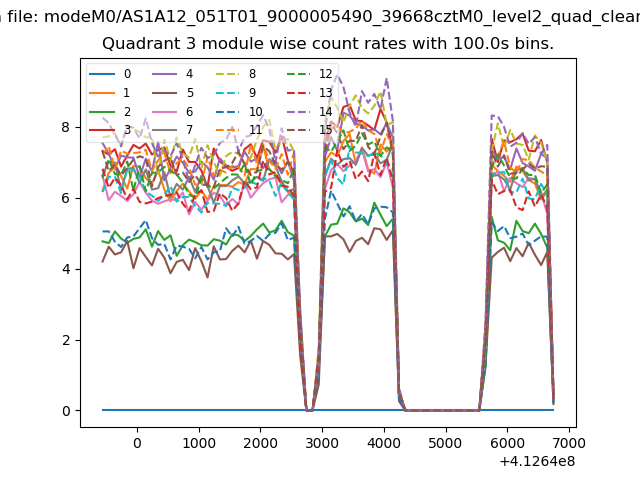
| Quadrant-wise count rates Data is divided into 100 sec bins |
 |
|
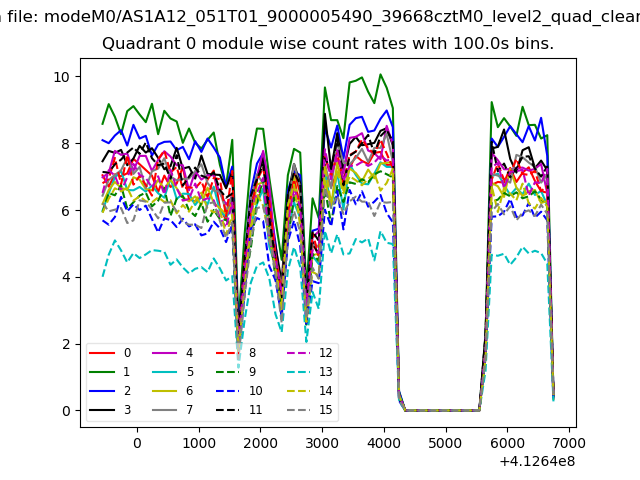
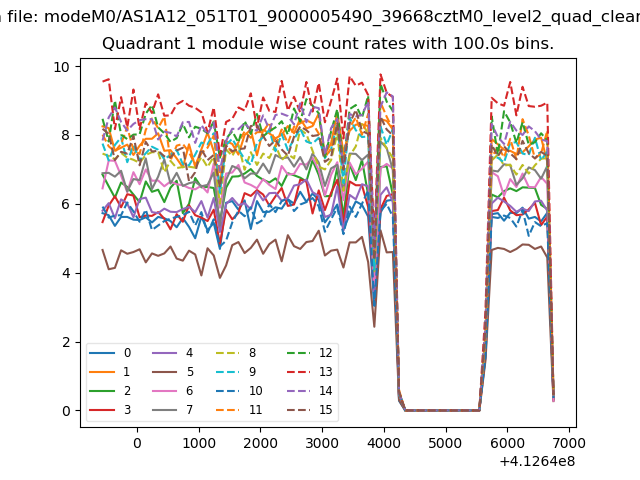
| Module-wise count rates for Quadrant A Data is divided into 100 sec bins |
 |
 |
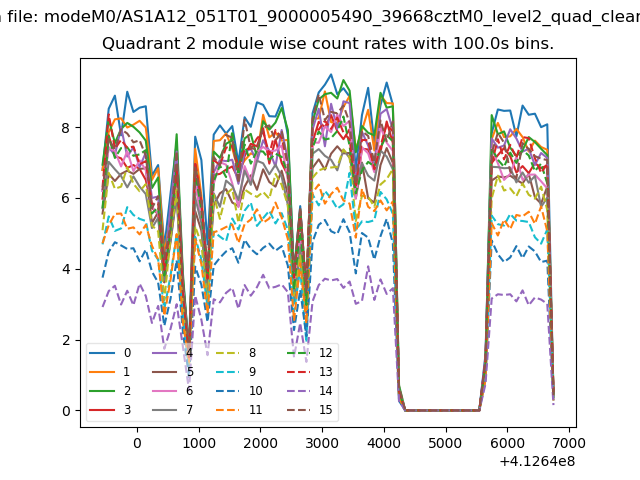
| Module-wise count rates for Quadrant B Data is divided into 100 sec bins |
 |
 |
| Module-wise count rates for Quadrant C Data is divided into 100 sec bins |
 |
 |
| Module-wise count rates for Quadrant D Data is divided into 100 sec bins |
 |
 |
| Parameter | Plot |
|---|---|
| CZT HV Monitor | 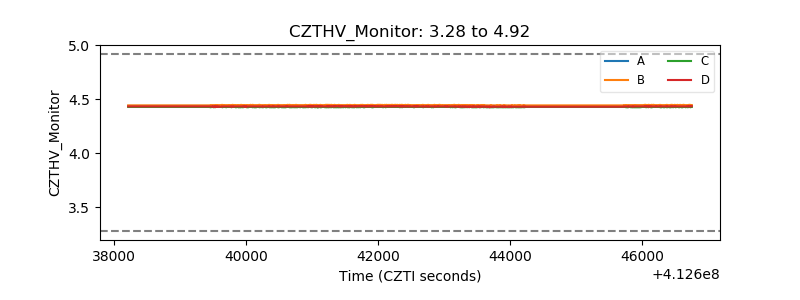 |
| D_VDD | 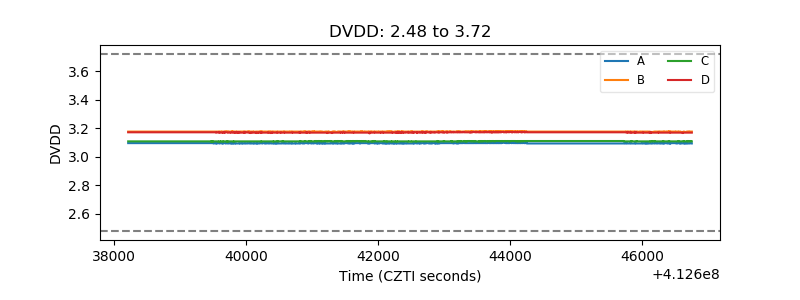 |
| Temperature 1 | 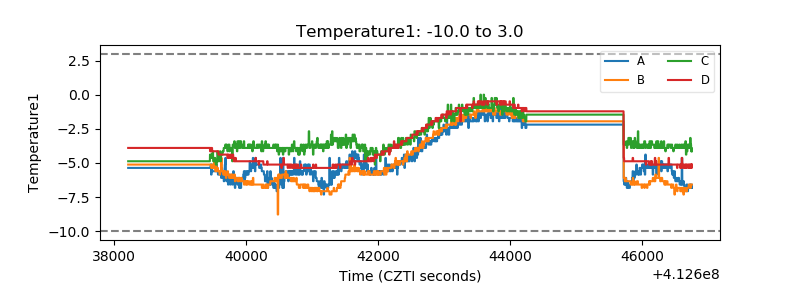 |
| Veto HV Monitor | 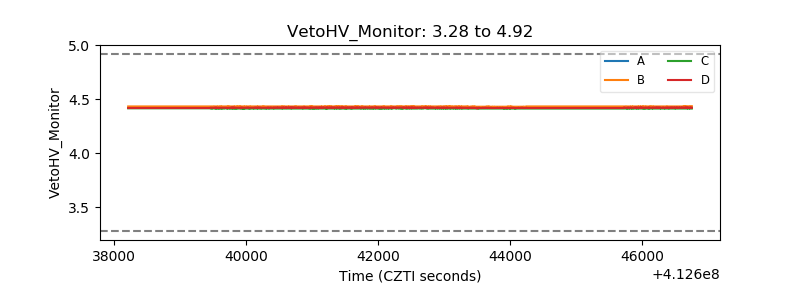 |
| Veto LLD | 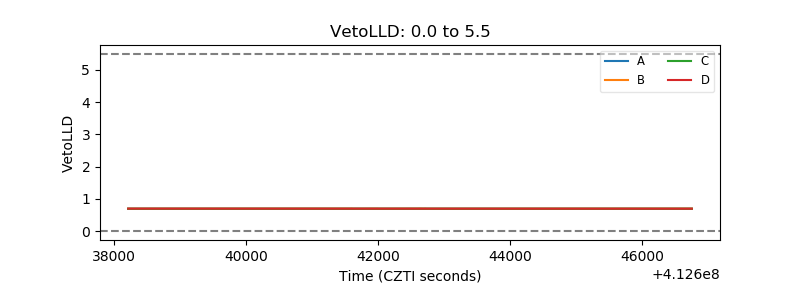 |
| Alpha Counter | 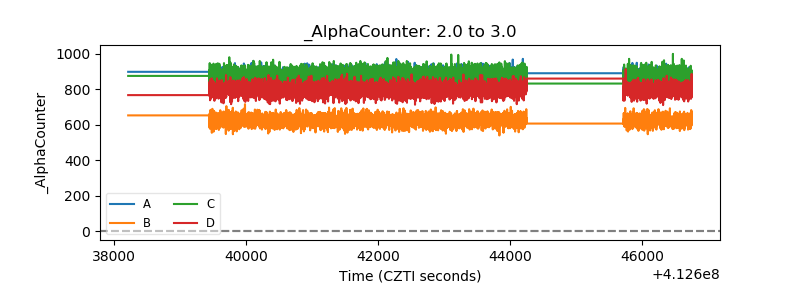 |
| _CPM_Rate | 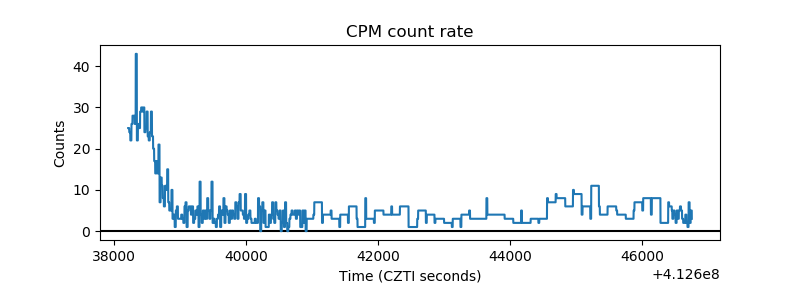 |
| CZT Counter | 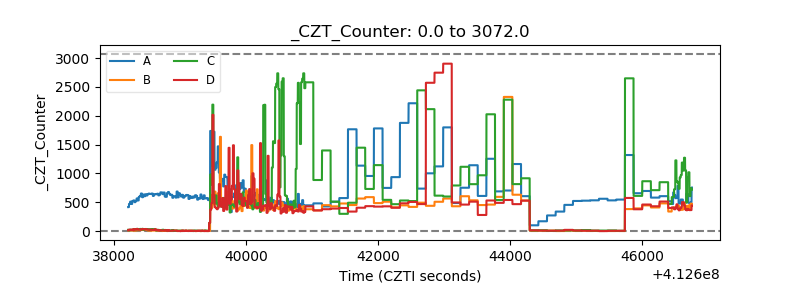 |
| +2.5 Volts monitor | 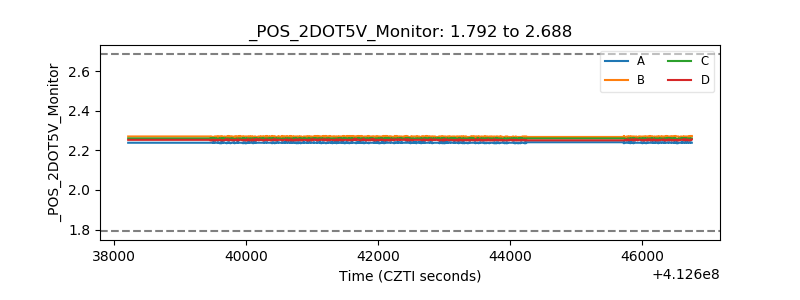 |
| +5 Volts monitor | 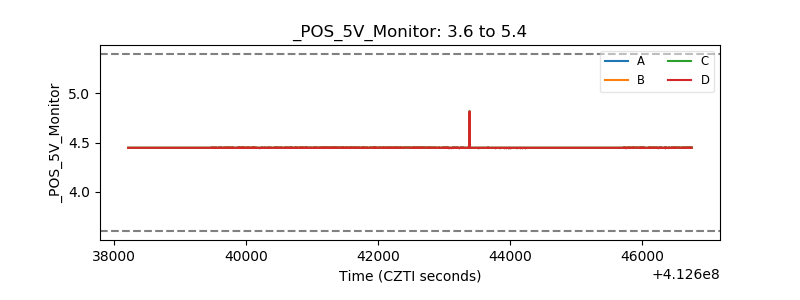 |
| _ROLL_ROT | 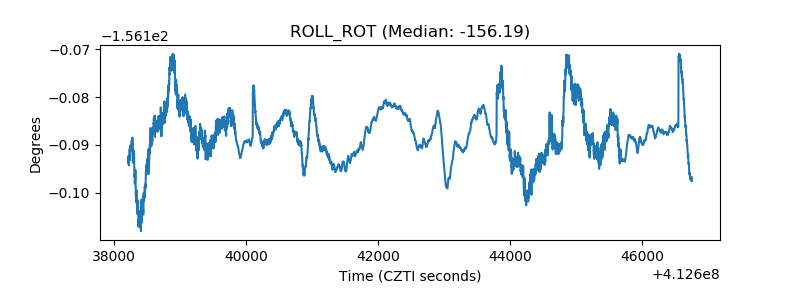 |
| _Roll_DEC | 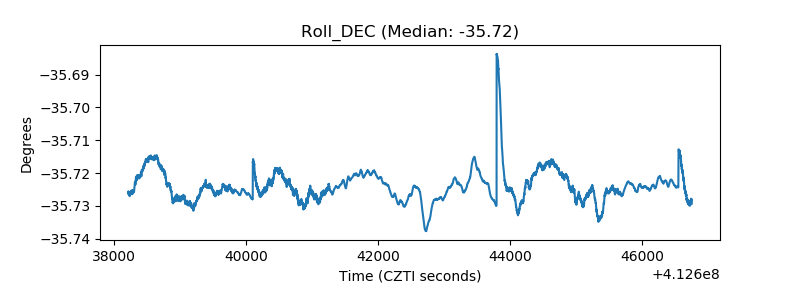 |
| _Roll_RA | 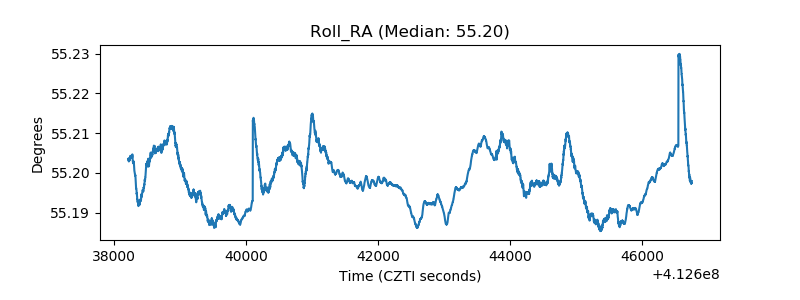 |
| Veto Counter | 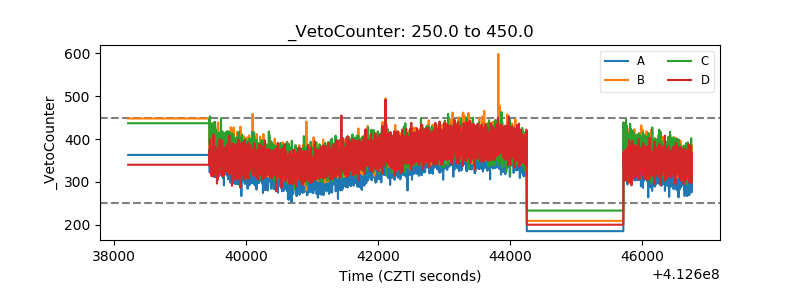 |