| Param | Original file | Final file |
|---|---|---|
| Filename | modeM0/AS1A12_051T01_9000005490_39669cztM0_level2.fits | modeM0/AS1A12_051T01_9000005490_39669cztM0_level2_quad_clean.evt |
| Size (bytes) | 424,255,680 | 95,705,280 |
| Size | 404.6 MB | 91.3 MB |
| Events in quadrant A | 3,966,095 | 642,591 |
| Events in quadrant B | 2,941,567 | 661,818 |
| Events in quadrant C | 4,341,683 | 618,973 |
| Events in quadrant D | 3,995,693 | 561,093 |
| Mode M9 | |||
|---|---|---|---|
| Quadrant | BADHDUFLAG | Total packets | Discarded packets |
| A | 0 | 23 | 0 |
| B | 0 | 23 | 0 |
| C | 0 | 23 | 0 |
| D | 0 | 24 | 0 |
| Mode M0 | |||
|---|---|---|---|
| Quadrant | BADHDUFLAG | Total packets | Discarded packets |
| A | 0 | 15731 | 3 |
| B | 0 | 12842 | 2 |
| C | 0 | 16827 | 2 |
| D | 0 | 15982 | 2 |
| Mode SS | |||
|---|---|---|---|
| Quadrant | BADHDUFLAG | Total packets | Discarded packets |
| A | 0 | 120 | 0 |
| B | 0 | 120 | 0 |
| C | 0 | 120 | 0 |
| D | 0 | 120 | 0 |
| Quadrant | Total seconds | Saturated seconds | Saturation percentage |
|---|---|---|---|
| A | 5914 | 91 | 1.538722% |
| B | 5914 | 39 | 0.659452% |
| C | 5914 | 139 | 2.350355% |
| D | 5914 | 279 | 4.717619% |
Noise dominated data is calculated using 1-second bins in cleaned event files. If a bin has >2000 counts, and if more than 50% of those come from <1% of pixels, then it is considered to be noise-dominated and hence unusable.
| Quadrant | # 1 sec bins | Bins with >0 counts | Bins with >2000 counts | High rate bins dominated by noise | Noise dominated (total time) | Noise dominated (detector-on time) | Marked lightcurve |
|---|---|---|---|---|---|---|---|
| A | 7226 | 5915 | 54 | 54 | 0.75% | 0.91% | 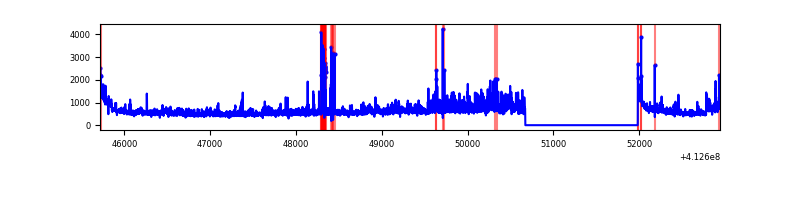 |
| B | 7226 | 5915 | 18 | 18 | 0.25% | 0.30% | 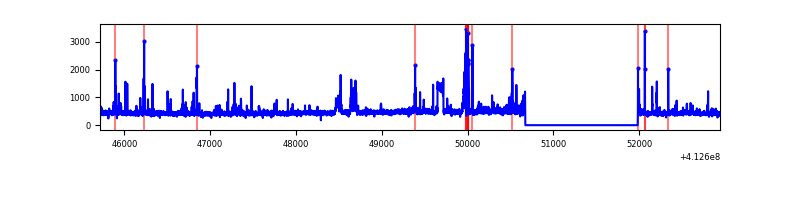 |
| C | 7226 | 5915 | 119 | 119 | 1.65% | 2.01% | 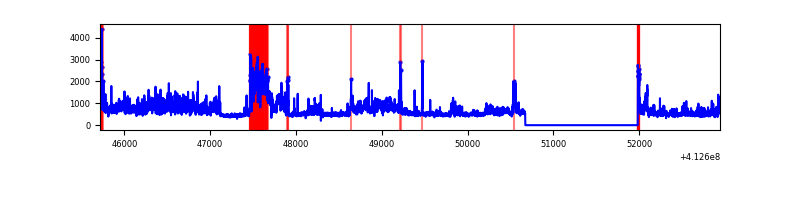 |
| D | 7226 | 5915 | 222 | 222 | 3.07% | 3.75% | 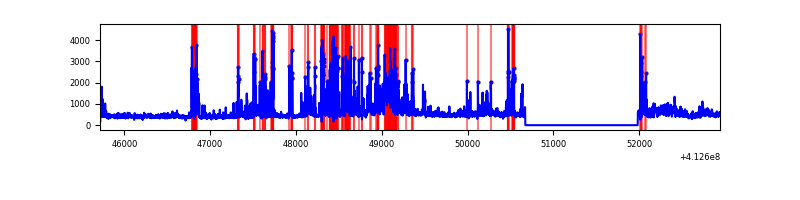 |
Top three noisy pixels from each quadrant. If the there are fewer than three noisy pixels in the level2.evt file, extra rows are filled as -1
| Pixel properties | Quadrant properties | ||||||
|---|---|---|---|---|---|---|---|
| Quadrant | DetID | PixID | Counts | Sigma | Mean | Median | Sigma |
| A | 15 | 222 | 708761 | 5424.98 | 641 | 629 | 130.5 |
| A | 10 | 83 | 484105 | 3703.89 | 641 | 629 | 130.5 |
| A | 15 | 174 | 195670 | 1494.2 | 641 | 629 | 130.5 |
| B | 5 | 172 | 188072 | 1490.35 | 643 | 626 | 125.8 |
| B | 5 | 255 | 96912 | 765.55 | 643 | 626 | 125.8 |
| B | 4 | 251 | 67117 | 528.66 | 643 | 626 | 125.8 |
| C | 15 | 208 | 1125438 | 7669.69 | 627 | 632 | 146.7 |
| C | 9 | 187 | 483377 | 3291.68 | 627 | 632 | 146.7 |
| C | 15 | 214 | 262201 | 1783.56 | 627 | 632 | 146.7 |
| D | 2 | 250 | 1037831 | 6798.58 | 617 | 599 | 152.6 |
| D | 13 | 174 | 414309 | 2711.68 | 617 | 599 | 152.6 |
| D | 2 | 153 | 37188 | 239.82 | 617 | 599 | 152.6 |
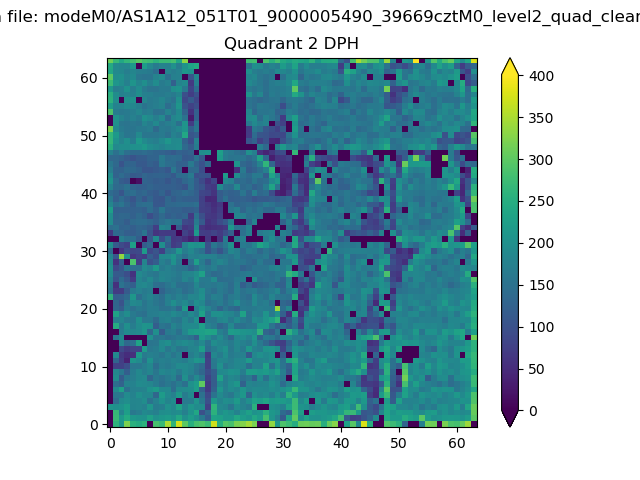
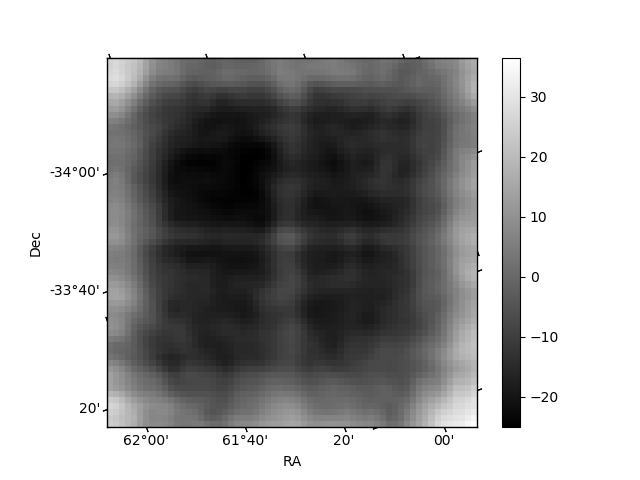
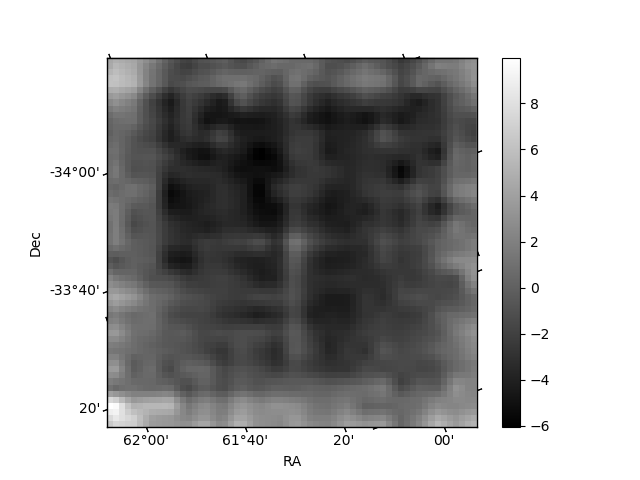
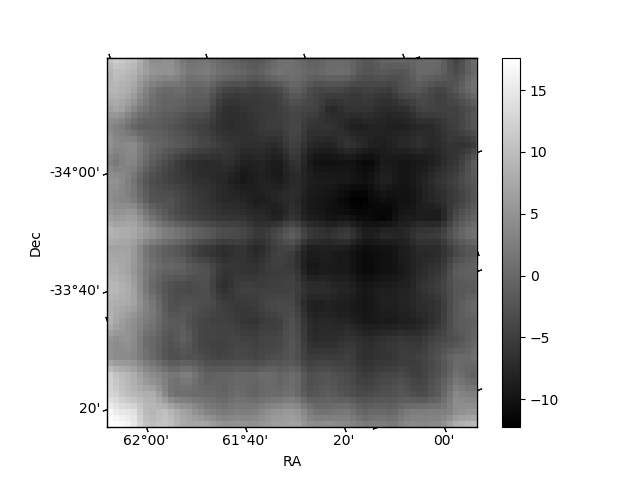
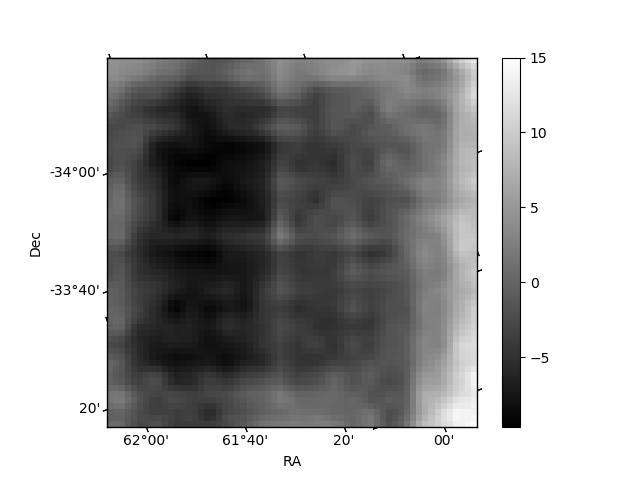
Histogram calculated using DETX and DETY for each event in the final _common_clean file
| Quadrant A | 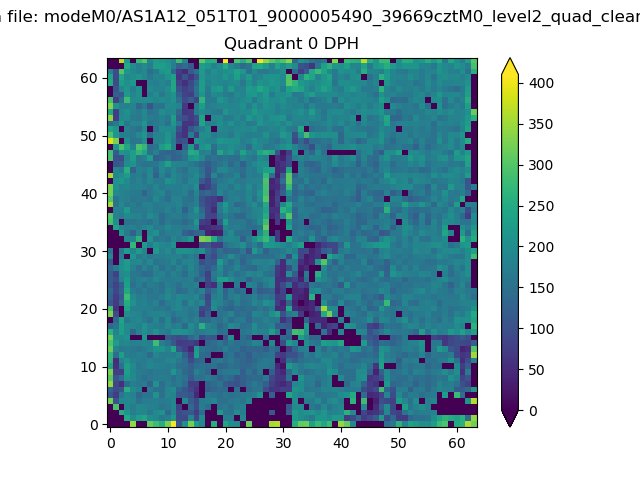 |
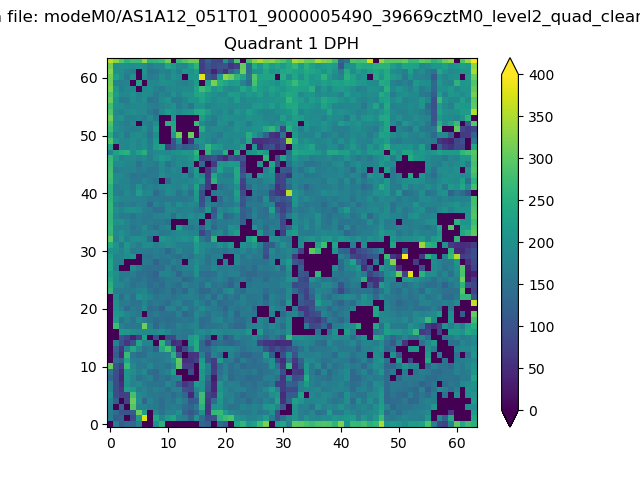 |
Quadrant B |
|---|---|---|---|
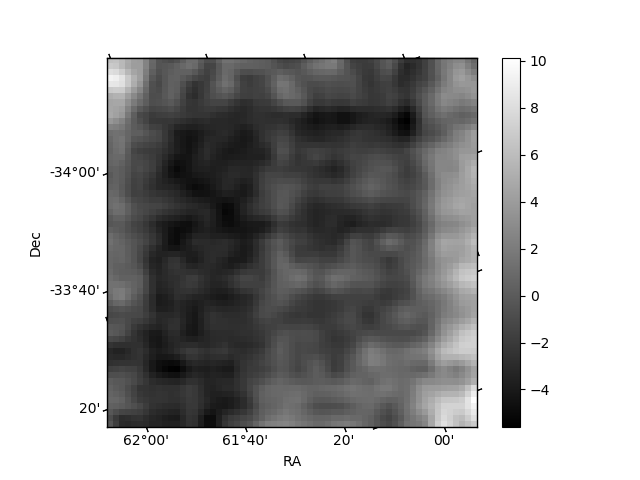
| Quadrant D | 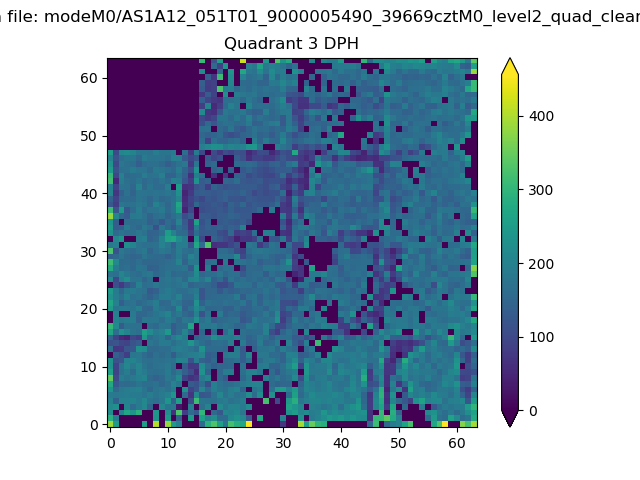 |
 |
Quadrant C |
| Plot type | Count rate plots | Images |
|---|---|---|
| Comparison with Poisson distribution Blue bars denote a histogram of data divided into 1 sec bins. Red curve is a Poisson curve with rate = median count rate of data. |
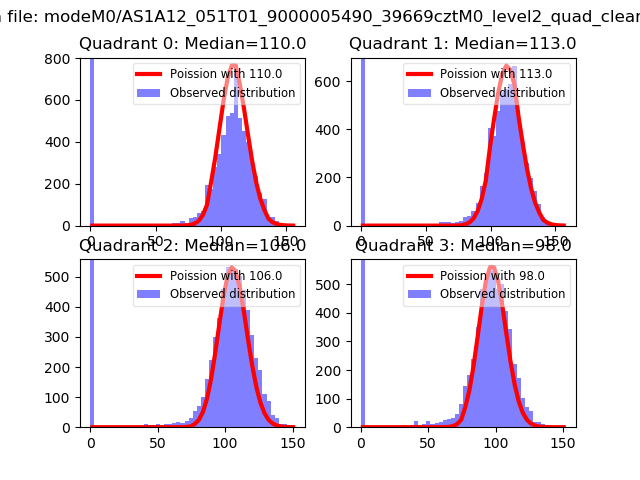 |
 |
| Quadrant-wise count rates Data is divided into 100 sec bins |
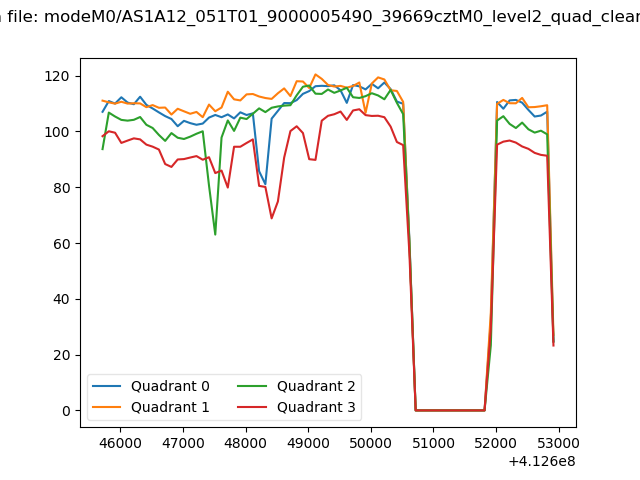 |
|
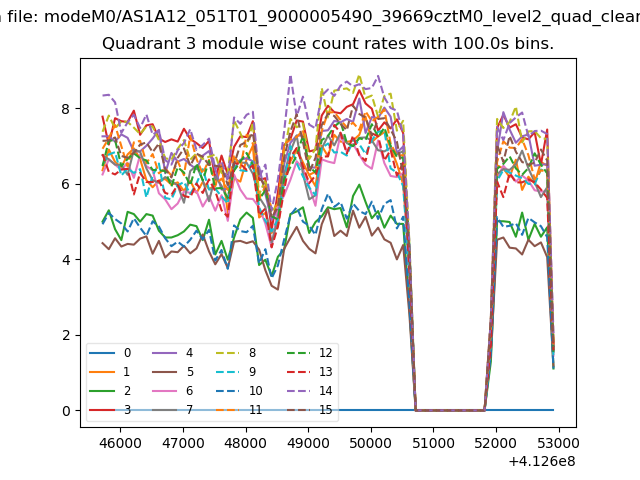
| Module-wise count rates for Quadrant A Data is divided into 100 sec bins |
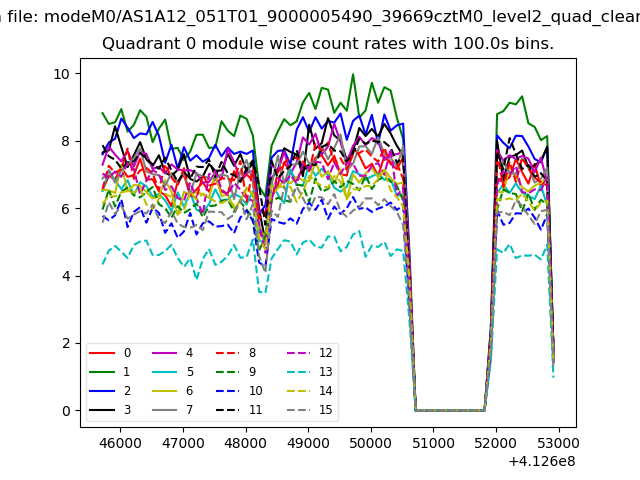 |
 |
| Module-wise count rates for Quadrant B Data is divided into 100 sec bins |
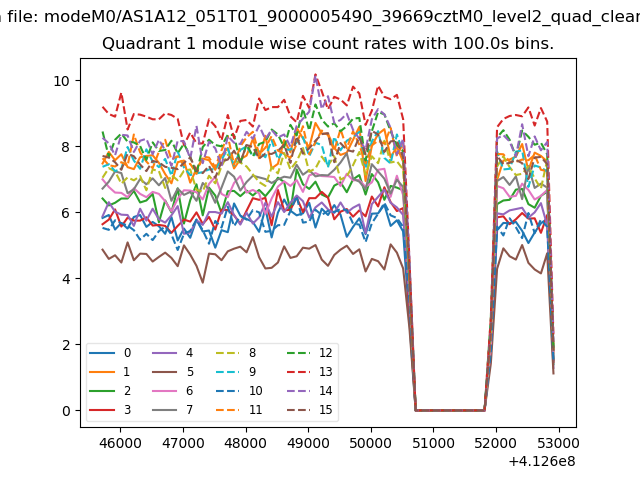 |
 |
| Module-wise count rates for Quadrant C Data is divided into 100 sec bins |
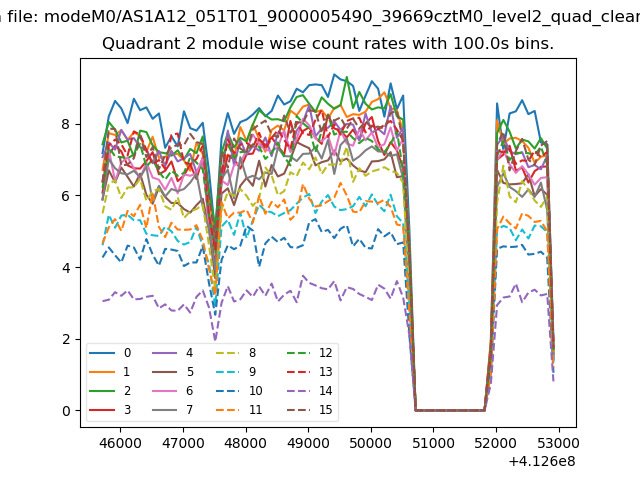 |
 |
| Module-wise count rates for Quadrant D Data is divided into 100 sec bins |
 |
 |
| Parameter | Plot |
|---|---|
| CZT HV Monitor | 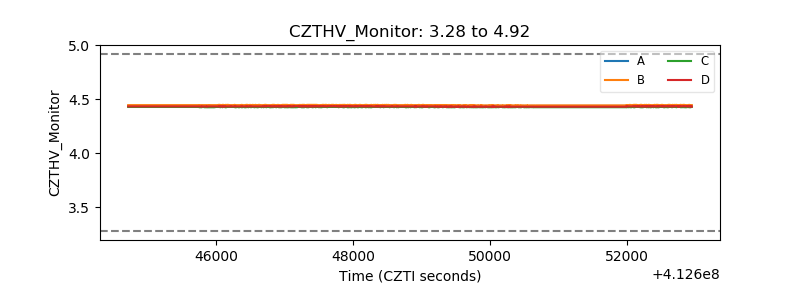 |
| D_VDD | 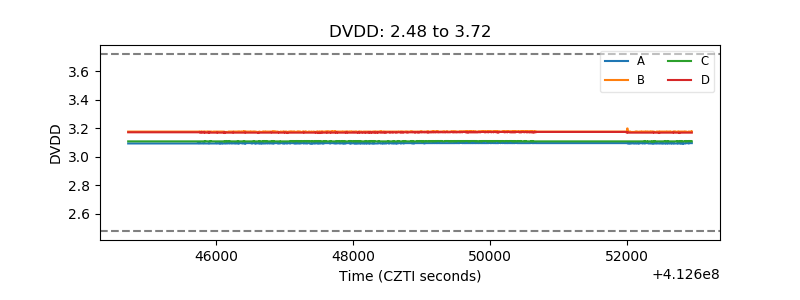 |
| Temperature 1 | 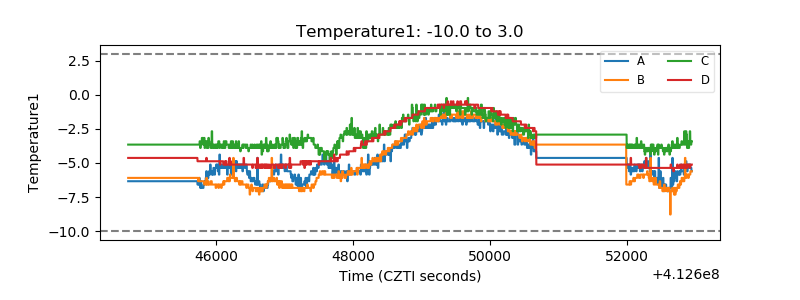 |
| Veto HV Monitor | 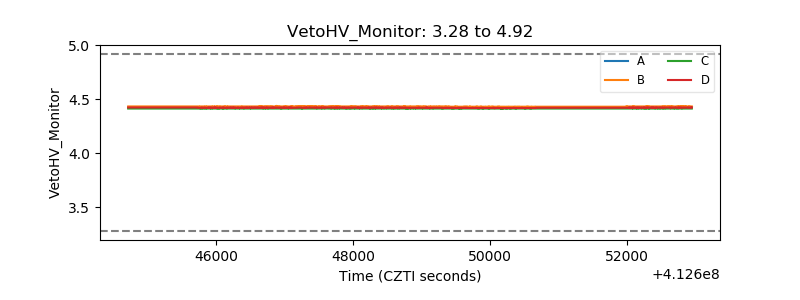 |
| Veto LLD | 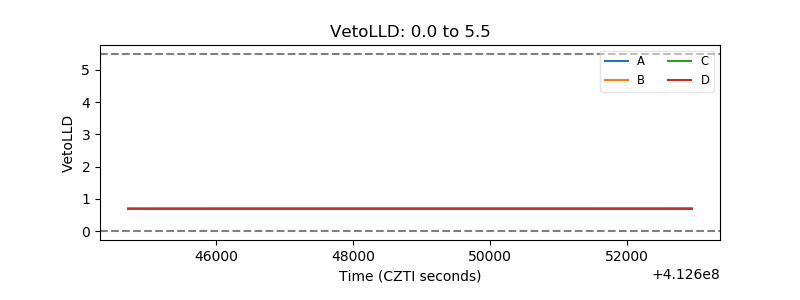 |
| Alpha Counter | 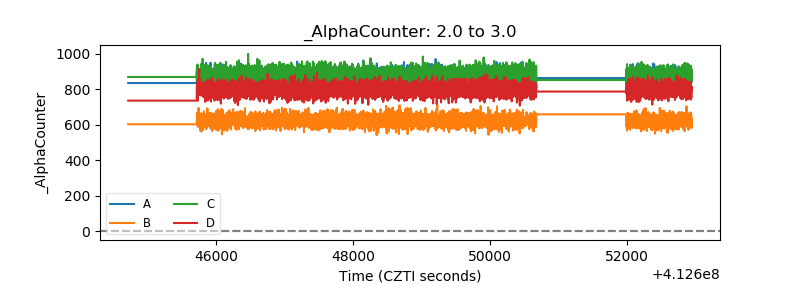 |
| _CPM_Rate | 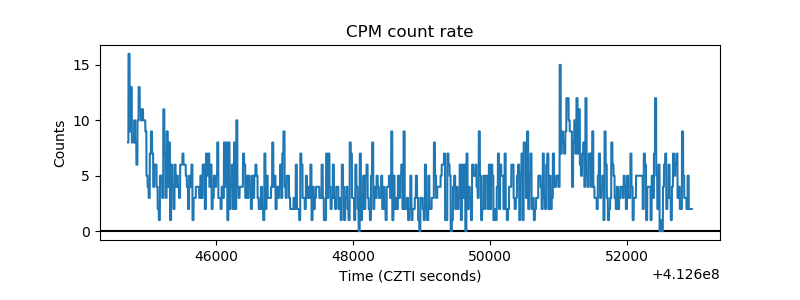 |
| CZT Counter | 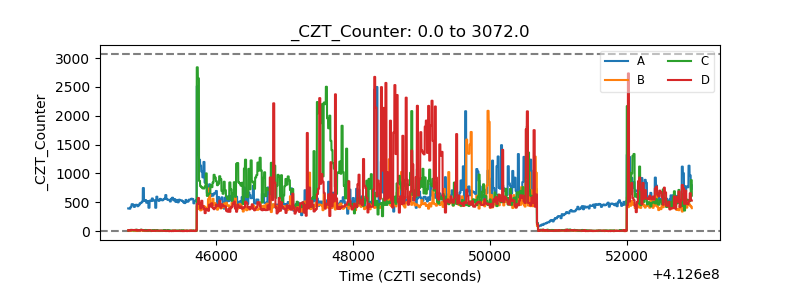 |
| +2.5 Volts monitor | 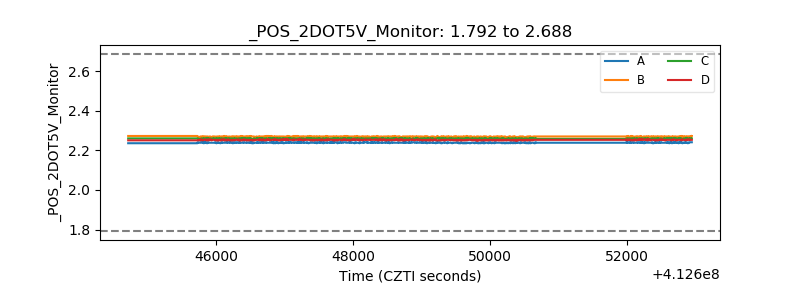 |
| +5 Volts monitor |  |
| _ROLL_ROT | 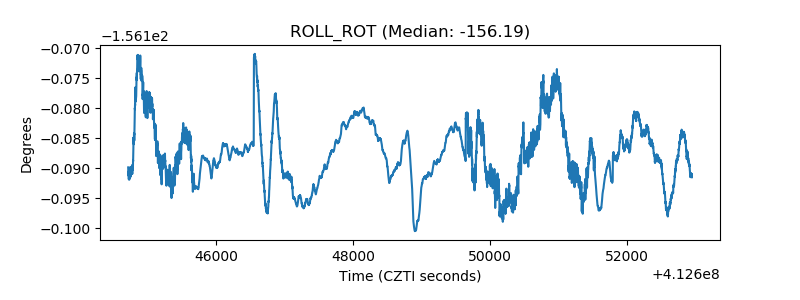 |
| _Roll_DEC | 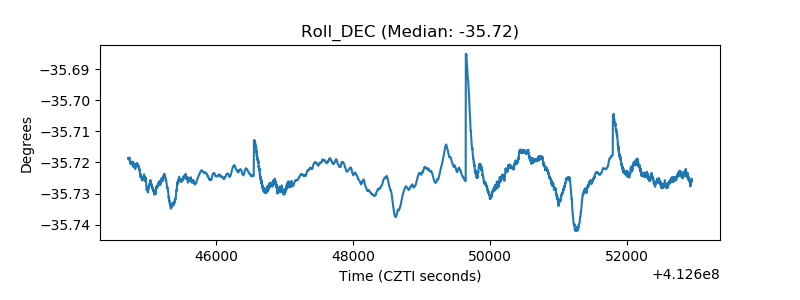 |
| _Roll_RA | 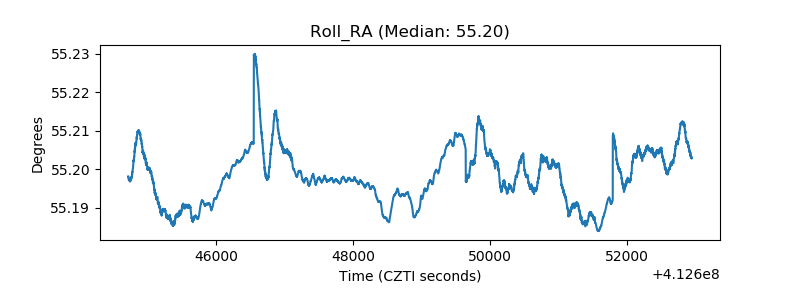 |
| Veto Counter | 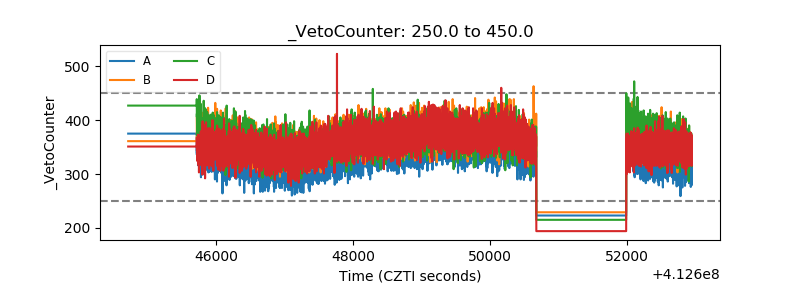 |