| Param | Original file | Final file |
|---|---|---|
| Filename | modeM0/AS1A12_051T01_9000005490_39672cztM0_level2.fits | modeM0/AS1A12_051T01_9000005490_39672cztM0_level2_quad_clean.evt |
| Size (bytes) | 1,560,479,040 | 239,215,680 |
| Size | 1.5 GB | 228.1 MB |
| Events in quadrant A | 24,547,222 | 1,264,525 |
| Events in quadrant B | 8,134,482 | 1,760,367 |
| Events in quadrant C | 15,622,937 | 1,541,935 |
| Events in quadrant D | 8,213,337 | 1,561,059 |
| Mode M9 | |||
|---|---|---|---|
| Quadrant | BADHDUFLAG | Total packets | Discarded packets |
| A | 0 | 54 | 0 |
| B | 0 | 54 | 0 |
| C | 0 | 54 | 0 |
| D | 0 | 54 | 0 |
| Mode M0 | |||
|---|---|---|---|
| Quadrant | BADHDUFLAG | Total packets | Discarded packets |
| A | 0 | 84045 | 5 |
| B | 0 | 35148 | 4 |
| C | 0 | 57428 | 4 |
| D | 0 | 35606 | 4 |
| Mode SS | |||
|---|---|---|---|
| Quadrant | BADHDUFLAG | Total packets | Discarded packets |
| A | 0 | 332 | 0 |
| B | 0 | 332 | 0 |
| C | 0 | 332 | 0 |
| D | 0 | 332 | 0 |
| Quadrant | Total seconds | Saturated seconds | Saturation percentage |
|---|---|---|---|
| A | 16145 | 5035 | 31.186126% |
| B | 16145 | 232 | 1.436977% |
| C | 16145 | 1702 | 10.541963% |
| D | 16145 | 91 | 0.563642% |
Noise dominated data is calculated using 1-second bins in cleaned event files. If a bin has >2000 counts, and if more than 50% of those come from <1% of pixels, then it is considered to be noise-dominated and hence unusable.
| Quadrant | # 1 sec bins | Bins with >0 counts | Bins with >2000 counts | High rate bins dominated by noise | Noise dominated (total time) | Noise dominated (detector-on time) | Marked lightcurve |
|---|---|---|---|---|---|---|---|
| A | 21577 | 16149 | 4306 | 4306 | 19.96% | 26.66% | 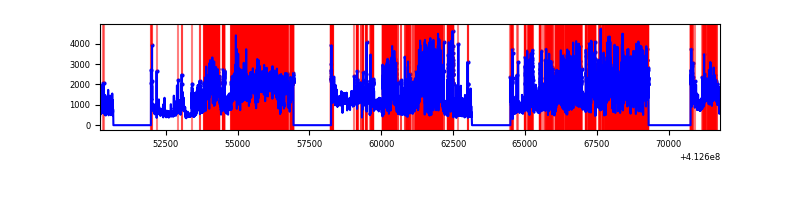 |
| B | 21577 | 16149 | 147 | 147 | 0.68% | 0.91% | 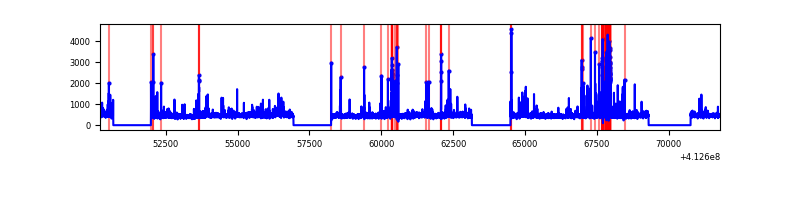 |
| C | 21577 | 16149 | 1522 | 1522 | 7.05% | 9.42% | 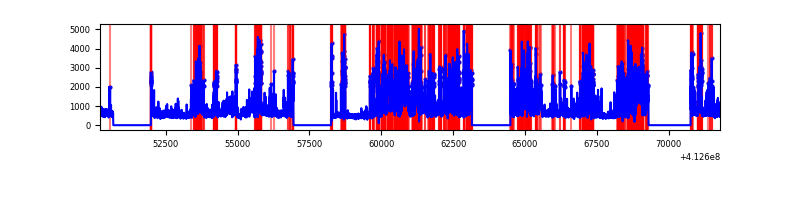 |
| D | 21577 | 16149 | 68 | 68 | 0.32% | 0.42% | 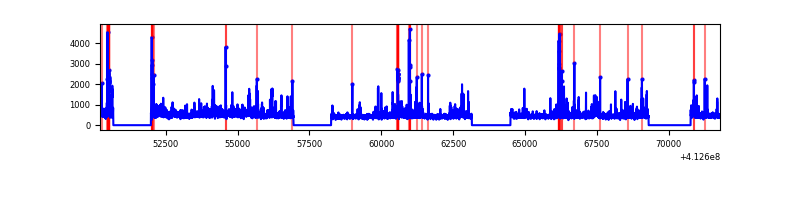 |
Top three noisy pixels from each quadrant. If the there are fewer than three noisy pixels in the level2.evt file, extra rows are filled as -1
| Pixel properties | Quadrant properties | ||||||
|---|---|---|---|---|---|---|---|
| Quadrant | DetID | PixID | Counts | Sigma | Mean | Median | Sigma |
| A | 15 | 222 | 15295293 | 46586.8 | 1621 | 1586 | 328.3 |
| A | 15 | 174 | 1474966 | 4488.12 | 1621 | 1586 | 328.3 |
| A | 10 | 83 | 1130512 | 3438.87 | 1621 | 1586 | 328.3 |
| B | 5 | 172 | 827879 | 2477.53 | 1753 | 1701 | 333.5 |
| B | 5 | 255 | 166404 | 493.91 | 1753 | 1701 | 333.5 |
| B | 4 | 200 | 56977 | 165.76 | 1753 | 1701 | 333.5 |
| C | 15 | 208 | 5807647 | 14929.41 | 1668 | 1677 | 388.9 |
| C | 9 | 187 | 2362396 | 6070.33 | 1668 | 1677 | 388.9 |
| C | 15 | 214 | 697384 | 1788.93 | 1668 | 1677 | 388.9 |
| D | 13 | 174 | 546034 | 1293.81 | 1729 | 1678 | 420.7 |
| D | 2 | 250 | 264514 | 624.7 | 1729 | 1678 | 420.7 |
| D | 12 | 227 | 232888 | 549.53 | 1729 | 1678 | 420.7 |
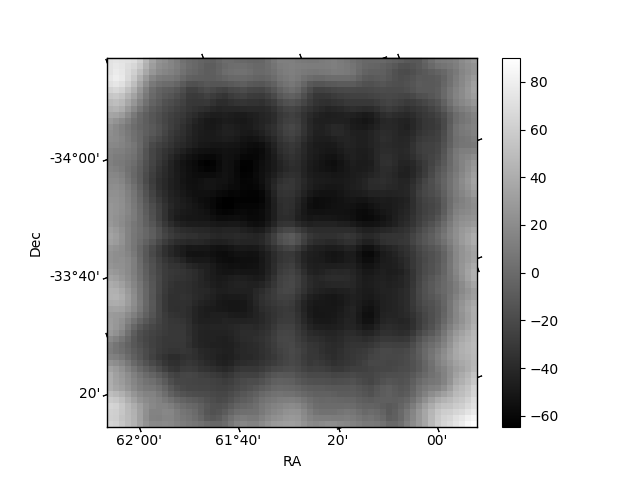
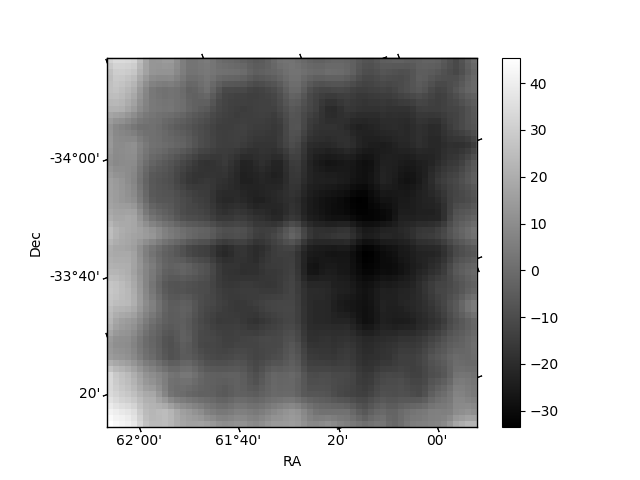
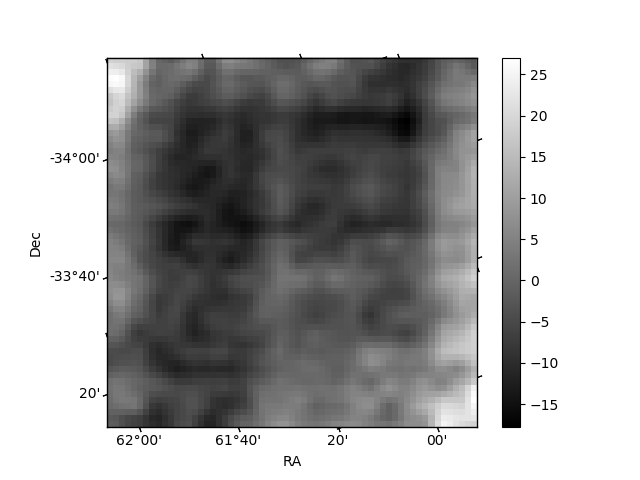
Histogram calculated using DETX and DETY for each event in the final _common_clean file
| Quadrant A | 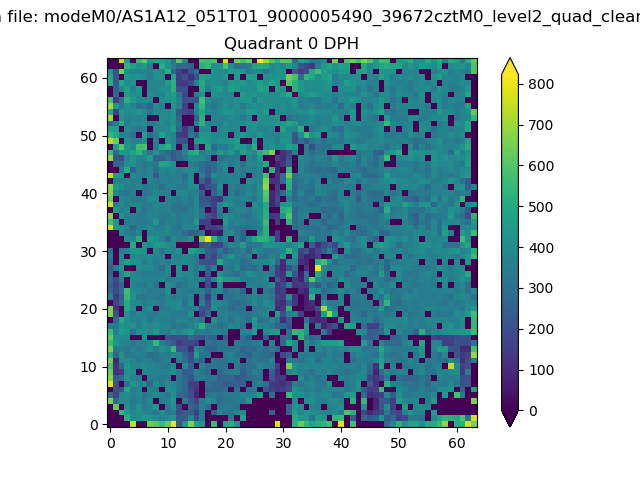 |
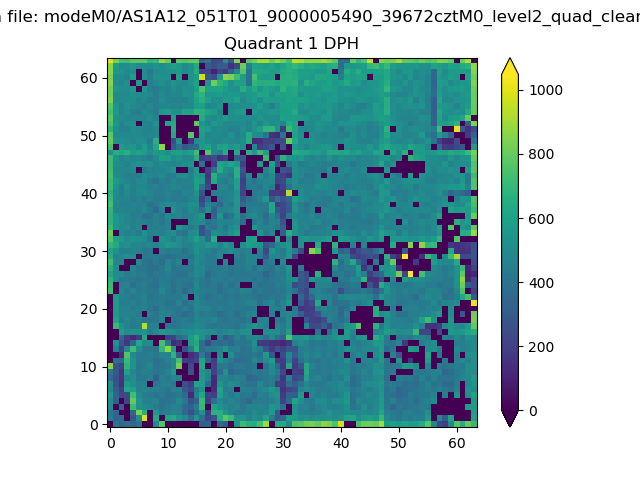 |
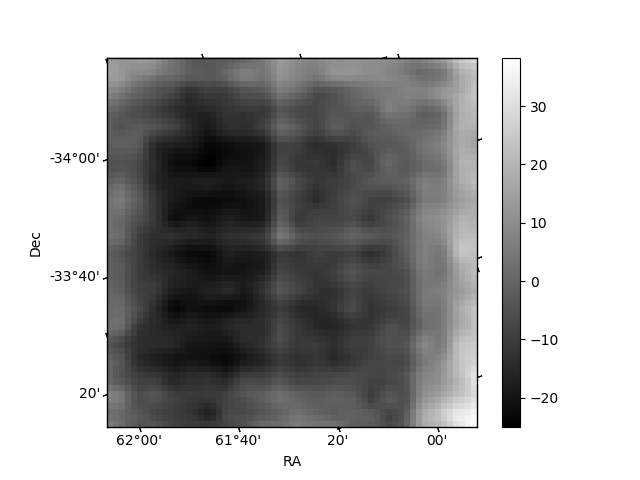
Quadrant B |
|---|---|---|---|
| Quadrant D | 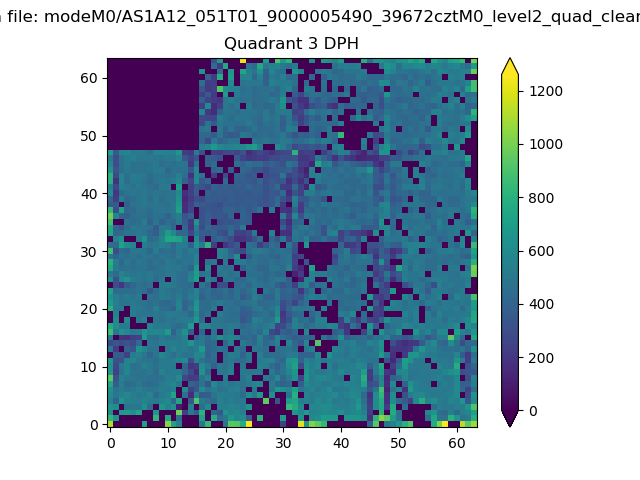 |
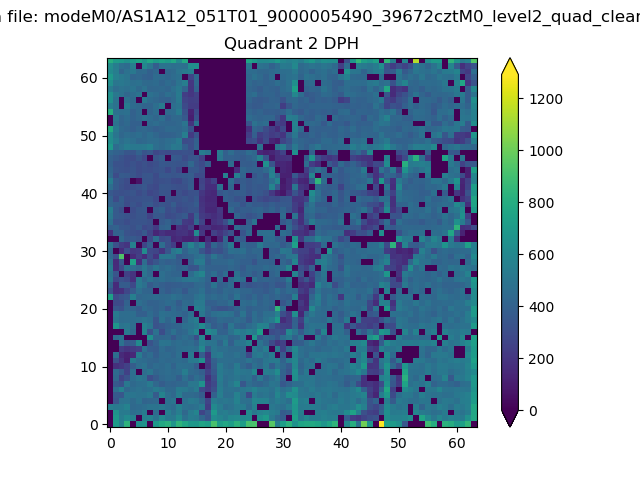 |
Quadrant C |
| Plot type | Count rate plots | Images |
|---|---|---|
| Comparison with Poisson distribution Blue bars denote a histogram of data divided into 1 sec bins. Red curve is a Poisson curve with rate = median count rate of data. |
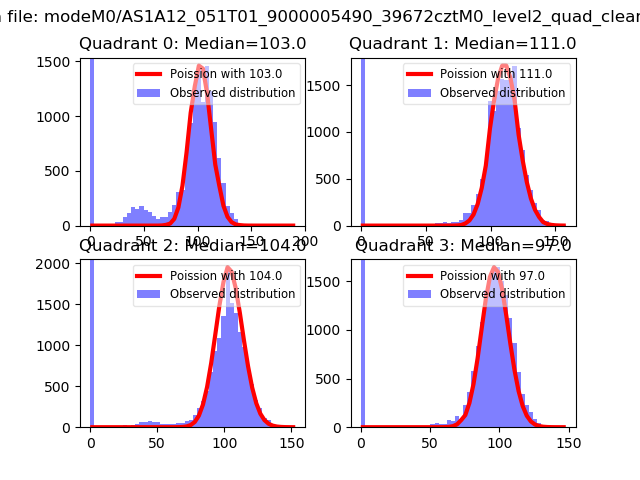 |
 |
| Quadrant-wise count rates Data is divided into 100 sec bins |
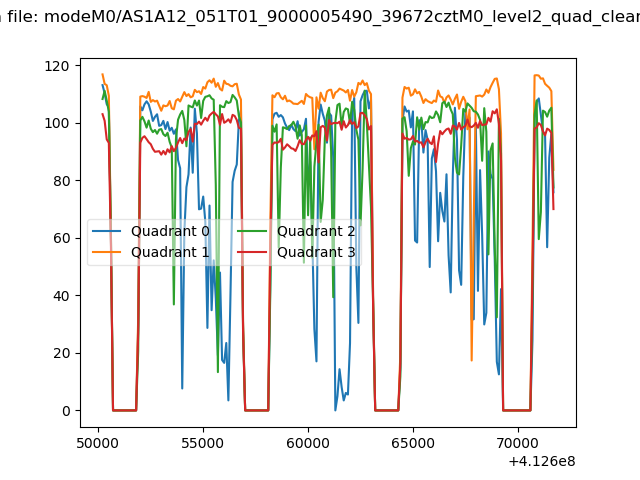 |
|
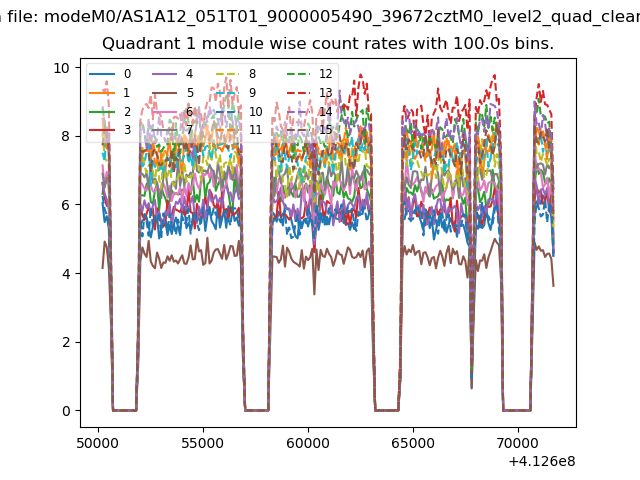
| Module-wise count rates for Quadrant A Data is divided into 100 sec bins |
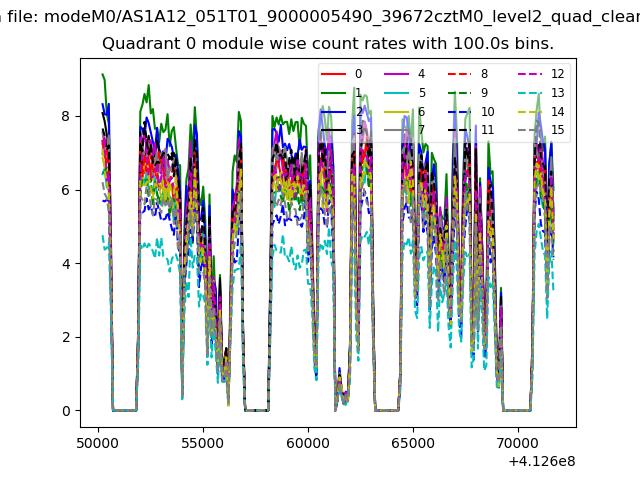 |
 |
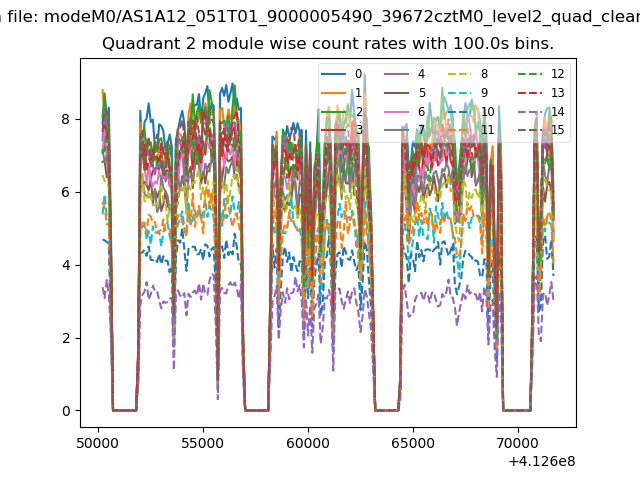
| Module-wise count rates for Quadrant B Data is divided into 100 sec bins |
 |
 |
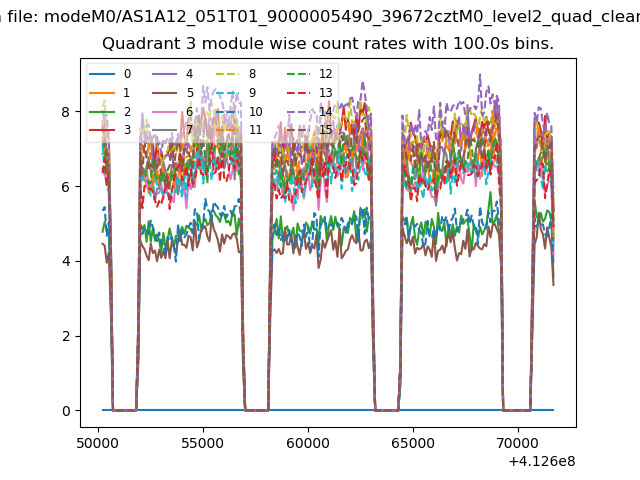
| Module-wise count rates for Quadrant C Data is divided into 100 sec bins |
 |
 |
| Module-wise count rates for Quadrant D Data is divided into 100 sec bins |
 |
 |
| Parameter | Plot |
|---|---|
| CZT HV Monitor | 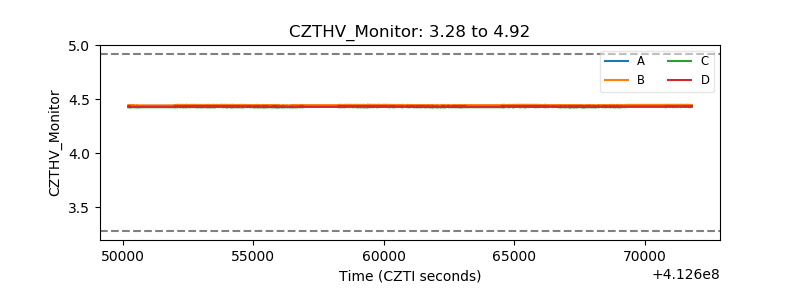 |
| D_VDD | 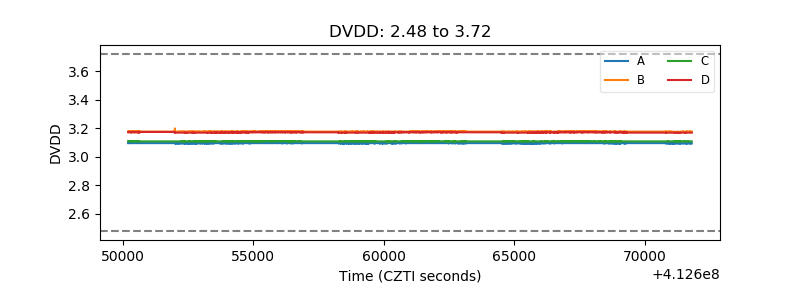 |
| Temperature 1 | 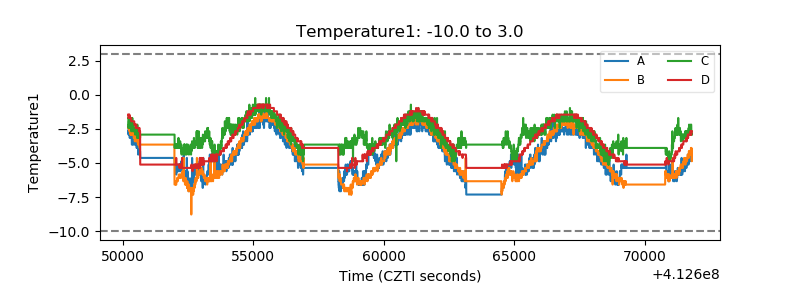 |
| Veto HV Monitor | 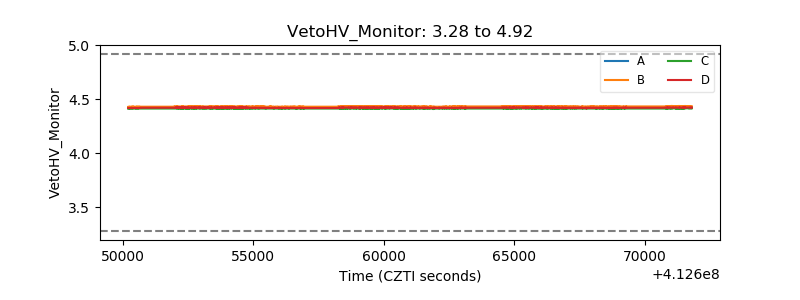 |
| Veto LLD | 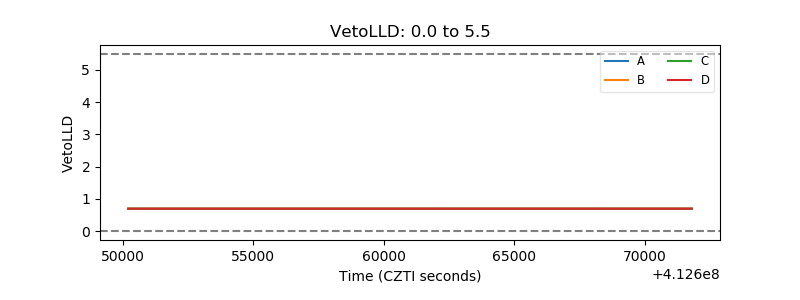 |
| Alpha Counter | 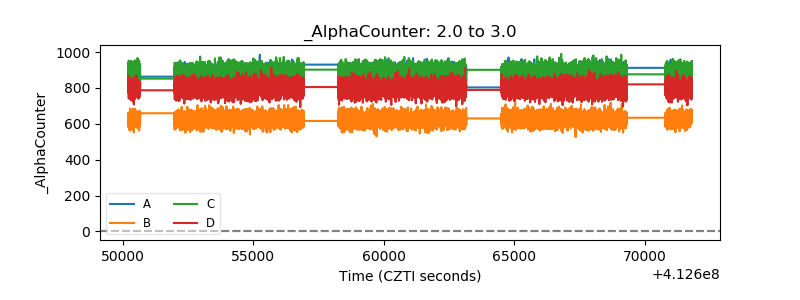 |
| _CPM_Rate | 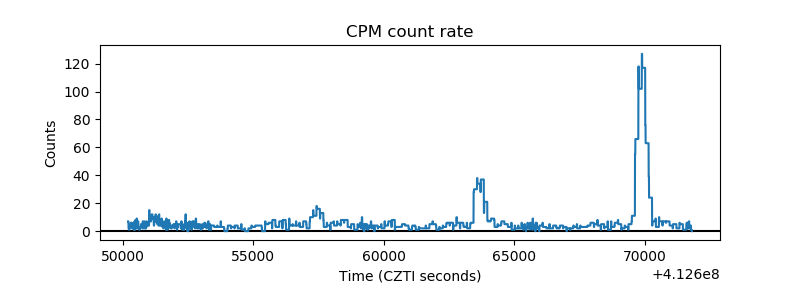 |
| CZT Counter | 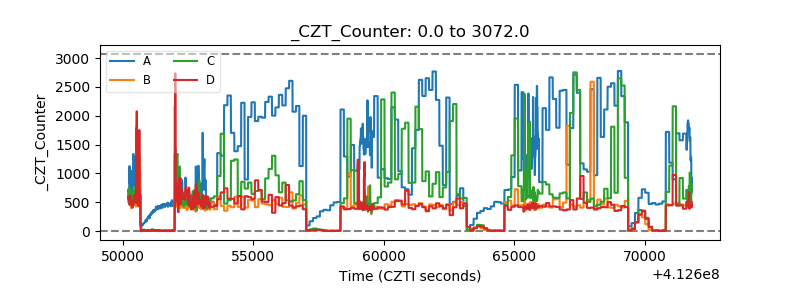 |
| +2.5 Volts monitor | 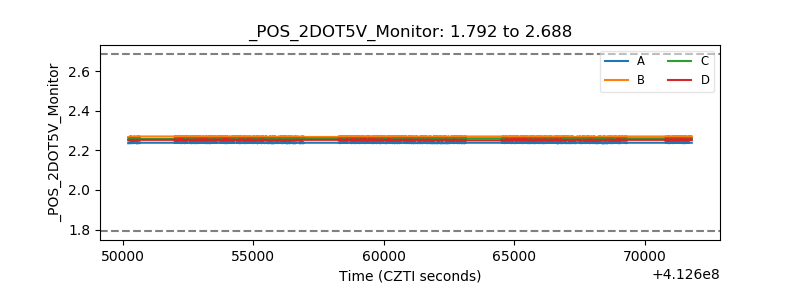 |
| +5 Volts monitor | 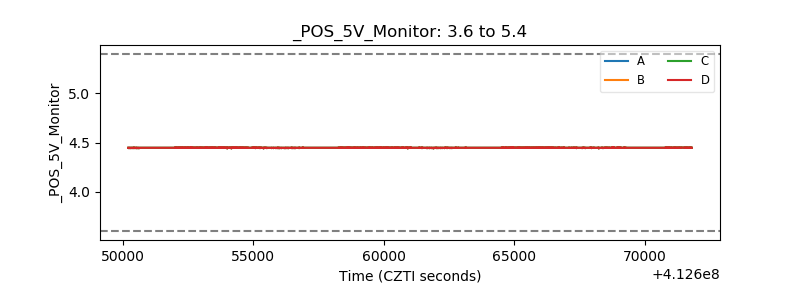 |
| _ROLL_ROT | 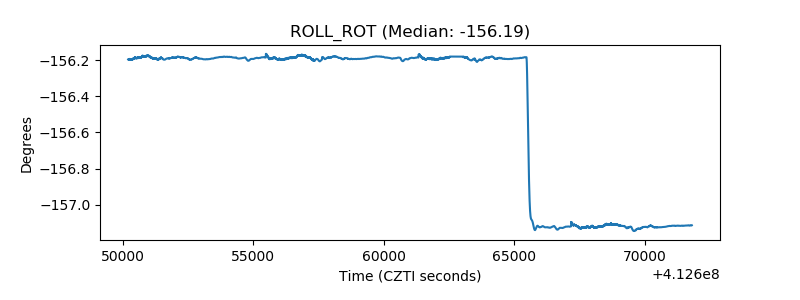 |
| _Roll_DEC | 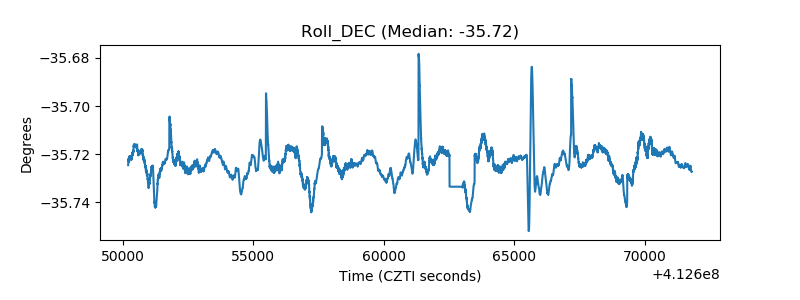 |
| _Roll_RA | 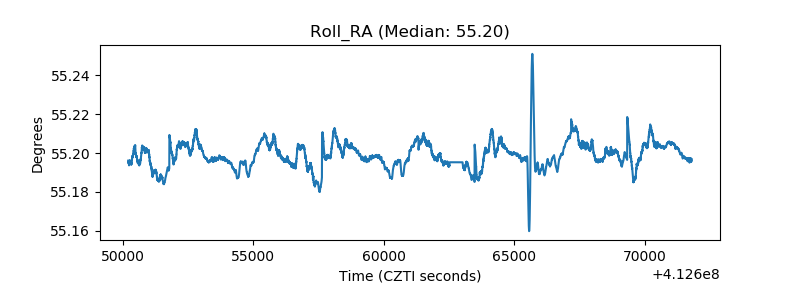 |
| Veto Counter | 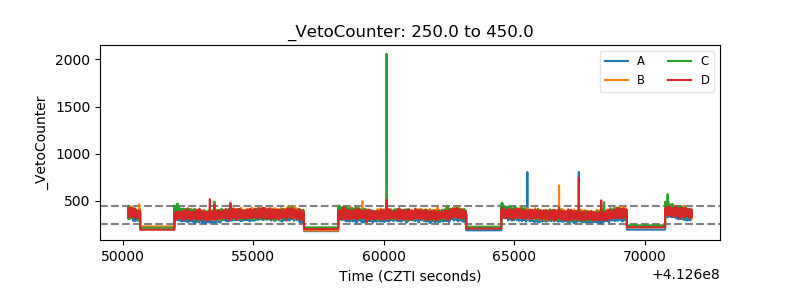 |