| Param | Original file | Final file |
|---|---|---|
| Filename | modeM0/AS1A12_051T01_9000005490_39673cztM0_level2.fits | modeM0/AS1A12_051T01_9000005490_39673cztM0_level2_quad_clean.evt |
| Size (bytes) | 526,150,080 | 91,388,160 |
| Size | 501.8 MB | 87.2 MB |
| Events in quadrant A | 7,839,816 | 543,189 |
| Events in quadrant B | 2,717,853 | 651,049 |
| Events in quadrant C | 5,136,583 | 606,057 |
| Events in quadrant D | 3,335,919 | 564,503 |
| Mode M9 | |||
|---|---|---|---|
| Quadrant | BADHDUFLAG | Total packets | Discarded packets |
| A | 0 | 31 | 0 |
| B | 0 | 31 | 0 |
| C | 0 | 31 | 0 |
| D | 0 | 31 | 0 |
| Mode M0 | |||
|---|---|---|---|
| Quadrant | BADHDUFLAG | Total packets | Discarded packets |
| A | 0 | 27274 | 3 |
| B | 0 | 12119 | 2 |
| C | 0 | 19225 | 2 |
| D | 0 | 13904 | 2 |
| Mode SS | |||
|---|---|---|---|
| Quadrant | BADHDUFLAG | Total packets | Discarded packets |
| A | 0 | 118 | 0 |
| B | 0 | 118 | 0 |
| C | 0 | 118 | 0 |
| D | 0 | 118 | 0 |
| Quadrant | Total seconds | Saturated seconds | Saturation percentage |
|---|---|---|---|
| A | 5754 | 1151 | 20.003476% |
| B | 5754 | 38 | 0.660410% |
| C | 5754 | 333 | 5.787278% |
| D | 5754 | 181 | 3.145638% |
Noise dominated data is calculated using 1-second bins in cleaned event files. If a bin has >2000 counts, and if more than 50% of those come from <1% of pixels, then it is considered to be noise-dominated and hence unusable.
| Quadrant | # 1 sec bins | Bins with >0 counts | Bins with >2000 counts | High rate bins dominated by noise | Noise dominated (total time) | Noise dominated (detector-on time) | Marked lightcurve |
|---|---|---|---|---|---|---|---|
| A | 8802 | 5756 | 967 | 967 | 10.99% | 16.80% | 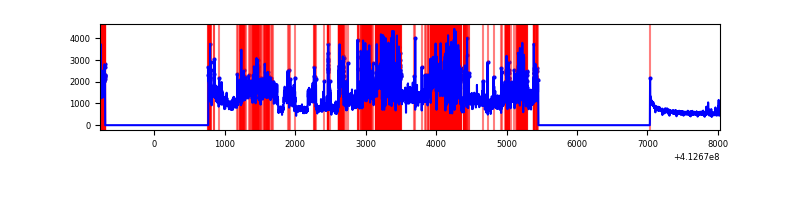 |
| B | 8802 | 5756 | 15 | 15 | 0.17% | 0.26% | 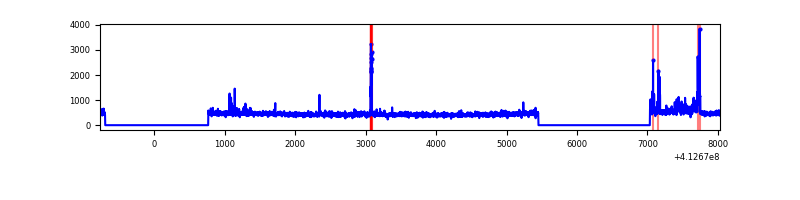 |
| C | 8802 | 5756 | 287 | 287 | 3.26% | 4.99% | 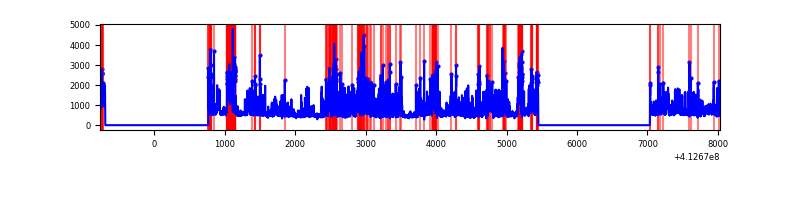 |
| D | 8802 | 5756 | 141 | 141 | 1.60% | 2.45% | 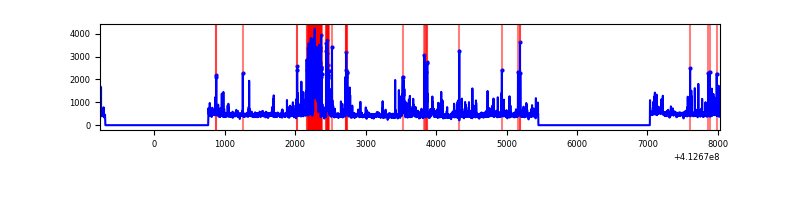 |
Top three noisy pixels from each quadrant. If the there are fewer than three noisy pixels in the level2.evt file, extra rows are filled as -1
| Pixel properties | Quadrant properties | ||||||
|---|---|---|---|---|---|---|---|
| Quadrant | DetID | PixID | Counts | Sigma | Mean | Median | Sigma |
| A | 15 | 222 | 4796652 | 38567.5 | 609 | 596 | 124.4 |
| A | 10 | 83 | 449170 | 3607.21 | 609 | 596 | 124.4 |
| A | 15 | 174 | 165796 | 1328.46 | 609 | 596 | 124.4 |
| B | 5 | 172 | 148880 | 1195.49 | 636 | 619 | 124.0 |
| B | 0 | 186 | 38207 | 303.09 | 636 | 619 | 124.0 |
| B | 12 | 111 | 15577 | 120.61 | 636 | 619 | 124.0 |
| C | 15 | 208 | 1681139 | 11622.06 | 614 | 617 | 144.6 |
| C | 9 | 187 | 540558 | 3734.09 | 614 | 617 | 144.6 |
| C | 15 | 214 | 252266 | 1740.34 | 614 | 617 | 144.6 |
| D | 12 | 233 | 439399 | 2869.47 | 621 | 603 | 152.9 |
| D | 13 | 249 | 192518 | 1255.01 | 621 | 603 | 152.9 |
| D | 12 | 227 | 84956 | 551.62 | 621 | 603 | 152.9 |
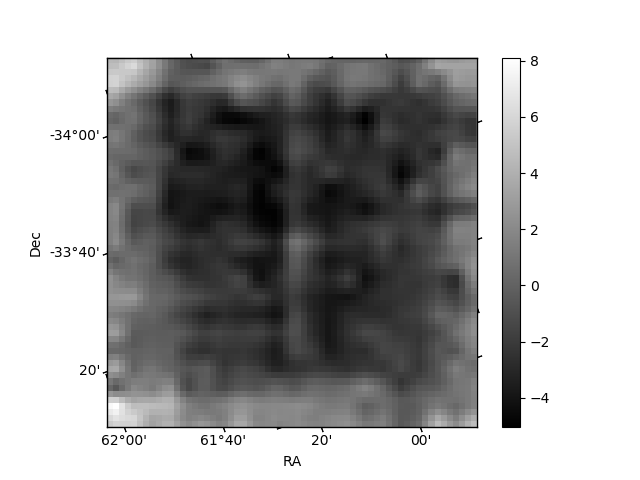
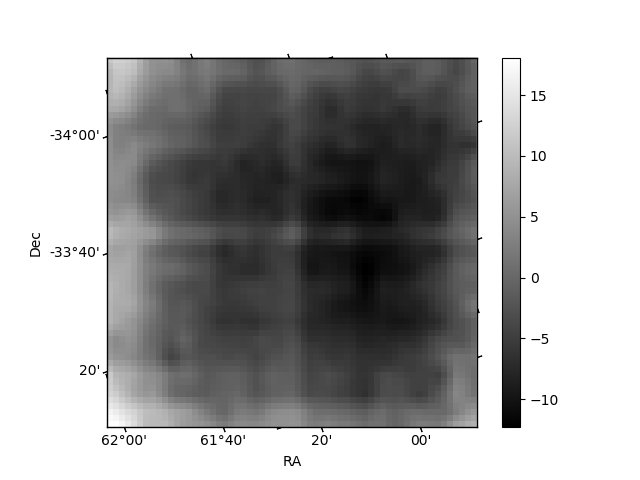
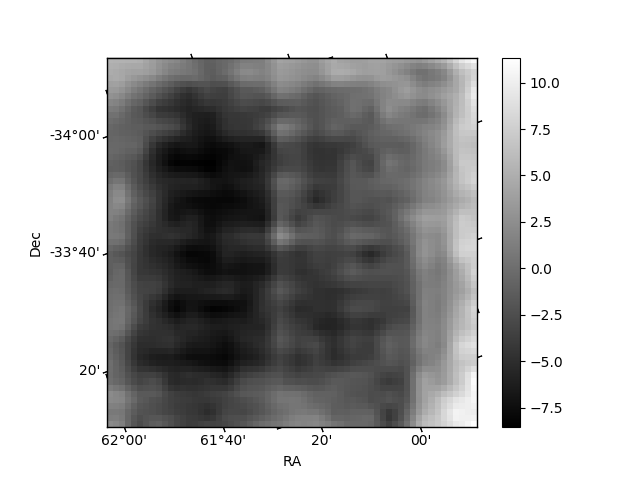
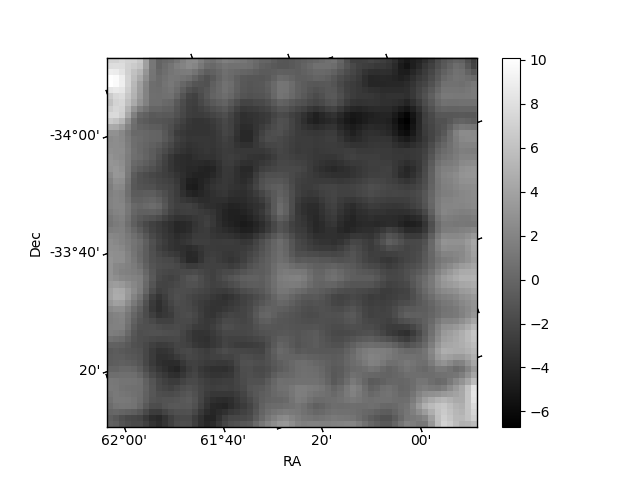
Histogram calculated using DETX and DETY for each event in the final _common_clean file
| Quadrant A | 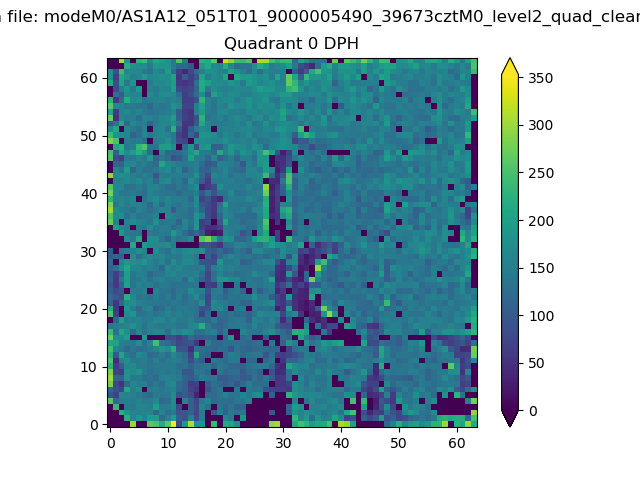 |
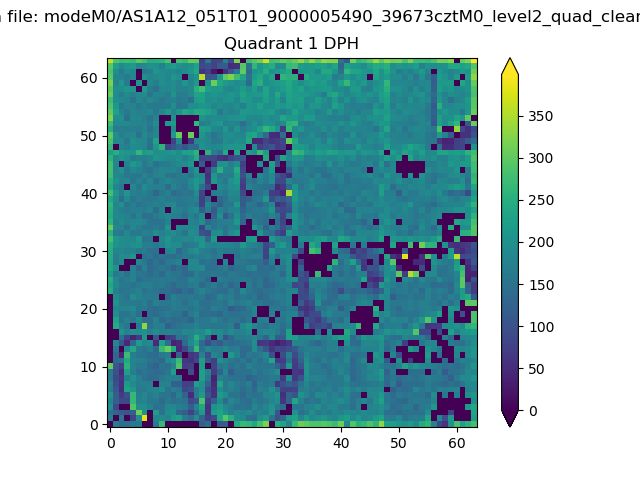 |
Quadrant B |
|---|---|---|---|
| Quadrant D | 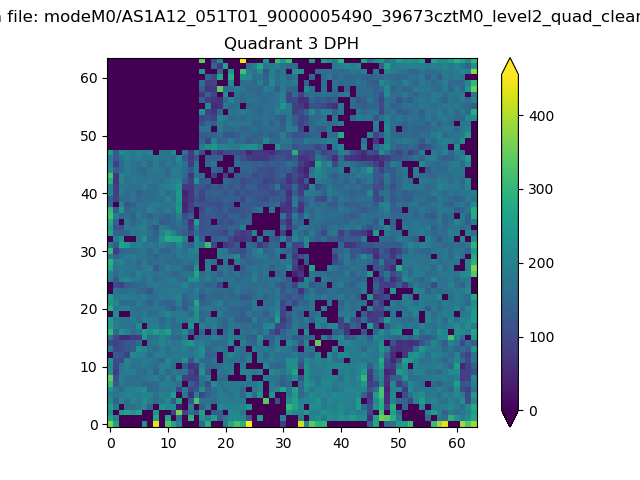 |
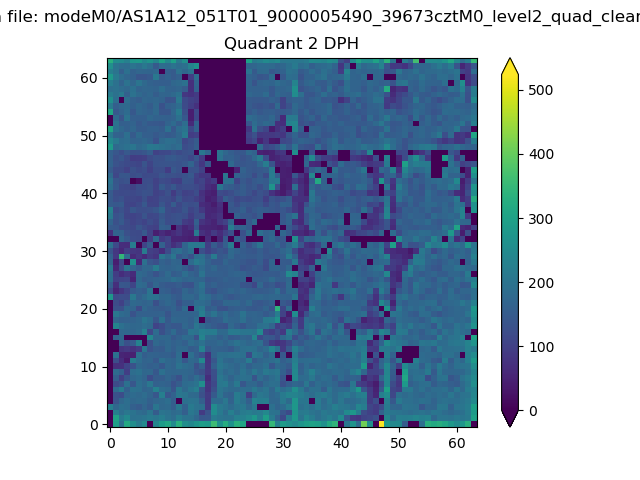 |
Quadrant C |
| Plot type | Count rate plots | Images |
|---|---|---|
| Comparison with Poisson distribution Blue bars denote a histogram of data divided into 1 sec bins. Red curve is a Poisson curve with rate = median count rate of data. |
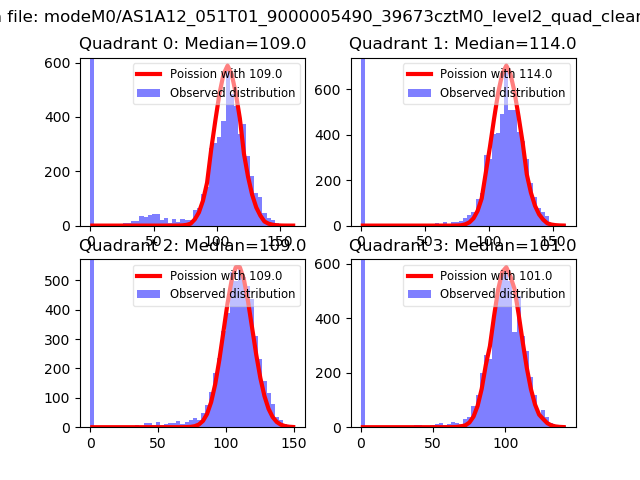 |
 |
| Quadrant-wise count rates Data is divided into 100 sec bins |
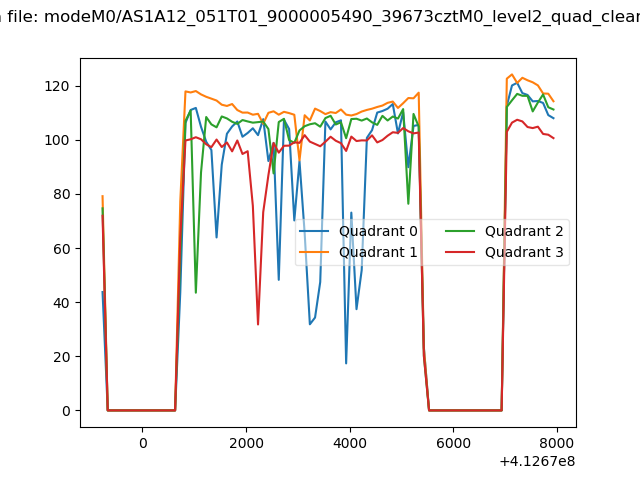 |
|
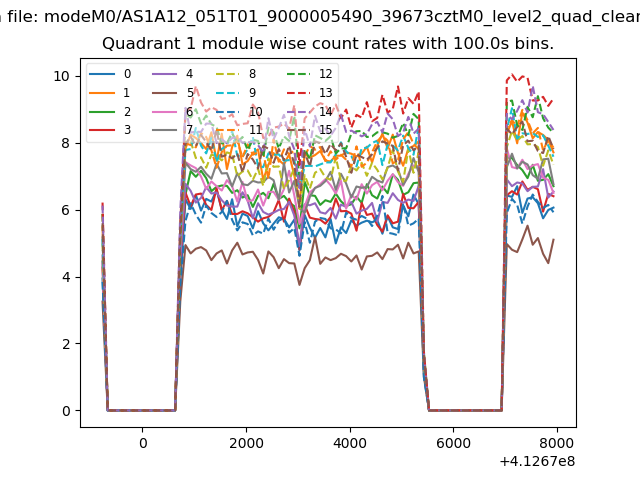
| Module-wise count rates for Quadrant A Data is divided into 100 sec bins |
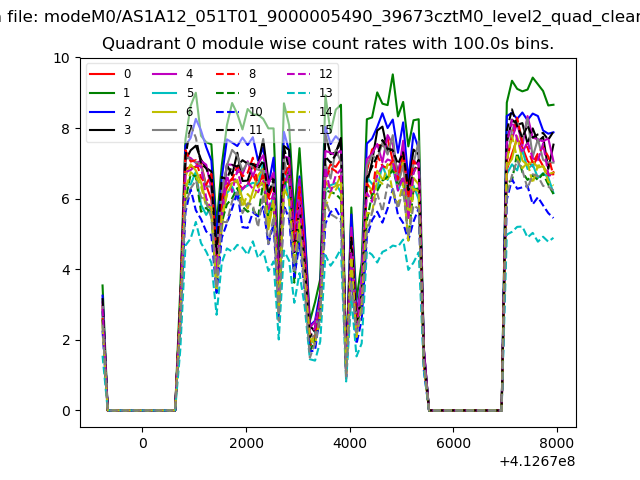 |
 |
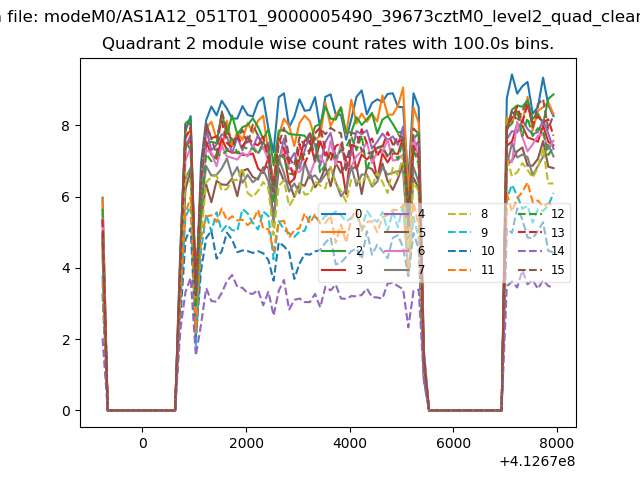
| Module-wise count rates for Quadrant B Data is divided into 100 sec bins |
 |
 |
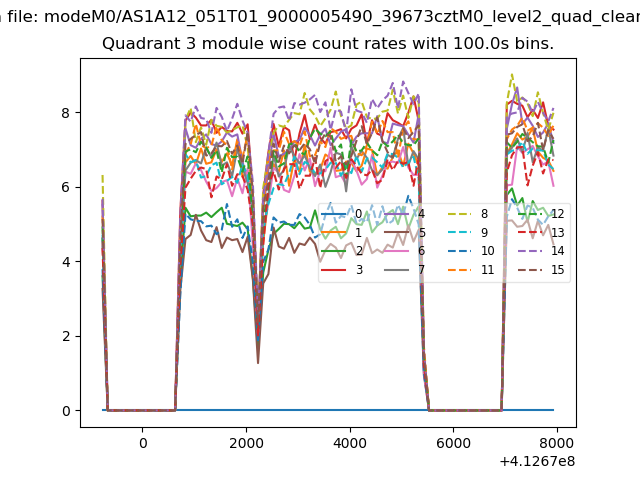
| Module-wise count rates for Quadrant C Data is divided into 100 sec bins |
 |
 |
| Module-wise count rates for Quadrant D Data is divided into 100 sec bins |
 |
 |
| Parameter | Plot |
|---|---|
| CZT HV Monitor | 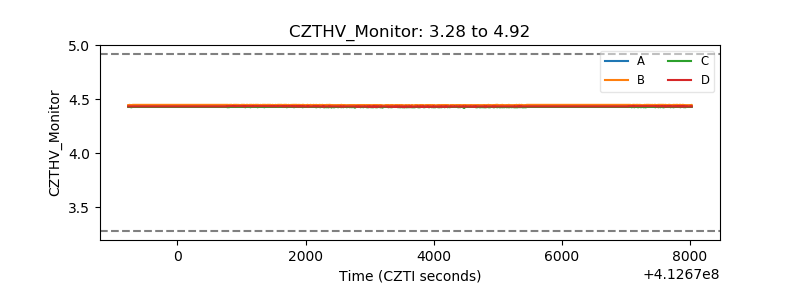 |
| D_VDD | 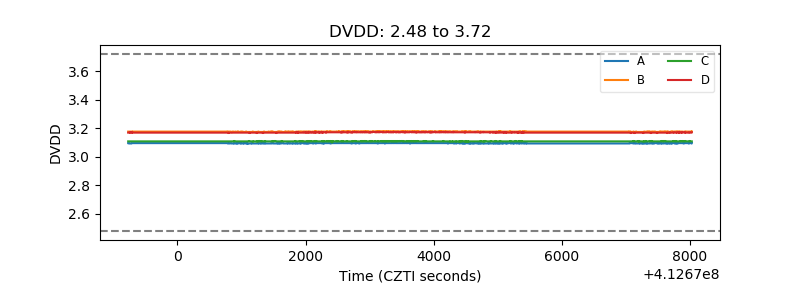 |
| Temperature 1 | 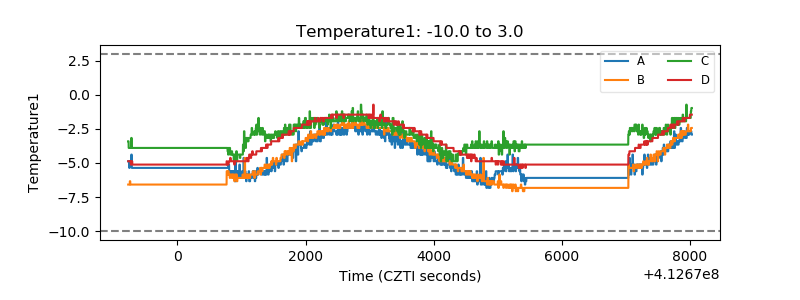 |
| Veto HV Monitor | 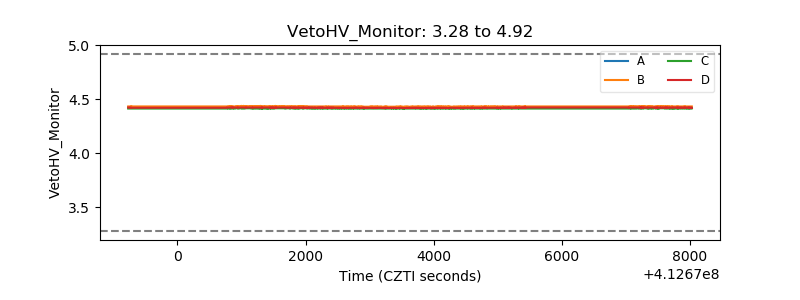 |
| Veto LLD | 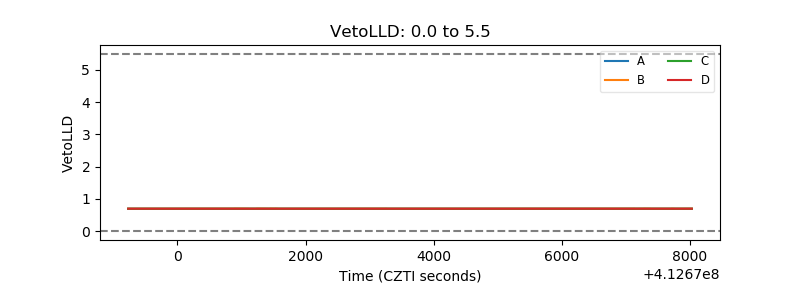 |
| Alpha Counter | 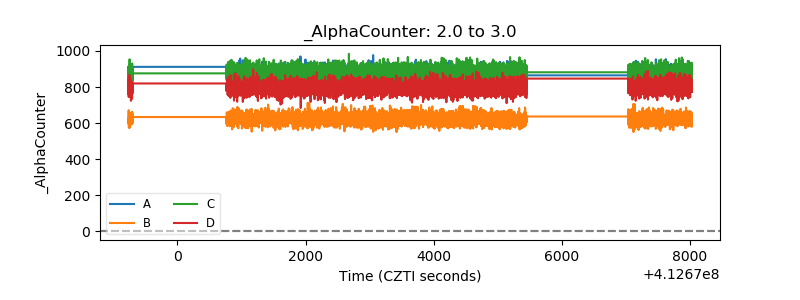 |
| _CPM_Rate | 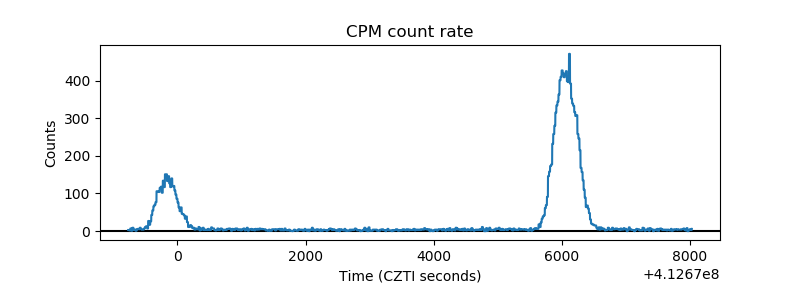 |
| CZT Counter | 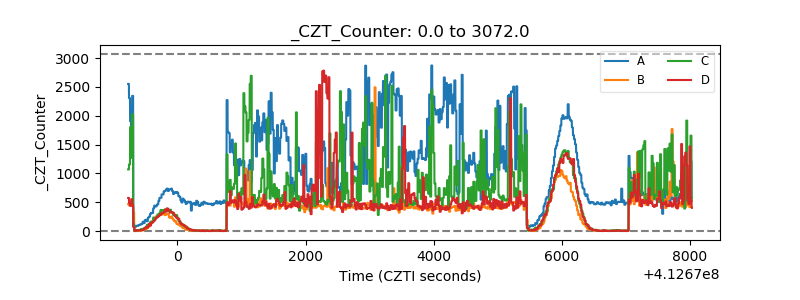 |
| +2.5 Volts monitor | 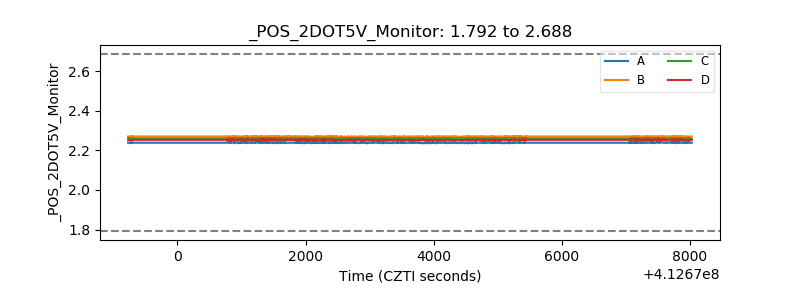 |
| +5 Volts monitor | 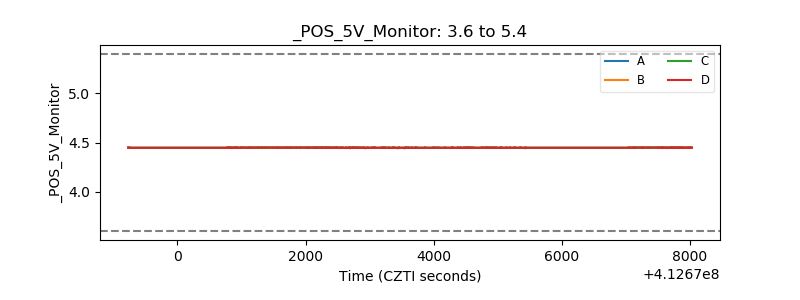 |
| _ROLL_ROT | 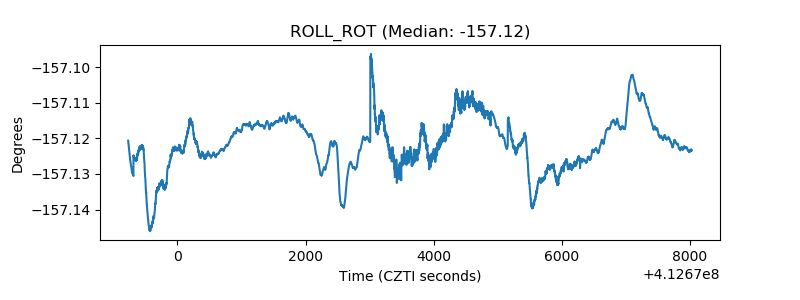 |
| _Roll_DEC | 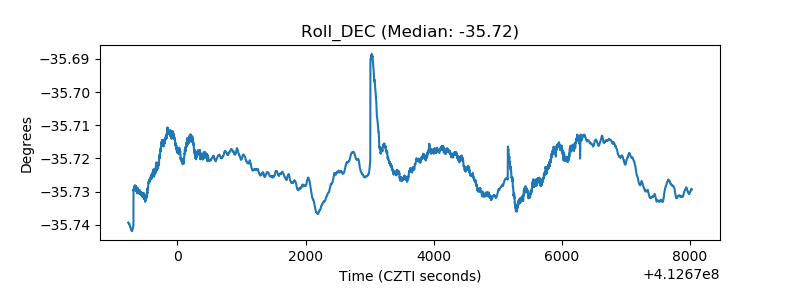 |
| _Roll_RA | 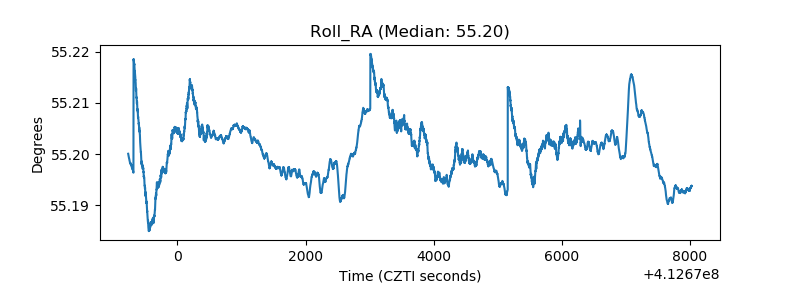 |
| Veto Counter | 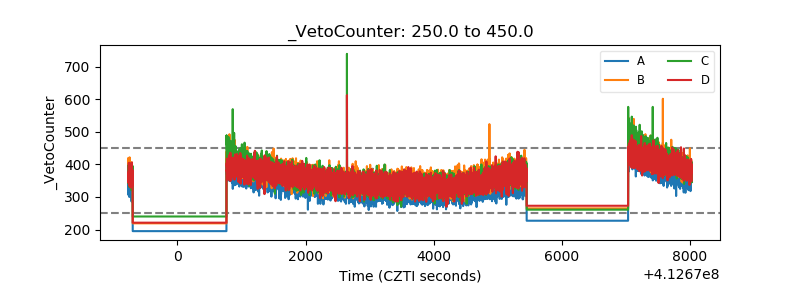 |