| Param | Original file | Final file |
|---|---|---|
| Filename | modeM0/AS1A12_051T01_9000005490_39674cztM0_level2.fits | modeM0/AS1A12_051T01_9000005490_39674cztM0_level2_quad_clean.evt |
| Size (bytes) | 430,061,760 | 88,695,360 |
| Size | 410.1 MB | 84.6 MB |
| Events in quadrant A | 3,715,883 | 609,652 |
| Events in quadrant B | 2,706,900 | 635,507 |
| Events in quadrant C | 5,848,003 | 503,073 |
| Events in quadrant D | 3,228,061 | 558,914 |
| Mode M9 | |||
|---|---|---|---|
| Quadrant | BADHDUFLAG | Total packets | Discarded packets |
| A | 0 | 29 | 0 |
| B | 0 | 29 | 0 |
| C | 0 | 29 | 0 |
| D | 0 | 30 | 0 |
| Mode M0 | |||
|---|---|---|---|
| Quadrant | BADHDUFLAG | Total packets | Discarded packets |
| A | 0 | 14477 | 3 |
| B | 0 | 11718 | 2 |
| C | 0 | 21123 | 2 |
| D | 0 | 13295 | 2 |
| Mode SS | |||
|---|---|---|---|
| Quadrant | BADHDUFLAG | Total packets | Discarded packets |
| A | 0 | 110 | 0 |
| B | 0 | 110 | 0 |
| C | 0 | 110 | 0 |
| D | 0 | 110 | 0 |
| Quadrant | Total seconds | Saturated seconds | Saturation percentage |
|---|---|---|---|
| A | 5406 | 188 | 3.477617% |
| B | 5406 | 27 | 0.499445% |
| C | 5406 | 1090 | 20.162782% |
| D | 5406 | 132 | 2.441731% |
Noise dominated data is calculated using 1-second bins in cleaned event files. If a bin has >2000 counts, and if more than 50% of those come from <1% of pixels, then it is considered to be noise-dominated and hence unusable.
| Quadrant | # 1 sec bins | Bins with >0 counts | Bins with >2000 counts | High rate bins dominated by noise | Noise dominated (total time) | Noise dominated (detector-on time) | Marked lightcurve |
|---|---|---|---|---|---|---|---|
| A | 7139 | 5407 | 145 | 145 | 2.03% | 2.68% | 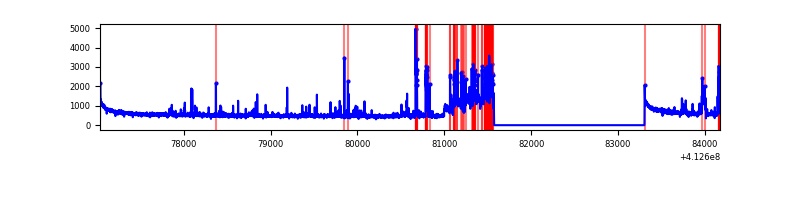 |
| B | 7139 | 5407 | 12 | 12 | 0.17% | 0.22% | 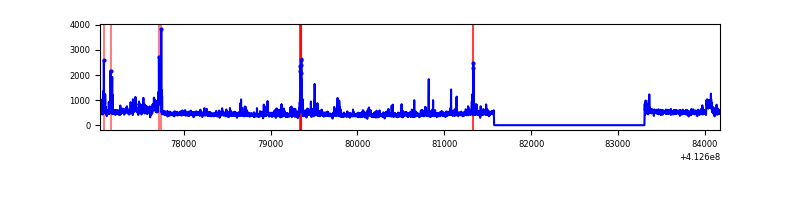 |
| C | 7139 | 5407 | 656 | 656 | 9.19% | 12.13% | 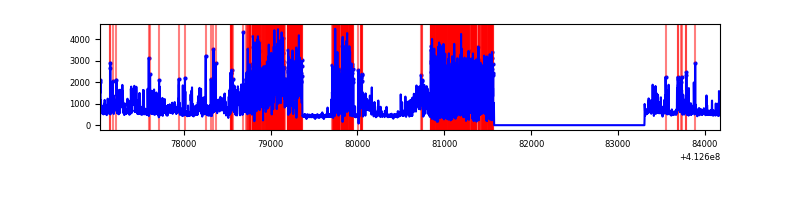 |
| D | 7139 | 5407 | 99 | 99 | 1.39% | 1.83% | 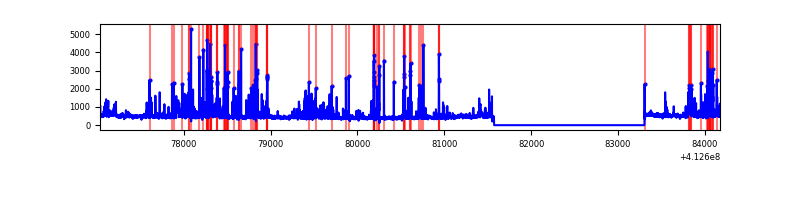 |
Top three noisy pixels from each quadrant. If the there are fewer than three noisy pixels in the level2.evt file, extra rows are filled as -1
| Pixel properties | Quadrant properties | ||||||
|---|---|---|---|---|---|---|---|
| Quadrant | DetID | PixID | Counts | Sigma | Mean | Median | Sigma |
| A | 15 | 222 | 732596 | 5869.48 | 609 | 597 | 124.7 |
| A | 10 | 83 | 455858 | 3650.48 | 609 | 597 | 124.7 |
| A | 15 | 174 | 147694 | 1179.49 | 609 | 597 | 124.7 |
| B | 5 | 172 | 293243 | 2496.56 | 606 | 590 | 117.2 |
| B | 12 | 111 | 14636 | 119.82 | 606 | 590 | 117.2 |
| B | 11 | 111 | 13538 | 110.46 | 606 | 590 | 117.2 |
| C | 15 | 208 | 2857188 | 22644.2 | 536 | 539 | 126.2 |
| C | 9 | 187 | 669488 | 5302.65 | 536 | 539 | 126.2 |
| C | 15 | 214 | 206985 | 1636.46 | 536 | 539 | 126.2 |
| D | 13 | 249 | 468156 | 3223.24 | 593 | 576 | 145.1 |
| D | 12 | 233 | 249586 | 1716.54 | 593 | 576 | 145.1 |
| D | 2 | 250 | 73325 | 501.49 | 593 | 576 | 145.1 |
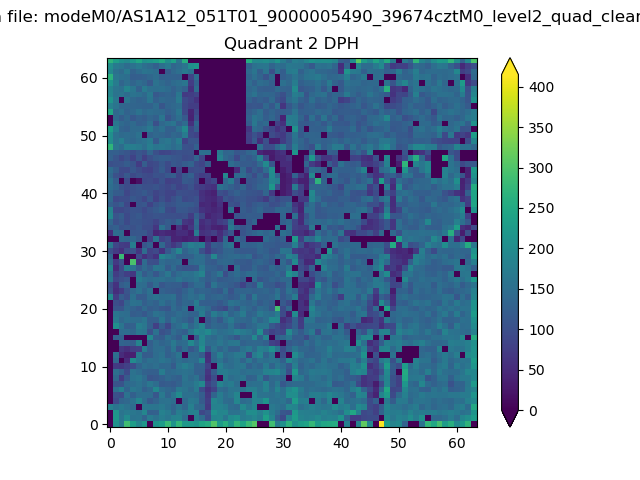
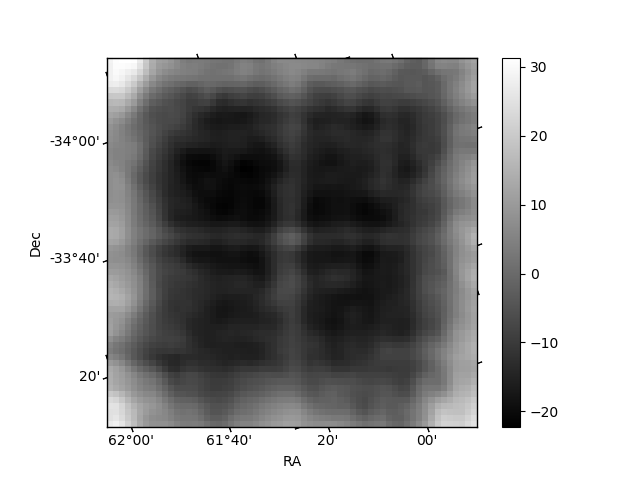
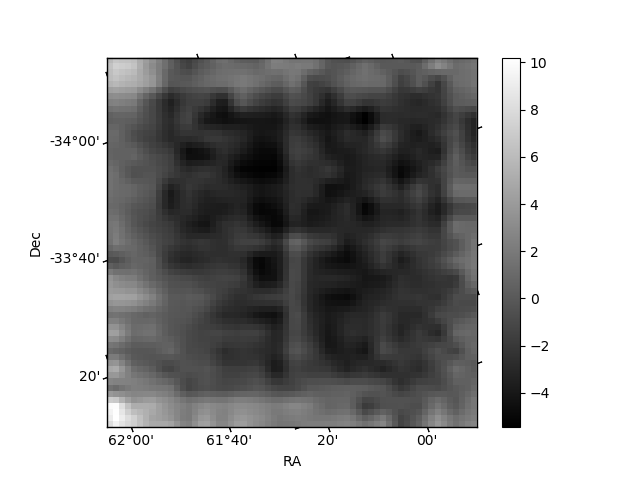
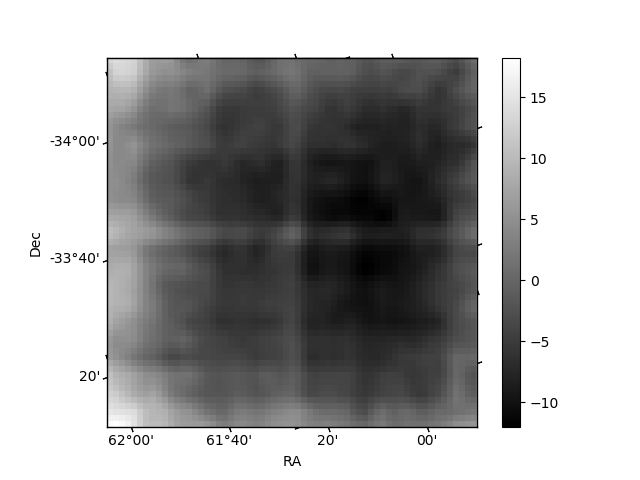
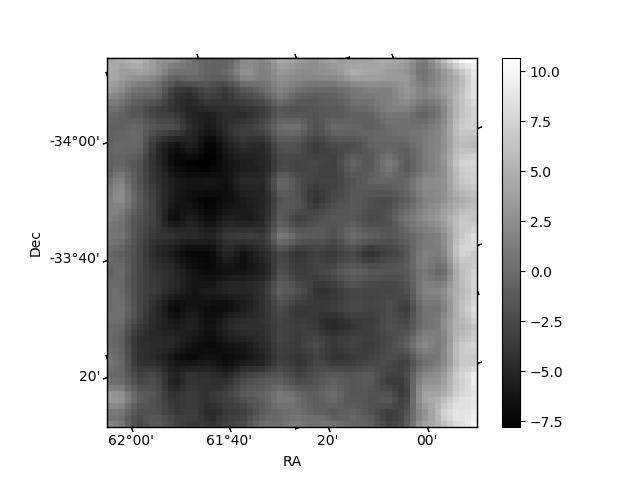
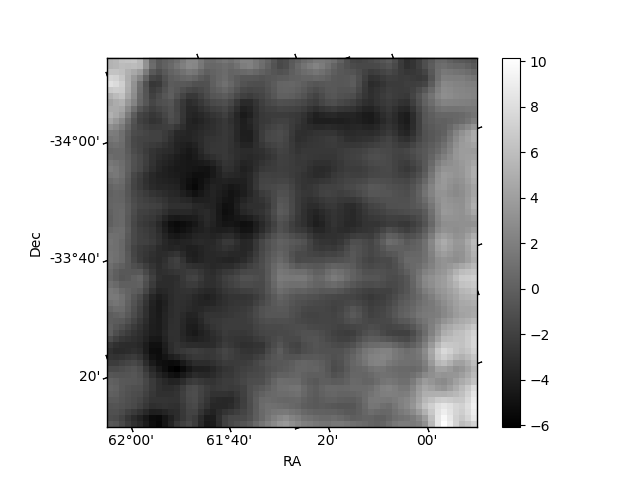
Histogram calculated using DETX and DETY for each event in the final _common_clean file
| Quadrant A | 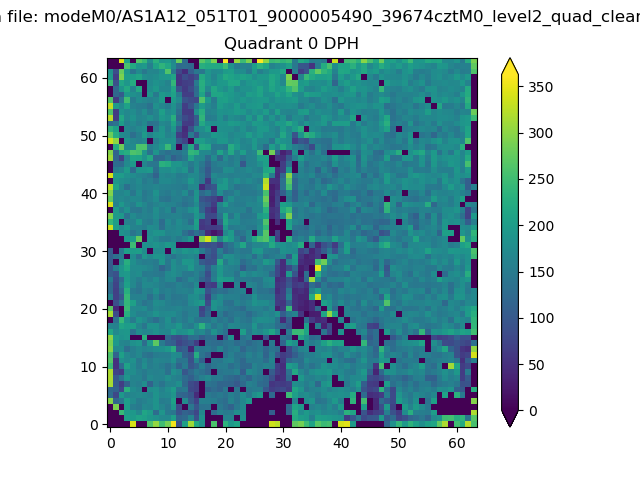 |
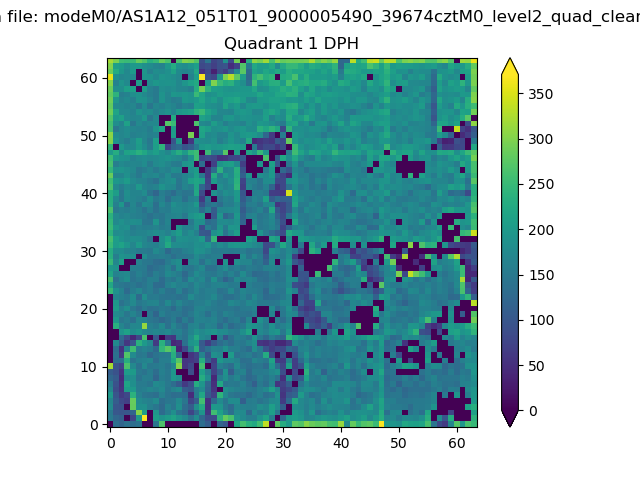 |
Quadrant B |
|---|---|---|---|
| Quadrant D | 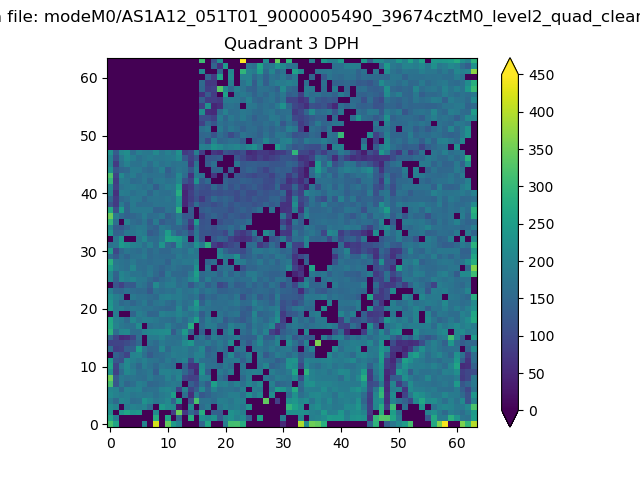 |
 |
Quadrant C |
| Plot type | Count rate plots | Images |
|---|---|---|
| Comparison with Poisson distribution Blue bars denote a histogram of data divided into 1 sec bins. Red curve is a Poisson curve with rate = median count rate of data. |
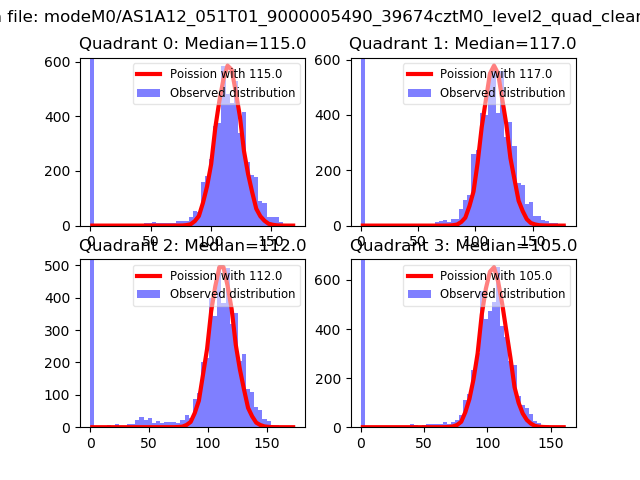 |
 |
| Quadrant-wise count rates Data is divided into 100 sec bins |
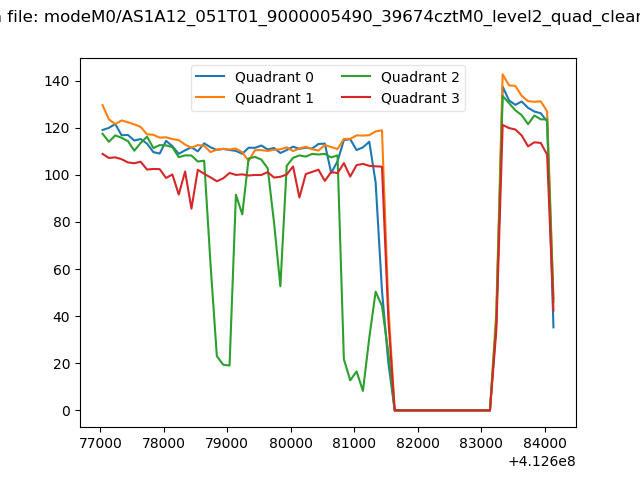 |
|
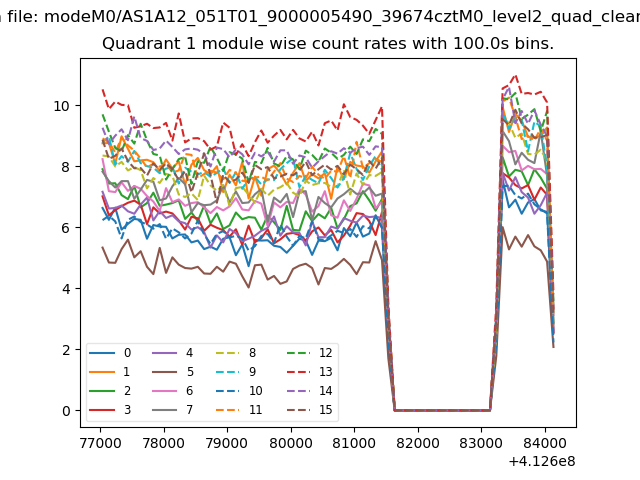
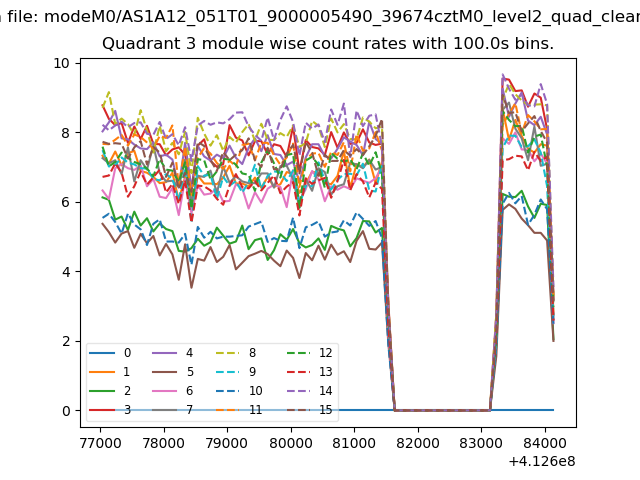
| Module-wise count rates for Quadrant A Data is divided into 100 sec bins |
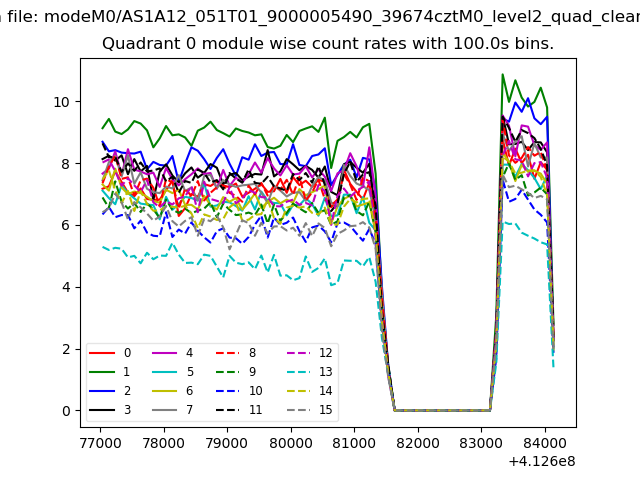 |
 |
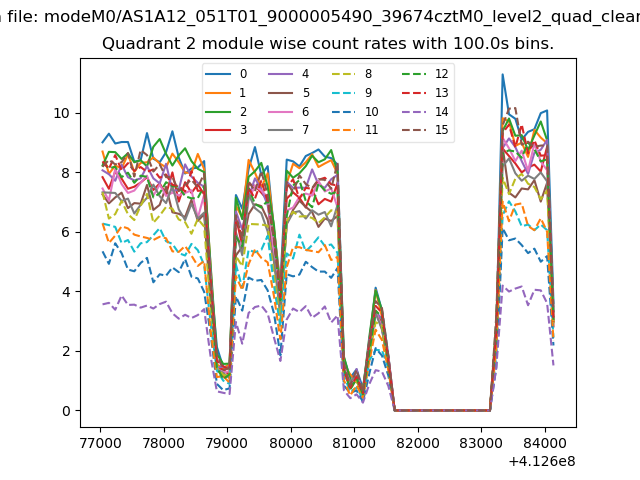
| Module-wise count rates for Quadrant B Data is divided into 100 sec bins |
 |
 |
| Module-wise count rates for Quadrant C Data is divided into 100 sec bins |
 |
 |
| Module-wise count rates for Quadrant D Data is divided into 100 sec bins |
 |
 |
| Parameter | Plot |
|---|---|
| CZT HV Monitor | 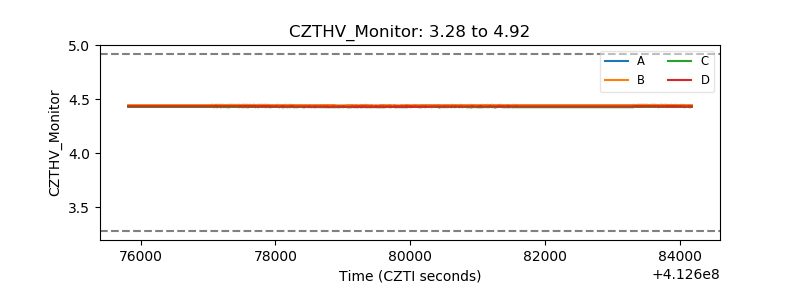 |
| D_VDD | 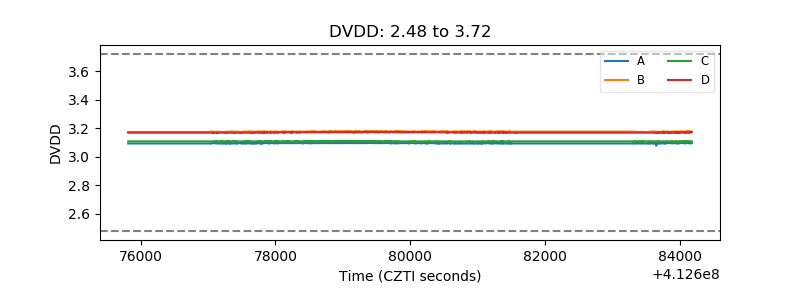 |
| Temperature 1 | 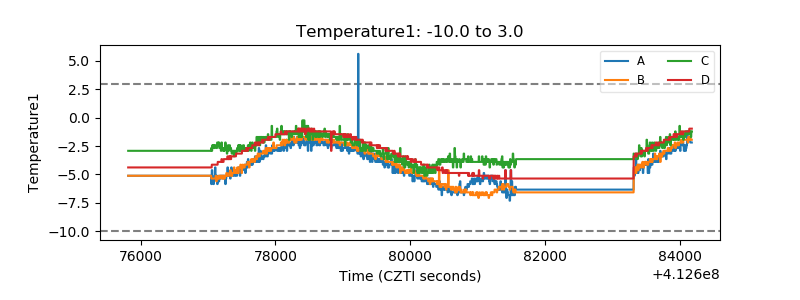 |
| Veto HV Monitor | 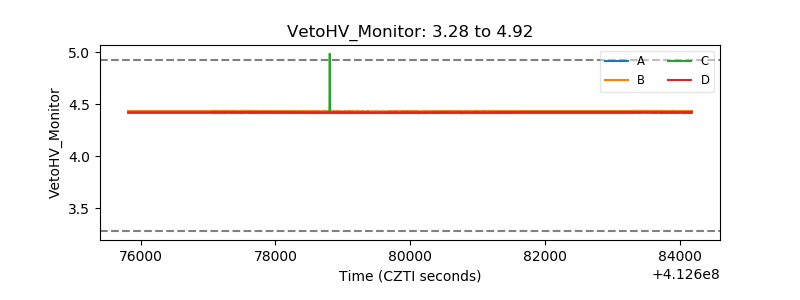 |
| Veto LLD | 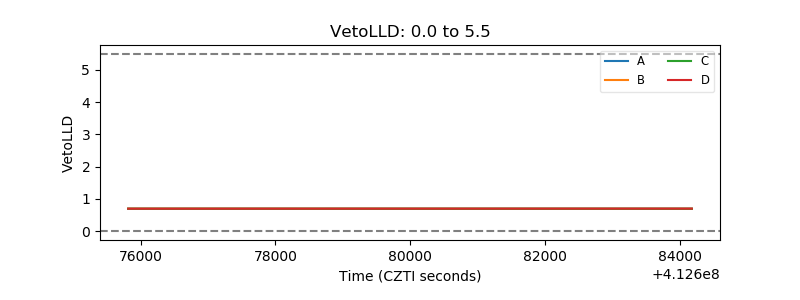 |
| Alpha Counter | 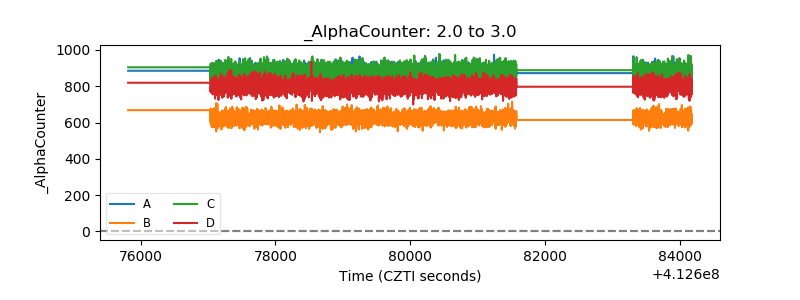 |
| _CPM_Rate | 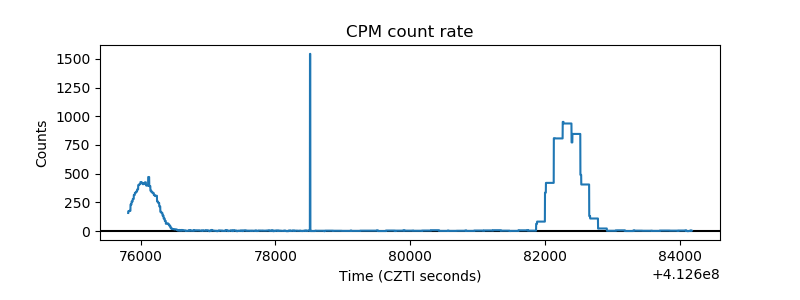 |
| CZT Counter | 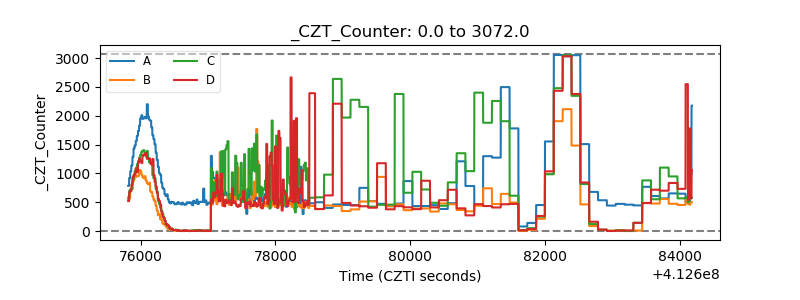 |
| +2.5 Volts monitor | 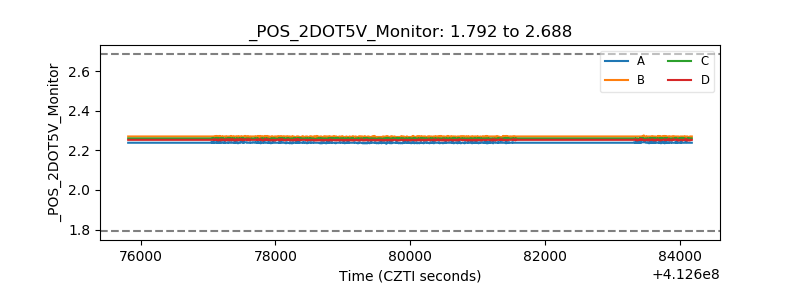 |
| +5 Volts monitor | 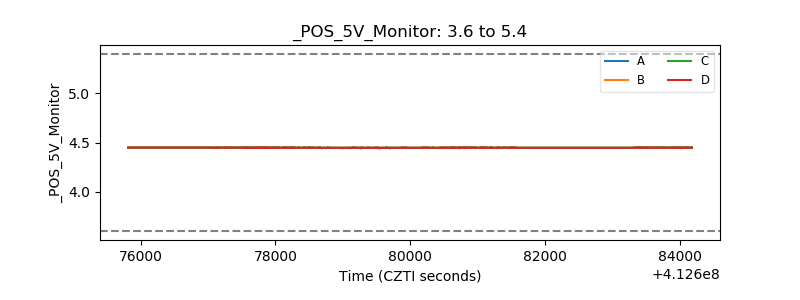 |
| _ROLL_ROT | 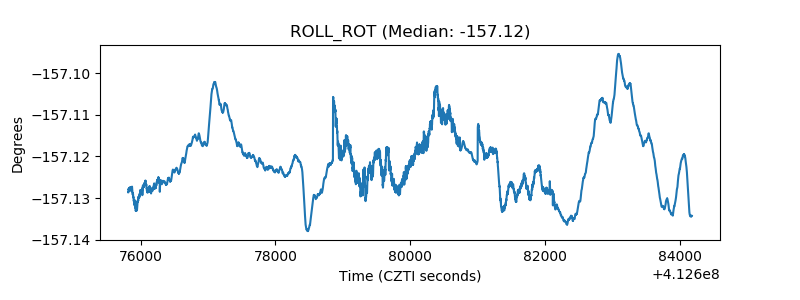 |
| _Roll_DEC | 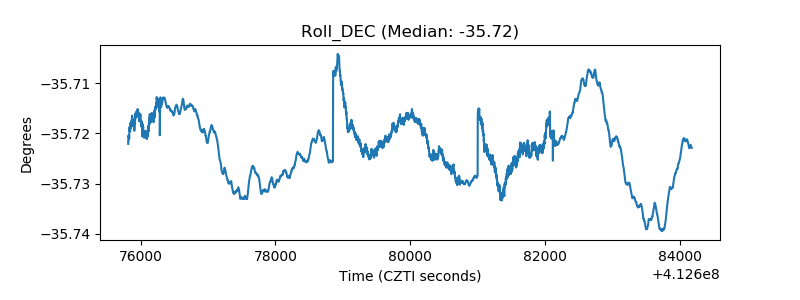 |
| _Roll_RA | 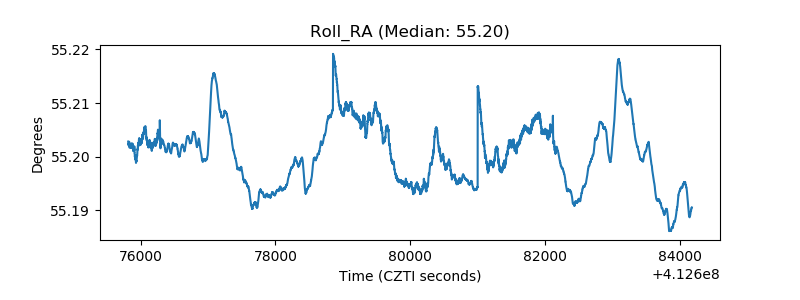 |
| Veto Counter | 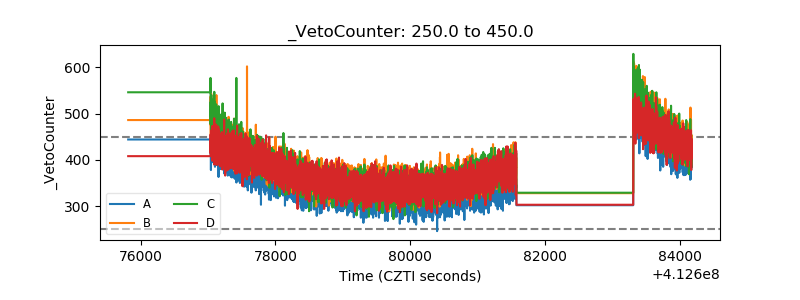 |