| Param | Original file | Final file |
|---|---|---|
| Filename | modeM0/AS1A12_051T01_9000005490_39676cztM0_level2.fits | modeM0/AS1A12_051T01_9000005490_39676cztM0_level2_quad_clean.evt |
| Size (bytes) | 481,861,440 | 89,069,760 |
| Size | 459.5 MB | 84.9 MB |
| Events in quadrant A | 6,250,761 | 507,593 |
| Events in quadrant B | 3,197,365 | 650,870 |
| Events in quadrant C | 4,818,188 | 590,425 |
| Events in quadrant D | 3,160,600 | 577,724 |
| Mode M9 | |||
|---|---|---|---|
| Quadrant | BADHDUFLAG | Total packets | Discarded packets |
| A | 0 | 18 | 0 |
| B | 0 | 18 | 0 |
| C | 0 | 18 | 0 |
| D | 0 | 19 | 0 |
| Mode M0 | |||
|---|---|---|---|
| Quadrant | BADHDUFLAG | Total packets | Discarded packets |
| A | 0 | 22185 | 3 |
| B | 0 | 12937 | 2 |
| C | 0 | 17892 | 2 |
| D | 0 | 12941 | 2 |
| Mode SS | |||
|---|---|---|---|
| Quadrant | BADHDUFLAG | Total packets | Discarded packets |
| A | 0 | 110 | 0 |
| B | 0 | 110 | 0 |
| C | 0 | 110 | 0 |
| D | 0 | 110 | 0 |
| Quadrant | Total seconds | Saturated seconds | Saturation percentage |
|---|---|---|---|
| A | 5282 | 1184 | 22.415752% |
| B | 5282 | 131 | 2.480121% |
| C | 5282 | 421 | 7.970466% |
| D | 5282 | 94 | 1.779629% |
Noise dominated data is calculated using 1-second bins in cleaned event files. If a bin has >2000 counts, and if more than 50% of those come from <1% of pixels, then it is considered to be noise-dominated and hence unusable.
| Quadrant | # 1 sec bins | Bins with >0 counts | Bins with >2000 counts | High rate bins dominated by noise | Noise dominated (total time) | Noise dominated (detector-on time) | Marked lightcurve |
|---|---|---|---|---|---|---|---|
| A | 7137 | 5283 | 970 | 970 | 13.59% | 18.36% | 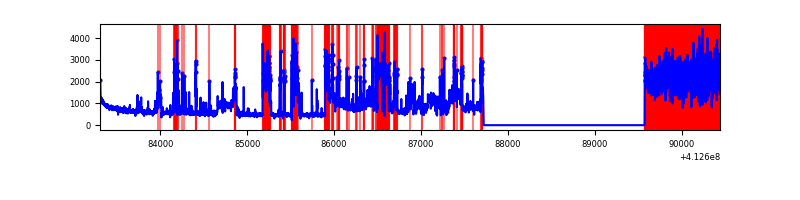 |
| B | 7137 | 5283 | 91 | 91 | 1.28% | 1.72% | 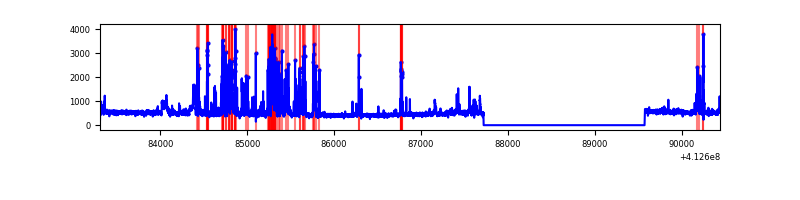 |
| C | 7137 | 5283 | 368 | 368 | 5.16% | 6.97% | 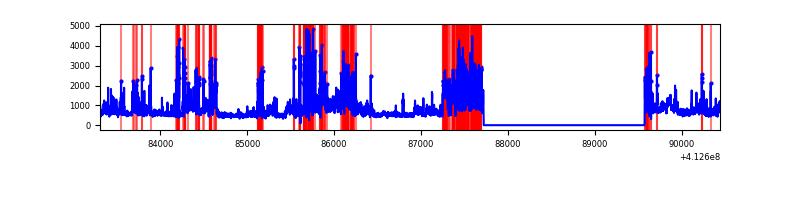 |
| D | 7137 | 5283 | 77 | 77 | 1.08% | 1.46% | 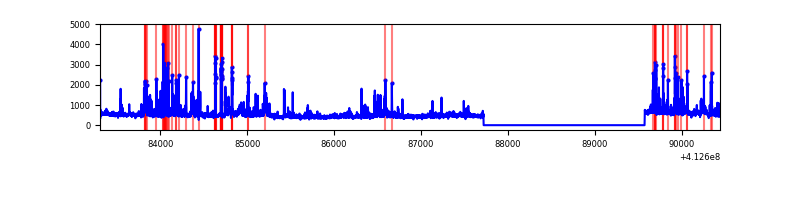 |
Top three noisy pixels from each quadrant. If the there are fewer than three noisy pixels in the level2.evt file, extra rows are filled as -1
| Pixel properties | Quadrant properties | ||||||
|---|---|---|---|---|---|---|---|
| Quadrant | DetID | PixID | Counts | Sigma | Mean | Median | Sigma |
| A | 15 | 222 | 3072879 | 26954.81 | 565 | 557 | 114.0 |
| A | 15 | 174 | 558376 | 4893.99 | 565 | 557 | 114.0 |
| A | 10 | 83 | 412674 | 3615.68 | 565 | 557 | 114.0 |
| B | 5 | 172 | 683081 | 5855.28 | 605 | 591 | 116.6 |
| B | 5 | 255 | 85776 | 730.83 | 605 | 591 | 116.6 |
| B | 15 | 85 | 35304 | 297.81 | 605 | 591 | 116.6 |
| C | 15 | 208 | 1626250 | 12146.58 | 576 | 580 | 133.8 |
| C | 9 | 187 | 701345 | 5235.93 | 576 | 580 | 133.8 |
| C | 15 | 214 | 216628 | 1614.25 | 576 | 580 | 133.8 |
| D | 13 | 249 | 207755 | 1419.98 | 595 | 580 | 145.9 |
| D | 12 | 233 | 177866 | 1215.12 | 595 | 580 | 145.9 |
| D | 2 | 250 | 135933 | 927.71 | 595 | 580 | 145.9 |
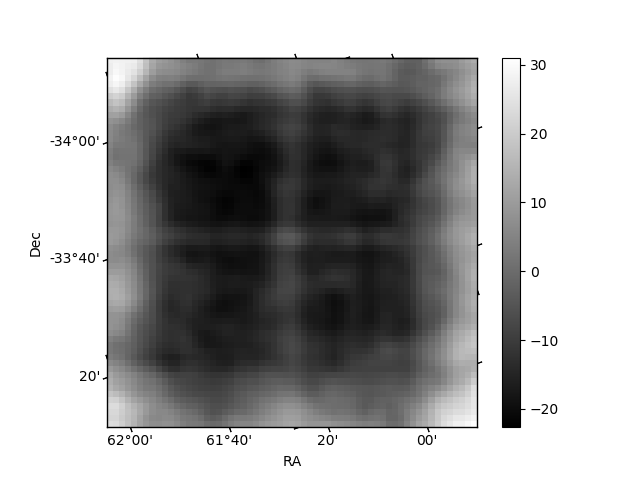
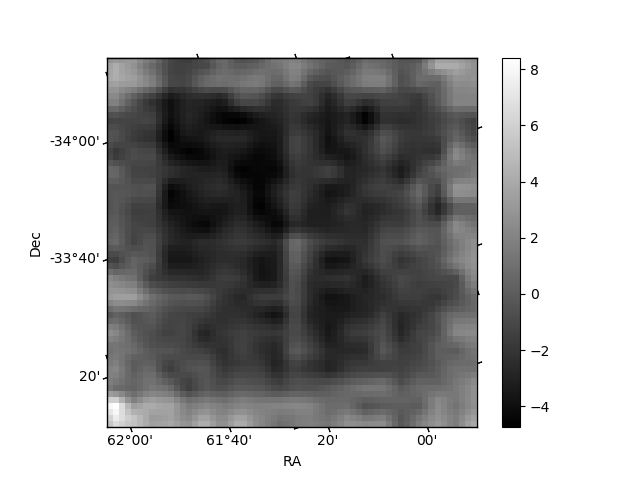
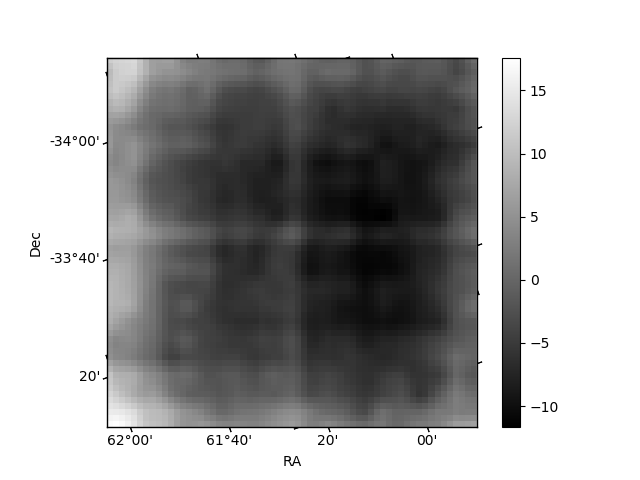
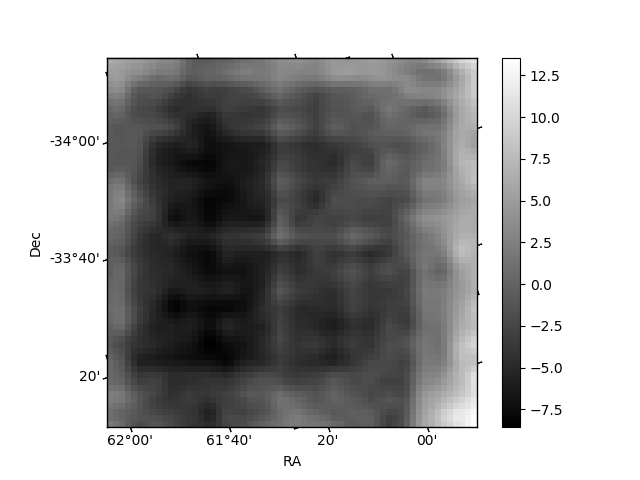
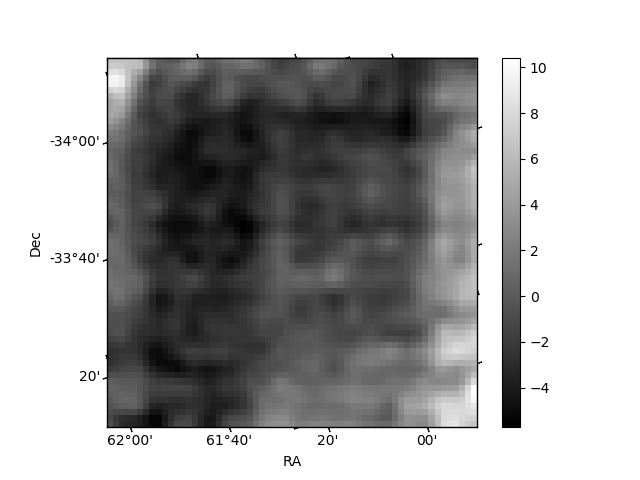
Histogram calculated using DETX and DETY for each event in the final _common_clean file
| Quadrant A | 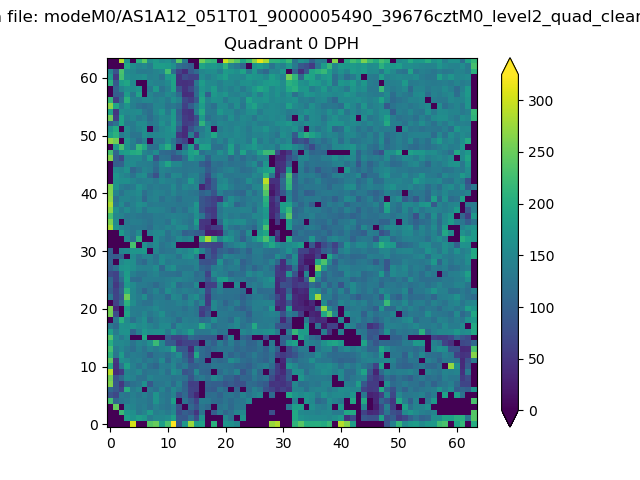 |
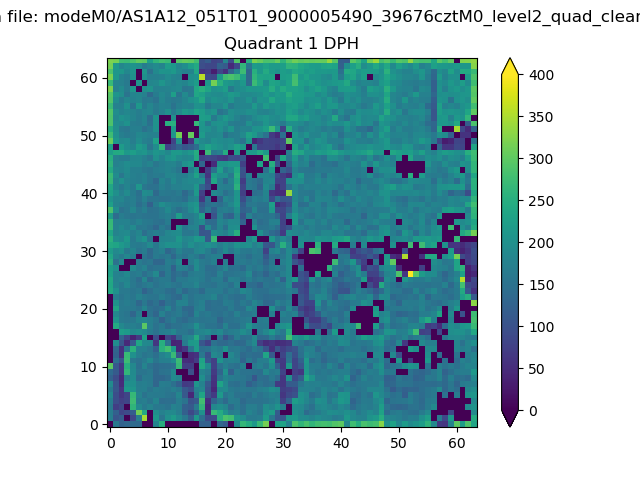 |
Quadrant B |
|---|---|---|---|
| Quadrant D | 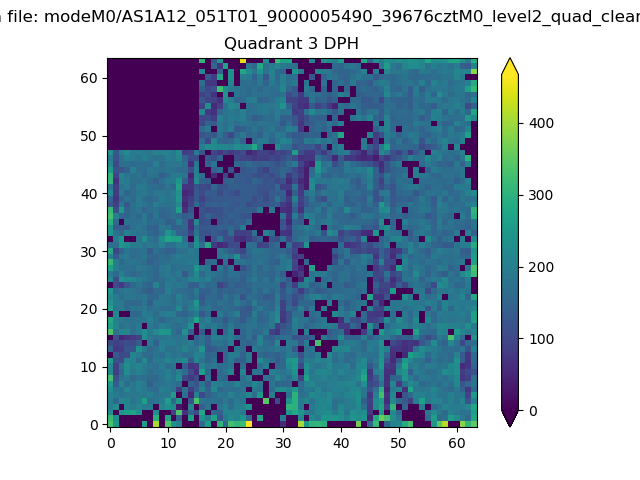 |
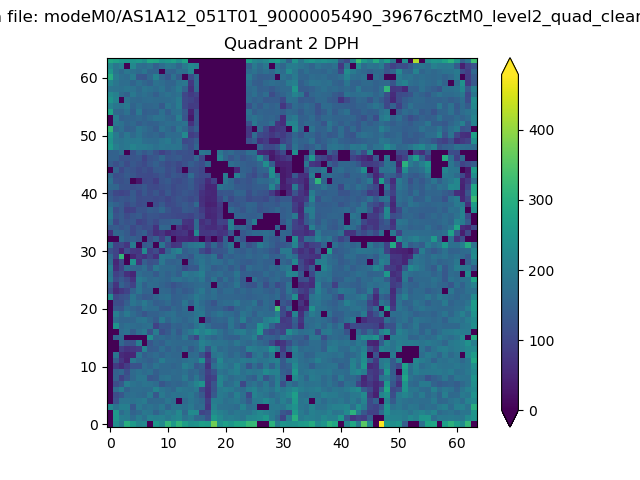 |
Quadrant C |
| Plot type | Count rate plots | Images |
|---|---|---|
| Comparison with Poisson distribution Blue bars denote a histogram of data divided into 1 sec bins. Red curve is a Poisson curve with rate = median count rate of data. |
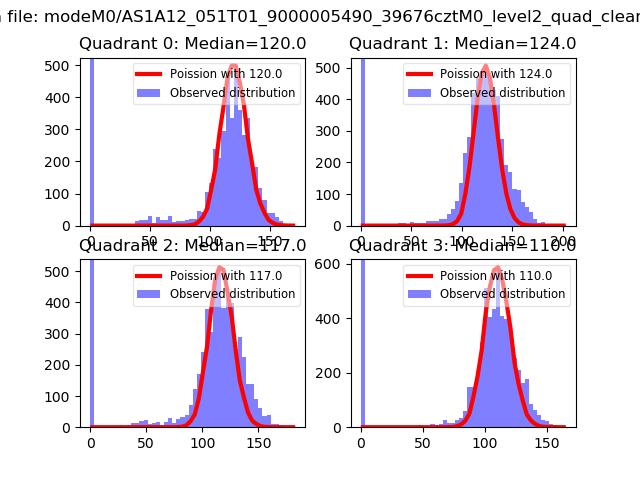 |
 |
| Quadrant-wise count rates Data is divided into 100 sec bins |
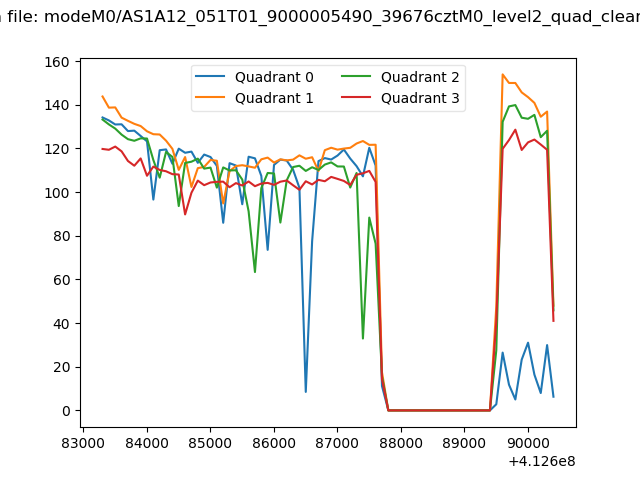 |
|
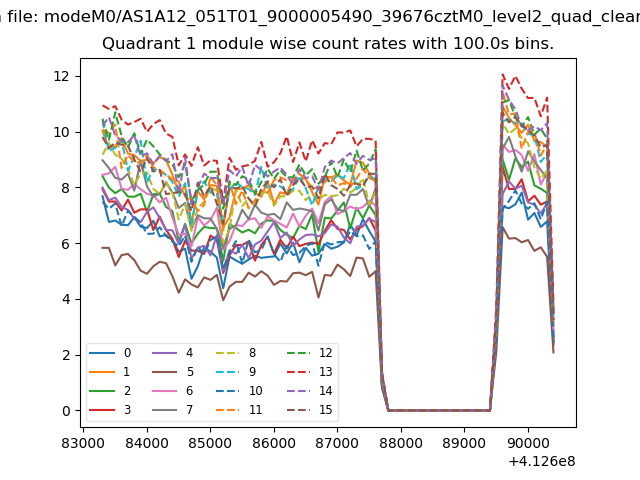
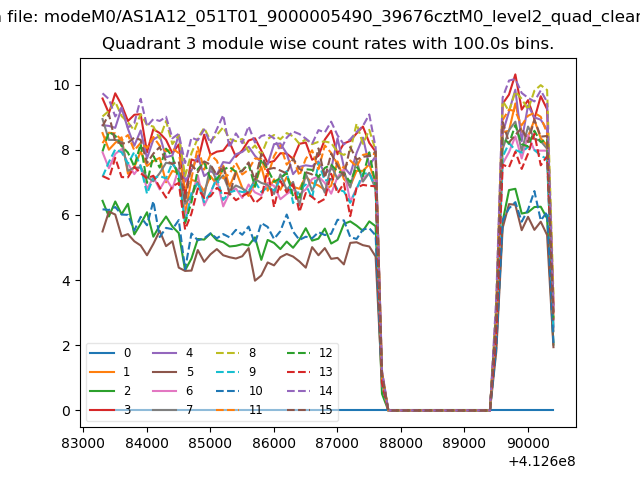
| Module-wise count rates for Quadrant A Data is divided into 100 sec bins |
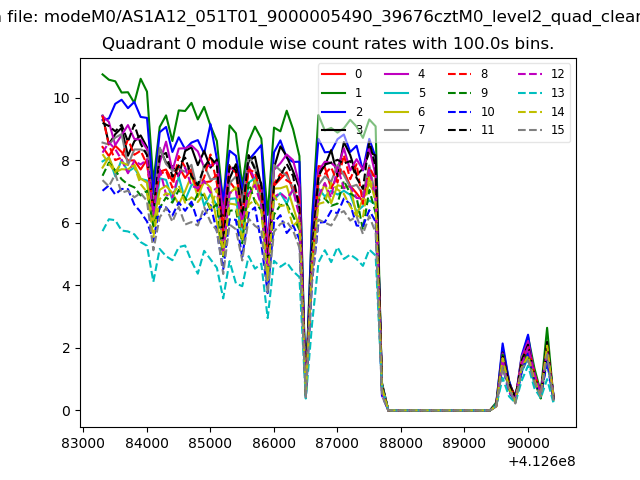 |
 |
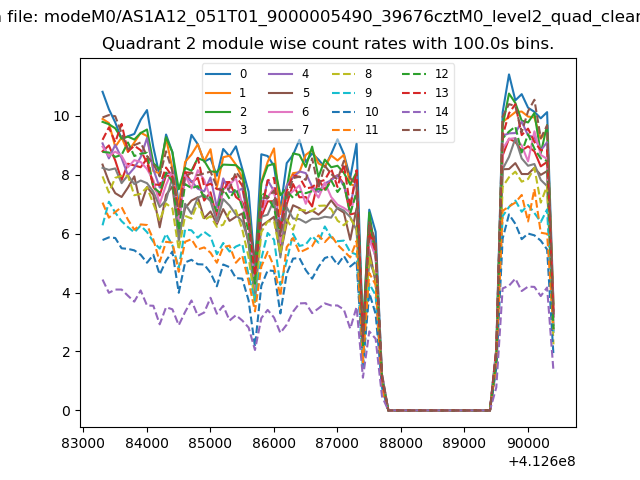
| Module-wise count rates for Quadrant B Data is divided into 100 sec bins |
 |
 |
| Module-wise count rates for Quadrant C Data is divided into 100 sec bins |
 |
 |
| Module-wise count rates for Quadrant D Data is divided into 100 sec bins |
 |
 |
| Parameter | Plot |
|---|---|
| CZT HV Monitor | 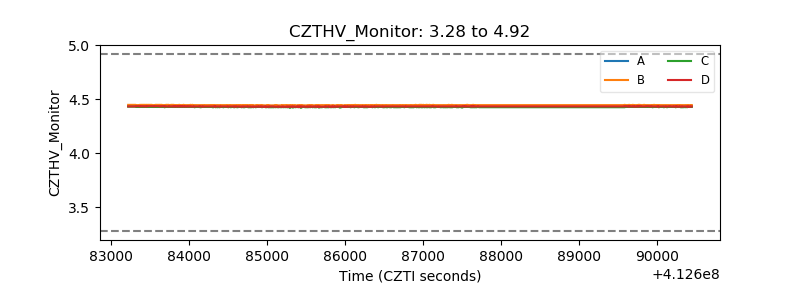 |
| D_VDD | 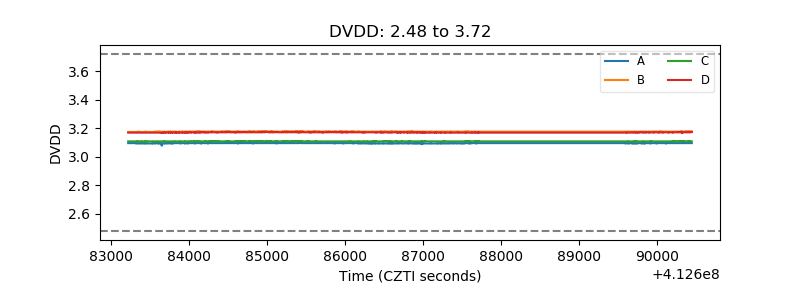 |
| Temperature 1 | 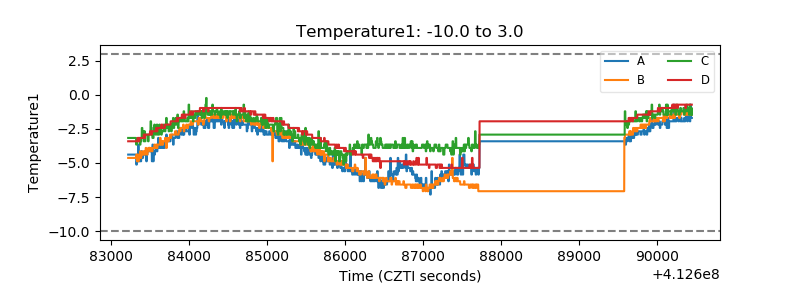 |
| Veto HV Monitor | 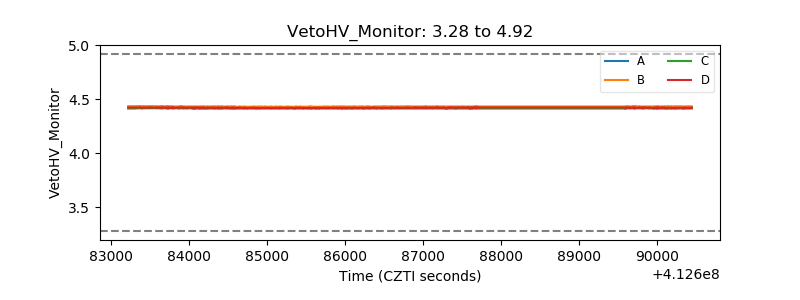 |
| Veto LLD | 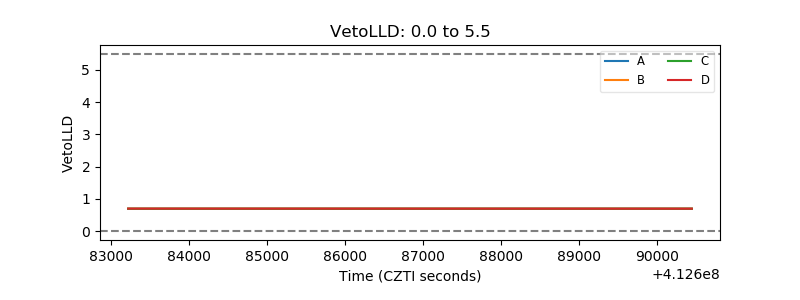 |
| Alpha Counter | 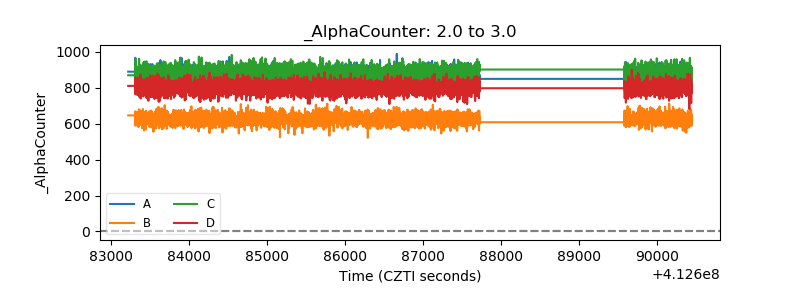 |
| _CPM_Rate | 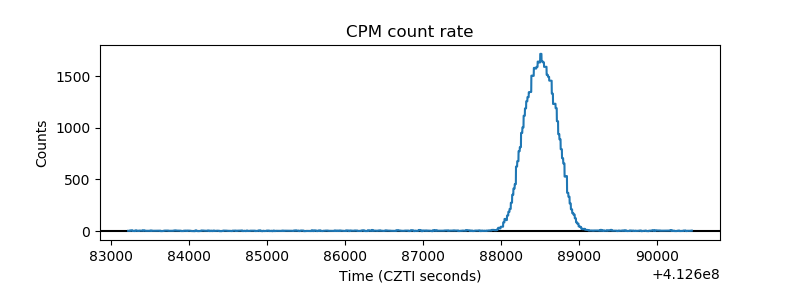 |
| CZT Counter | 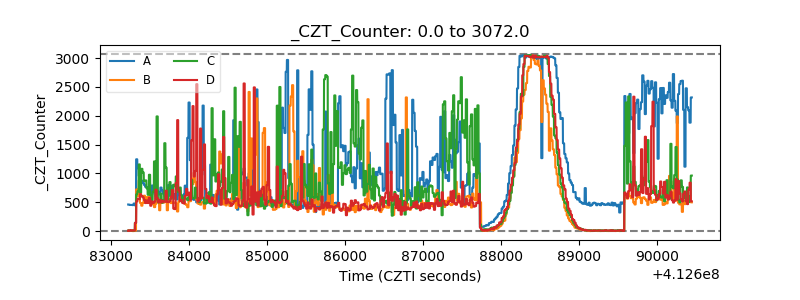 |
| +2.5 Volts monitor | 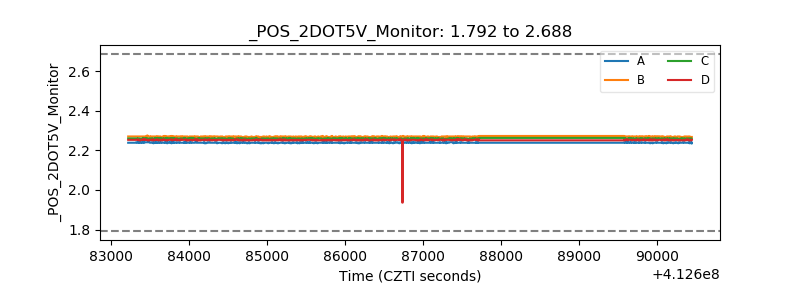 |
| +5 Volts monitor | 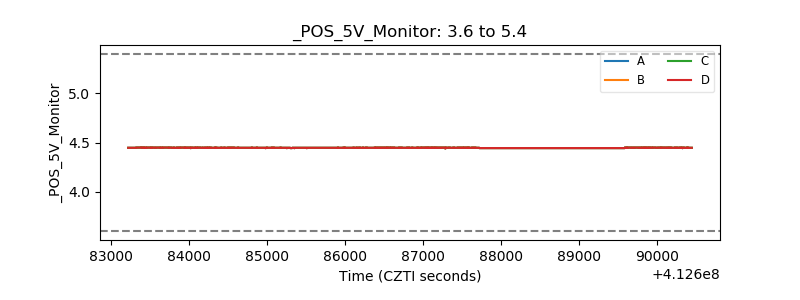 |
| _ROLL_ROT |  |
| _Roll_DEC | 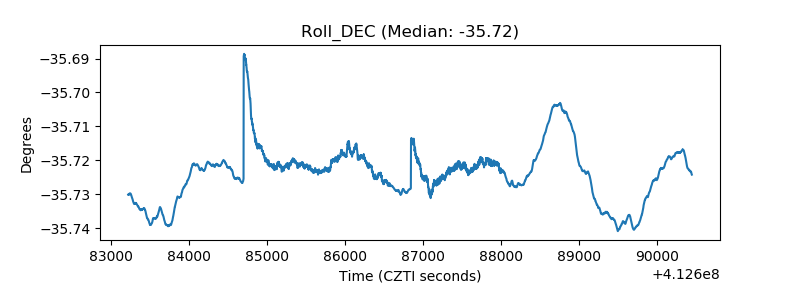 |
| _Roll_RA | 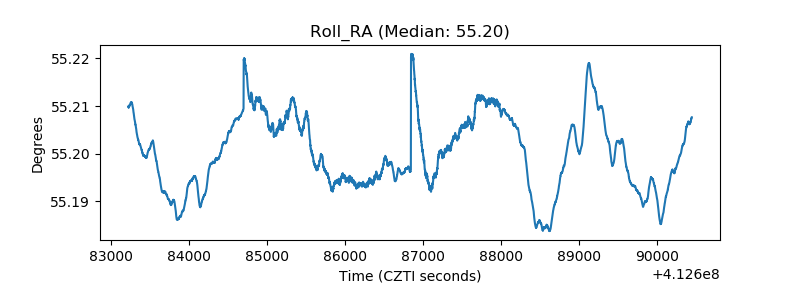 |
| Veto Counter | 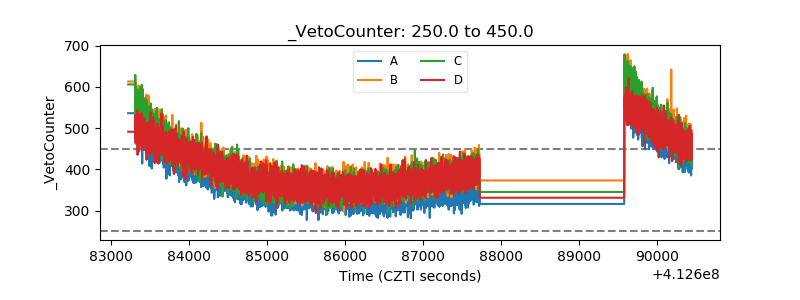 |