| Param | Original file | Final file |
|---|---|---|
| Filename | modeM0/AS1A12_051T01_9000005490_39677cztM0_level2.fits | modeM0/AS1A12_051T01_9000005490_39677cztM0_level2_quad_clean.evt |
| Size (bytes) | 658,229,760 | 81,506,880 |
| Size | 627.7 MB | 77.7 MB |
| Events in quadrant A | 12,302,539 | 165,193 |
| Events in quadrant B | 3,045,987 | 696,607 |
| Events in quadrant C | 5,506,302 | 623,451 |
| Events in quadrant D | 3,097,577 | 610,245 |
| Mode M9 | |||
|---|---|---|---|
| Quadrant | BADHDUFLAG | Total packets | Discarded packets |
| A | 0 | 20 | 0 |
| B | 0 | 20 | 0 |
| C | 0 | 20 | 0 |
| D | 0 | 20 | 0 |
| Mode M0 | |||
|---|---|---|---|
| Quadrant | BADHDUFLAG | Total packets | Discarded packets |
| A | 0 | 40169 | 2 |
| B | 0 | 12480 | 1 |
| C | 0 | 20012 | 1 |
| D | 0 | 12819 | 1 |
| Mode SS | |||
|---|---|---|---|
| Quadrant | BADHDUFLAG | Total packets | Discarded packets |
| A | 0 | 108 | 0 |
| B | 0 | 108 | 0 |
| C | 0 | 108 | 0 |
| D | 0 | 108 | 0 |
| Quadrant | Total seconds | Saturated seconds | Saturation percentage |
|---|---|---|---|
| A | 5322 | 4328 | 81.322811% |
| B | 5322 | 43 | 0.807967% |
| C | 5322 | 384 | 7.215333% |
| D | 5322 | 70 | 1.315295% |
Noise dominated data is calculated using 1-second bins in cleaned event files. If a bin has >2000 counts, and if more than 50% of those come from <1% of pixels, then it is considered to be noise-dominated and hence unusable.
| Quadrant | # 1 sec bins | Bins with >0 counts | Bins with >2000 counts | High rate bins dominated by noise | Noise dominated (total time) | Noise dominated (detector-on time) | Marked lightcurve |
|---|---|---|---|---|---|---|---|
| A | 7294 | 5323 | 3708 | 3708 | 50.84% | 69.66% | 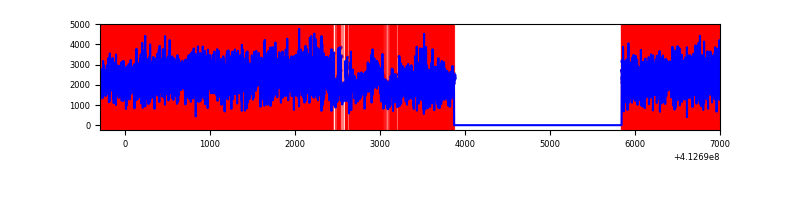 |
| B | 7294 | 5323 | 38 | 38 | 0.52% | 0.71% | 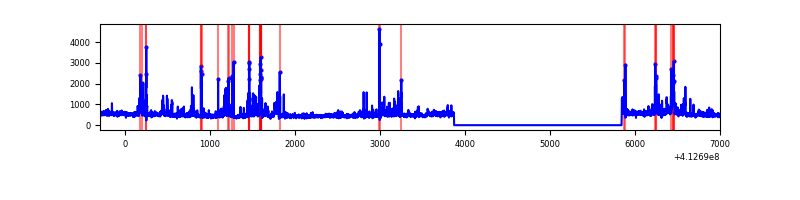 |
| C | 7294 | 5323 | 460 | 460 | 6.31% | 8.64% |  |
| D | 7294 | 5323 | 58 | 58 | 0.80% | 1.09% | 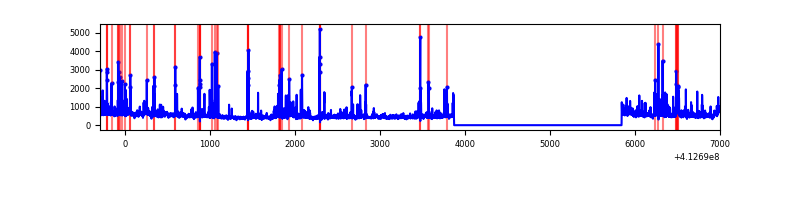 |
Top three noisy pixels from each quadrant. If the there are fewer than three noisy pixels in the level2.evt file, extra rows are filled as -1
| Pixel properties | Quadrant properties | ||||||
|---|---|---|---|---|---|---|---|
| Quadrant | DetID | PixID | Counts | Sigma | Mean | Median | Sigma |
| A | 15 | 222 | 9392812 | 101858.89 | 451 | 444 | 92.2 |
| A | 15 | 174 | 834550 | 9045.76 | 451 | 444 | 92.2 |
| A | 10 | 83 | 308261 | 3338.23 | 451 | 444 | 92.2 |
| B | 5 | 172 | 447932 | 3731.57 | 626 | 611 | 119.9 |
| B | 5 | 255 | 99812 | 827.53 | 626 | 611 | 119.9 |
| B | 15 | 85 | 20350 | 164.66 | 626 | 611 | 119.9 |
| C | 9 | 187 | 1847956 | 13507.23 | 589 | 594 | 136.8 |
| C | 15 | 208 | 1119075 | 8177.92 | 589 | 594 | 136.8 |
| C | 15 | 214 | 217561 | 1586.38 | 589 | 594 | 136.8 |
| D | 13 | 249 | 185611 | 1259.58 | 607 | 590 | 146.9 |
| D | 12 | 227 | 110226 | 746.38 | 607 | 590 | 146.9 |
| D | 2 | 120 | 109058 | 738.43 | 607 | 590 | 146.9 |
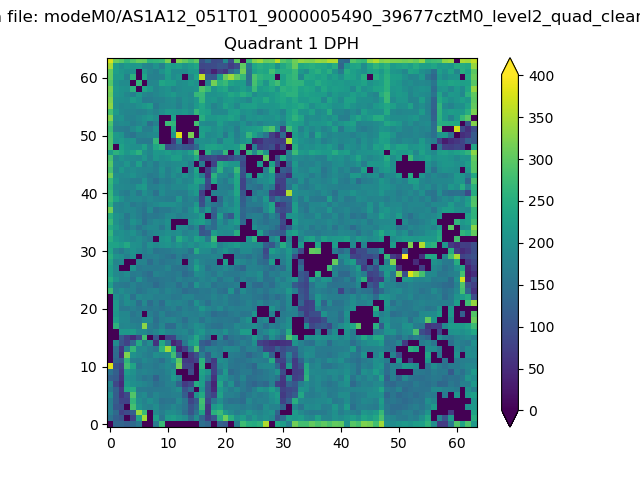
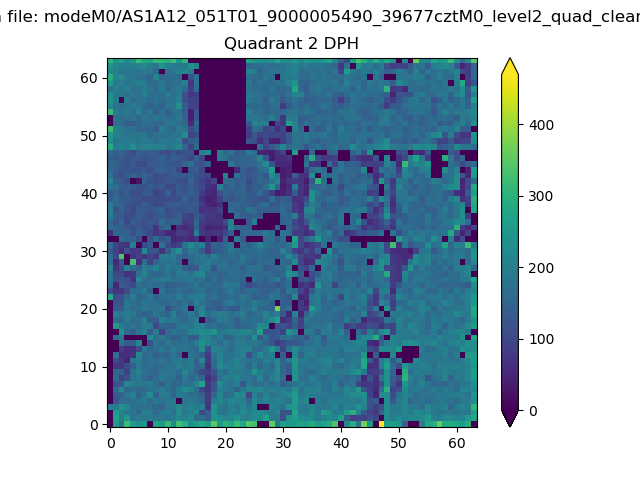
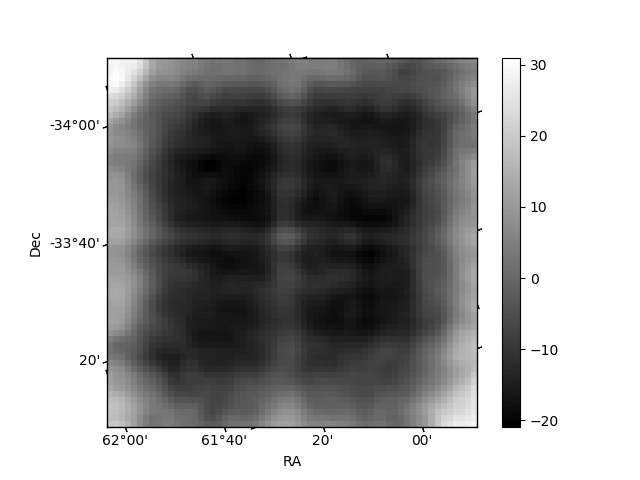
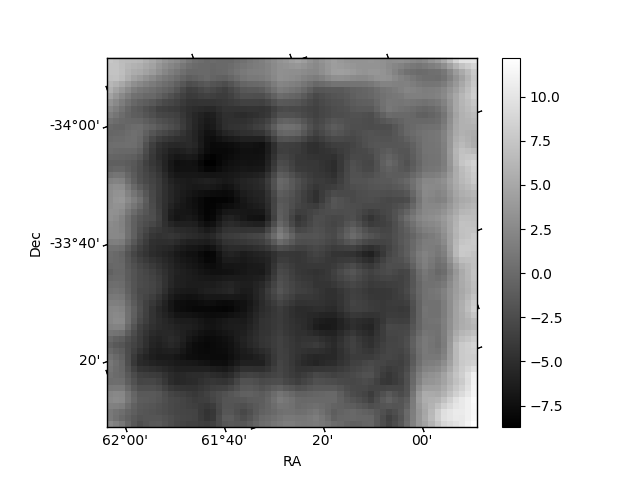
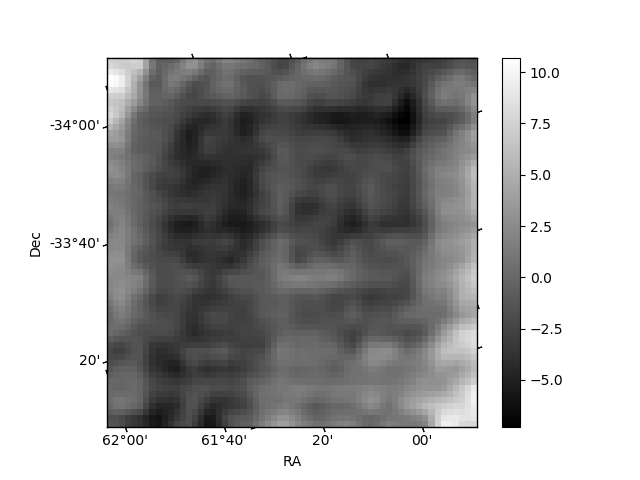
Histogram calculated using DETX and DETY for each event in the final _common_clean file
| Quadrant A | 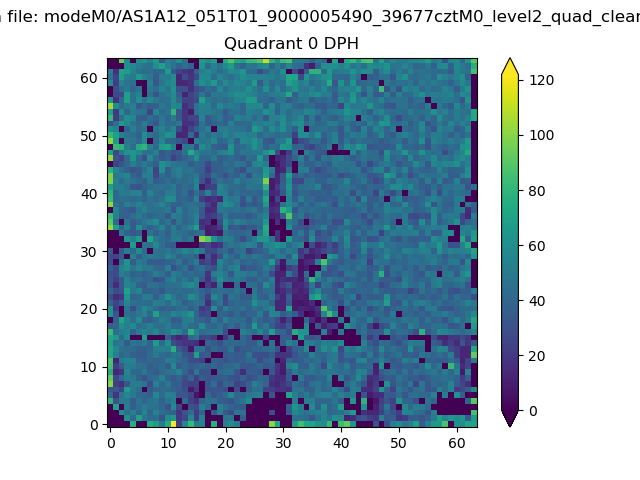 |
 |
Quadrant B |
|---|---|---|---|
| Quadrant D | 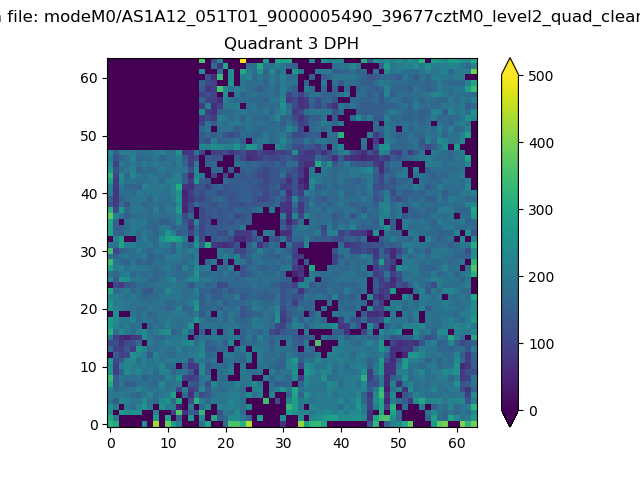 |
 |
Quadrant C |
| Plot type | Count rate plots | Images |
|---|---|---|
| Comparison with Poisson distribution Blue bars denote a histogram of data divided into 1 sec bins. Red curve is a Poisson curve with rate = median count rate of data. |
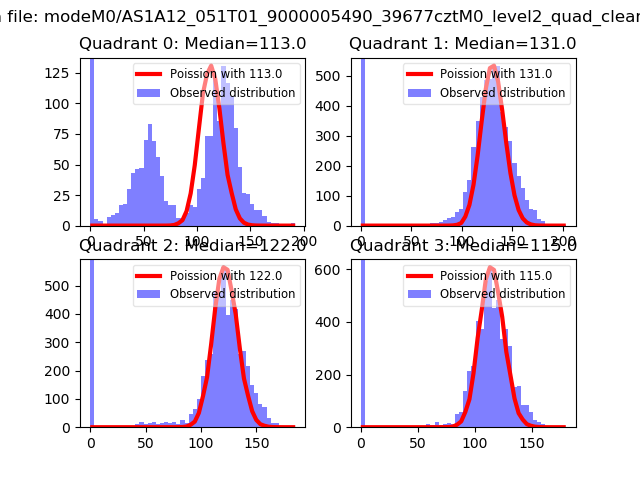 |
 |
| Quadrant-wise count rates Data is divided into 100 sec bins |
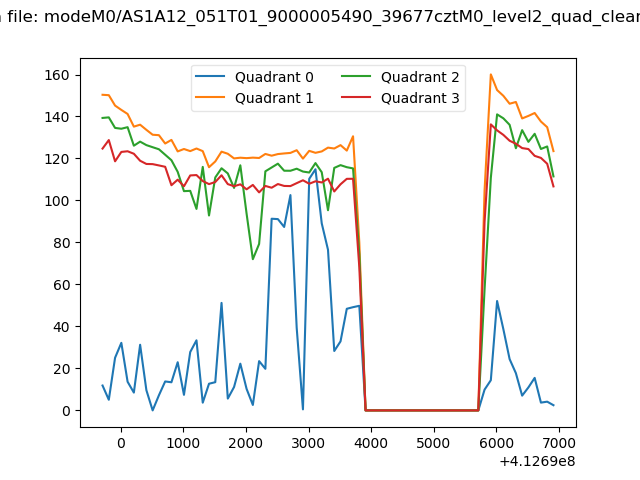 |
|
| Module-wise count rates for Quadrant A Data is divided into 100 sec bins |
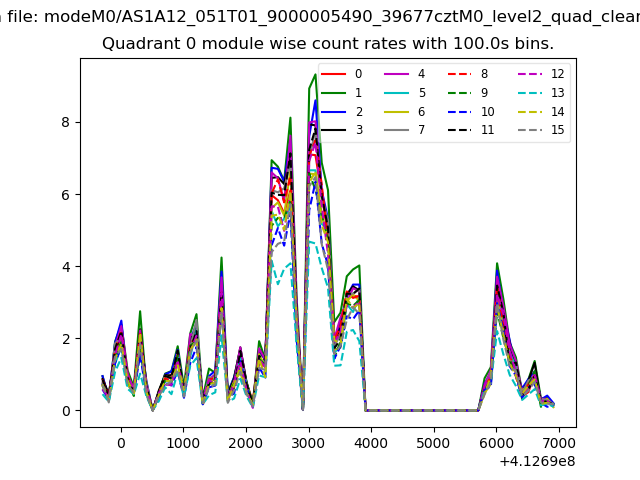 |
 |
| Module-wise count rates for Quadrant B Data is divided into 100 sec bins |
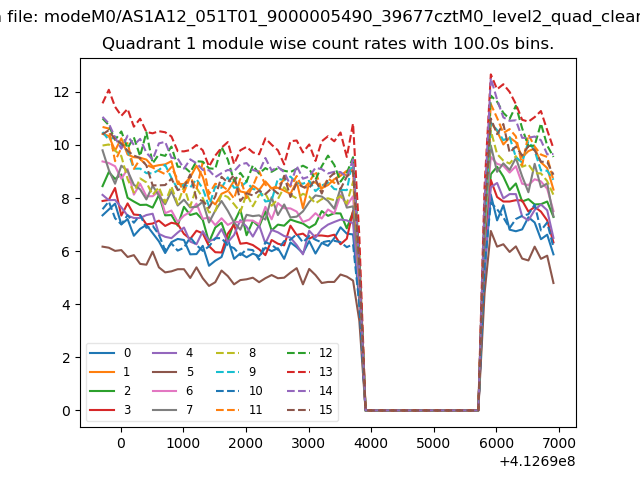 |
 |
| Module-wise count rates for Quadrant C Data is divided into 100 sec bins |
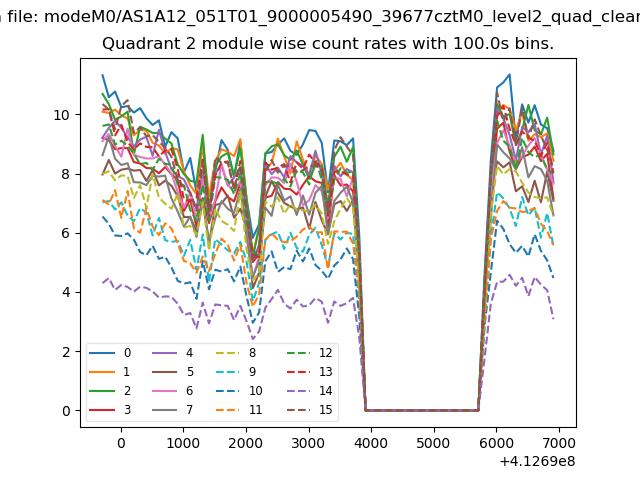 |
 |
| Module-wise count rates for Quadrant D Data is divided into 100 sec bins |
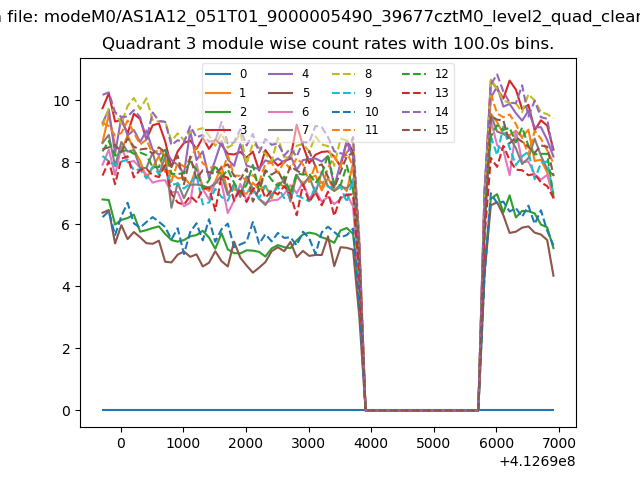 |
 |
| Parameter | Plot |
|---|---|
| CZT HV Monitor | 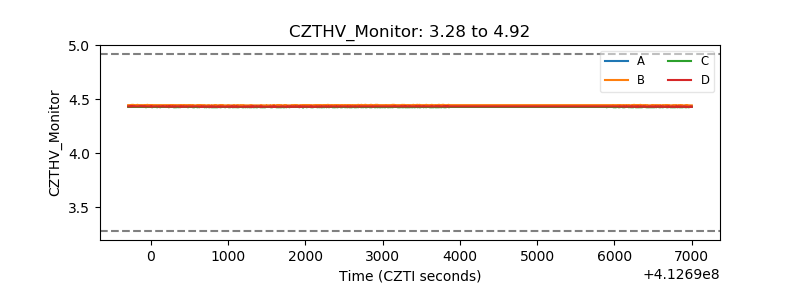 |
| D_VDD | 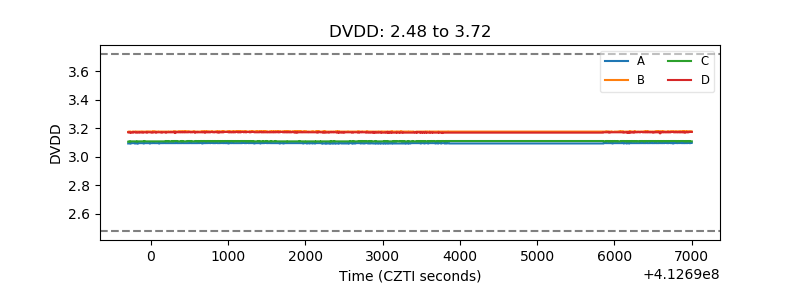 |
| Temperature 1 | 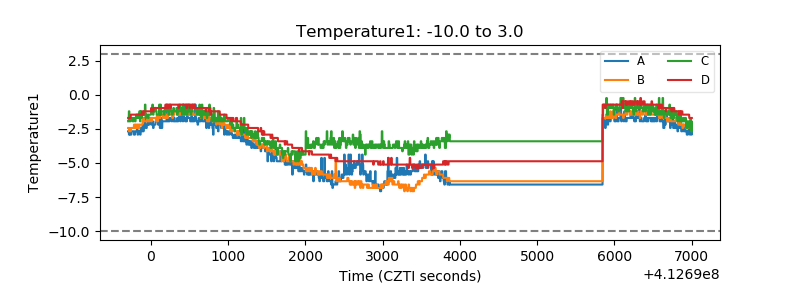 |
| Veto HV Monitor | 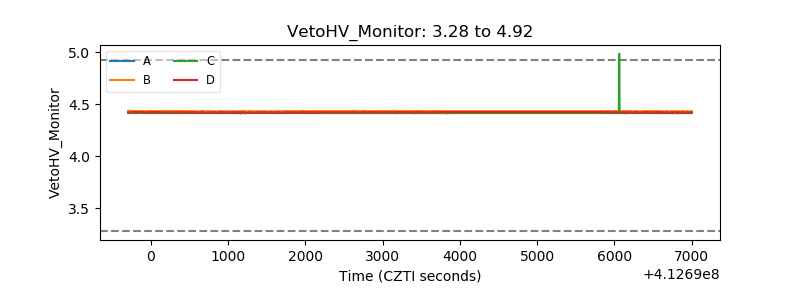 |
| Veto LLD | 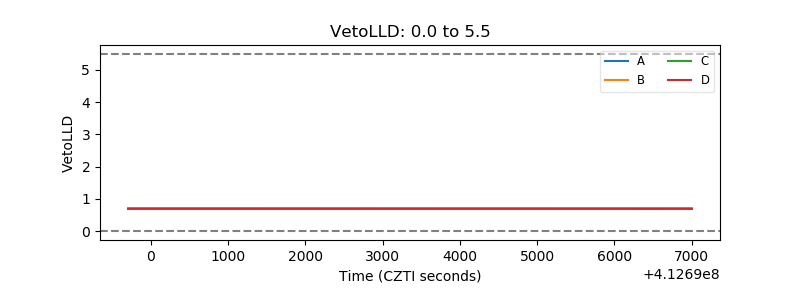 |
| Alpha Counter | 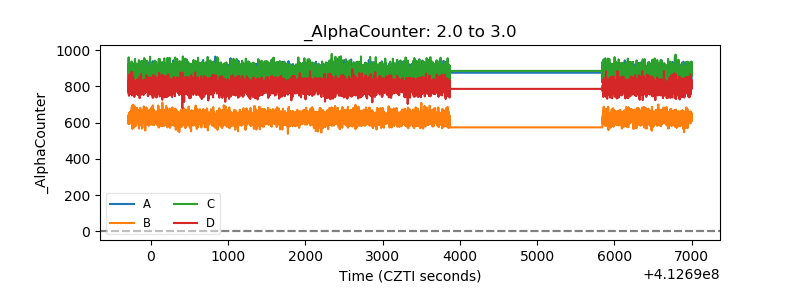 |
| _CPM_Rate | 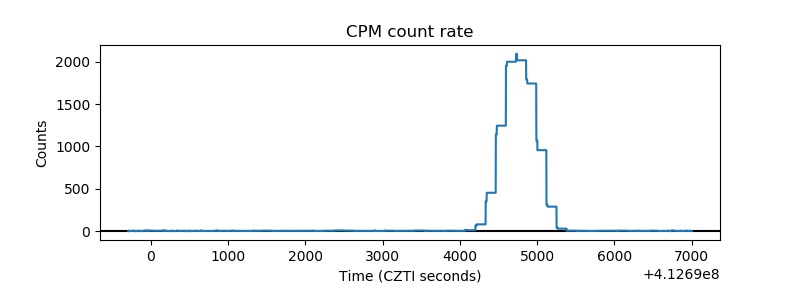 |
| CZT Counter | 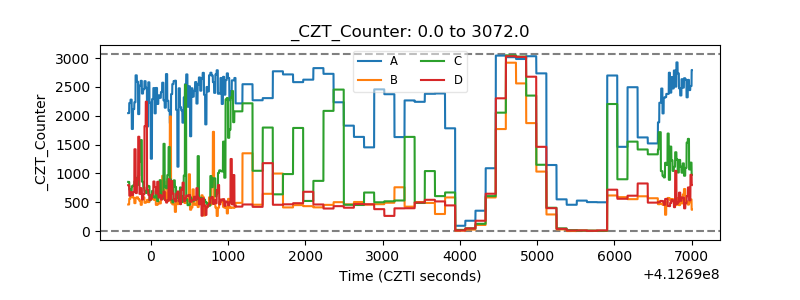 |
| +2.5 Volts monitor | 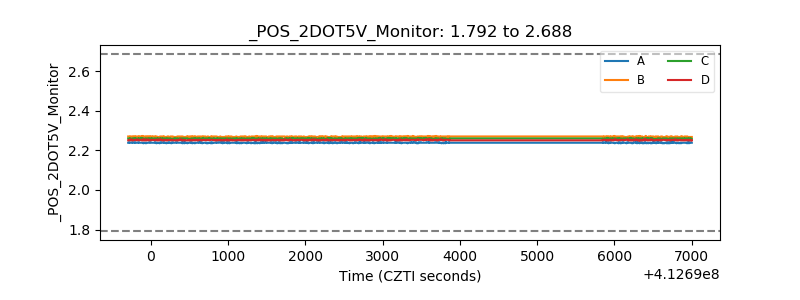 |
| +5 Volts monitor | 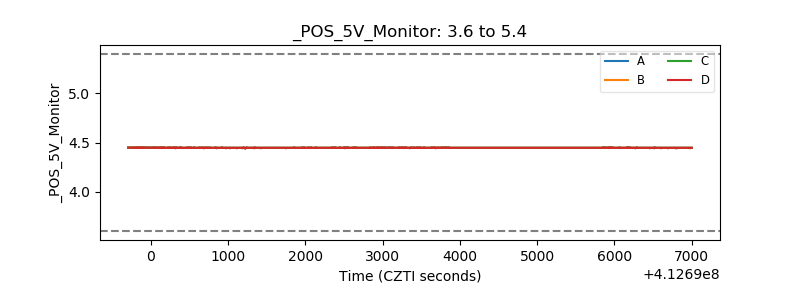 |
| _ROLL_ROT | 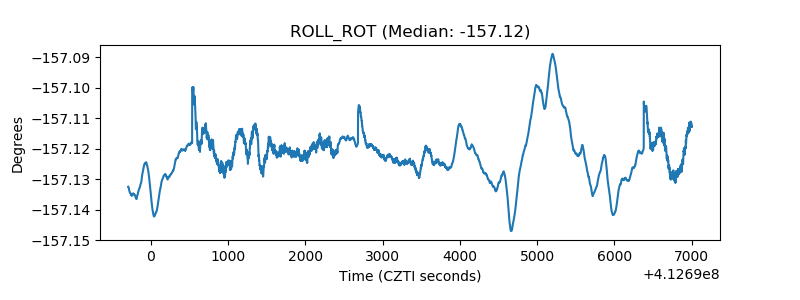 |
| _Roll_DEC | 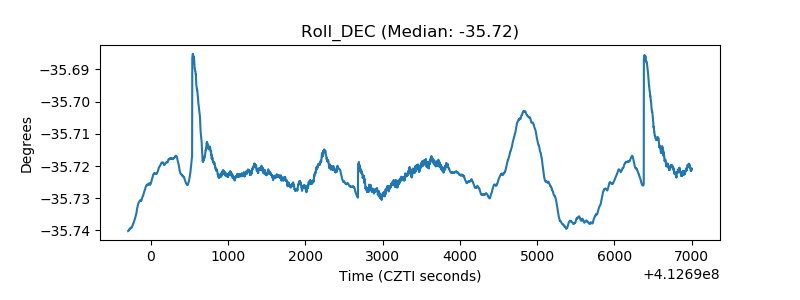 |
| _Roll_RA | 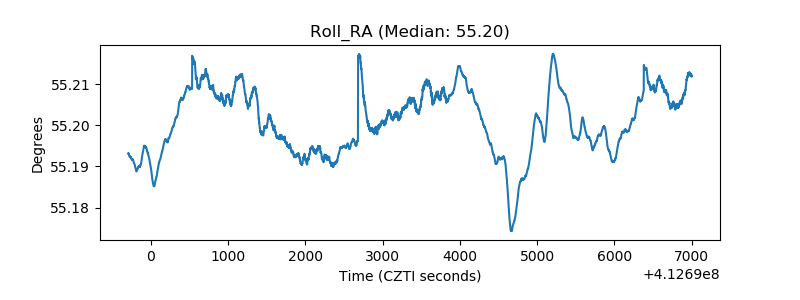 |
| Veto Counter | 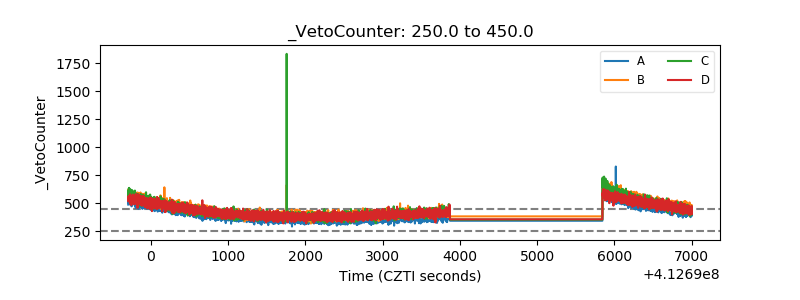 |