| Param | Original file | Final file |
|---|---|---|
| Filename | modeM0/AS1A12_051T01_9000005490_39678cztM0_level2.fits | modeM0/AS1A12_051T01_9000005490_39678cztM0_level2_quad_clean.evt |
| Size (bytes) | 639,034,560 | 77,760,000 |
| Size | 609.4 MB | 74.2 MB |
| Events in quadrant A | 12,612,701 | 86,536 |
| Events in quadrant B | 2,800,033 | 687,952 |
| Events in quadrant C | 4,628,594 | 625,670 |
| Events in quadrant D | 3,212,459 | 593,052 |
| Mode M9 | |||
|---|---|---|---|
| Quadrant | BADHDUFLAG | Total packets | Discarded packets |
| A | 0 | 21 | 0 |
| B | 0 | 21 | 0 |
| C | 0 | 21 | 0 |
| D | 0 | 22 | 0 |
| Mode M0 | |||
|---|---|---|---|
| Quadrant | BADHDUFLAG | Total packets | Discarded packets |
| A | 0 | 40998 | 2 |
| B | 0 | 11658 | 1 |
| C | 0 | 17188 | 1 |
| D | 0 | 13011 | 1 |
| Mode SS | |||
|---|---|---|---|
| Quadrant | BADHDUFLAG | Total packets | Discarded packets |
| A | 0 | 104 | 0 |
| B | 0 | 104 | 0 |
| C | 0 | 104 | 0 |
| D | 0 | 104 | 0 |
| Quadrant | Total seconds | Saturated seconds | Saturation percentage |
|---|---|---|---|
| A | 5161 | 4734 | 91.726410% |
| B | 5161 | 29 | 0.561907% |
| C | 5161 | 186 | 3.603953% |
| D | 5161 | 123 | 2.383259% |
Noise dominated data is calculated using 1-second bins in cleaned event files. If a bin has >2000 counts, and if more than 50% of those come from <1% of pixels, then it is considered to be noise-dominated and hence unusable.
| Quadrant | # 1 sec bins | Bins with >0 counts | Bins with >2000 counts | High rate bins dominated by noise | Noise dominated (total time) | Noise dominated (detector-on time) | Marked lightcurve |
|---|---|---|---|---|---|---|---|
| A | 7253 | 5162 | 3943 | 3943 | 54.36% | 76.39% | 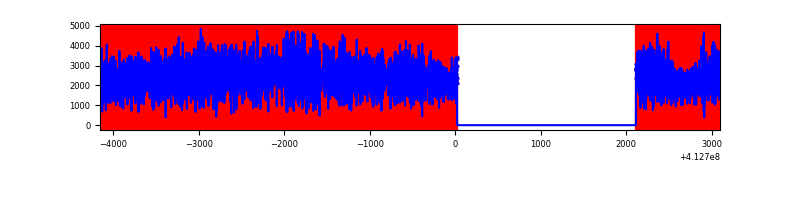 |
| B | 7253 | 5162 | 20 | 20 | 0.28% | 0.39% | 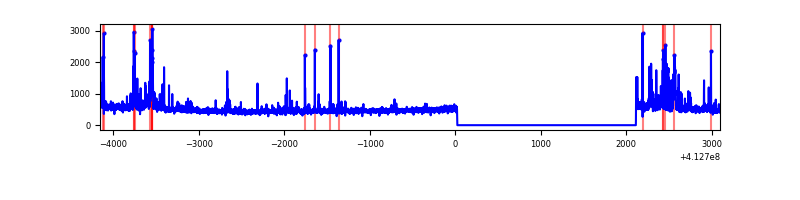 |
| C | 7253 | 5162 | 225 | 225 | 3.10% | 4.36% | 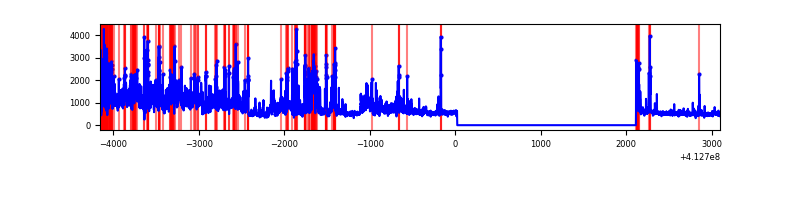 |
| D | 7253 | 5162 | 112 | 112 | 1.54% | 2.17% | 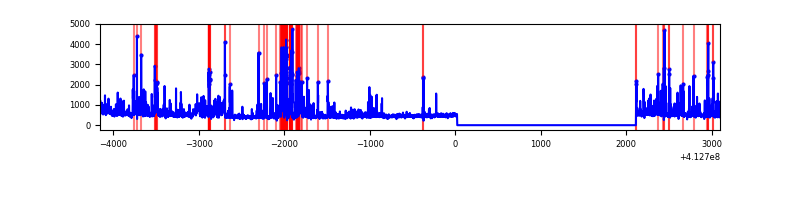 |
Top three noisy pixels from each quadrant. If the there are fewer than three noisy pixels in the level2.evt file, extra rows are filled as -1
| Pixel properties | Quadrant properties | ||||||
|---|---|---|---|---|---|---|---|
| Quadrant | DetID | PixID | Counts | Sigma | Mean | Median | Sigma |
| A | 15 | 222 | 10448099 | 131087.99 | 391 | 385 | 79.7 |
| A | 10 | 83 | 306541 | 3841.35 | 391 | 385 | 79.7 |
| A | 15 | 174 | 301542 | 3778.63 | 391 | 385 | 79.7 |
| B | 5 | 172 | 285612 | 2453.24 | 611 | 597 | 116.2 |
| B | 5 | 255 | 66811 | 569.93 | 611 | 597 | 116.2 |
| B | 0 | 186 | 21285 | 178.07 | 611 | 597 | 116.2 |
| C | 9 | 187 | 1513631 | 11288.97 | 577 | 582 | 134.0 |
| C | 15 | 208 | 532157 | 3966.12 | 577 | 582 | 134.0 |
| C | 15 | 214 | 215015 | 1599.9 | 577 | 582 | 134.0 |
| D | 13 | 171 | 308128 | 2189.38 | 585 | 569 | 140.5 |
| D | 12 | 218 | 159183 | 1129.1 | 585 | 569 | 140.5 |
| D | 13 | 249 | 132134 | 936.55 | 585 | 569 | 140.5 |
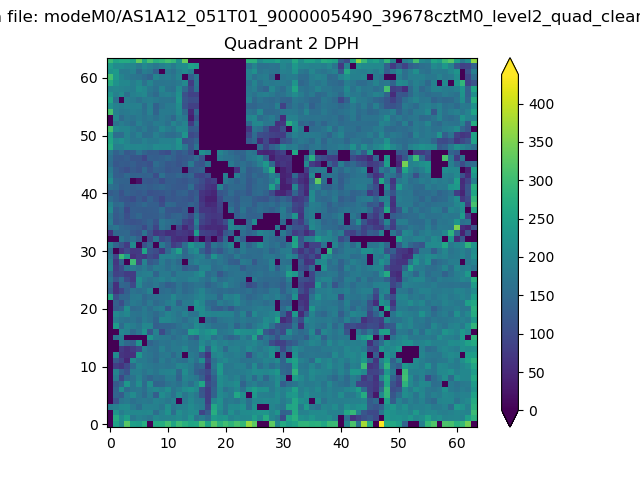
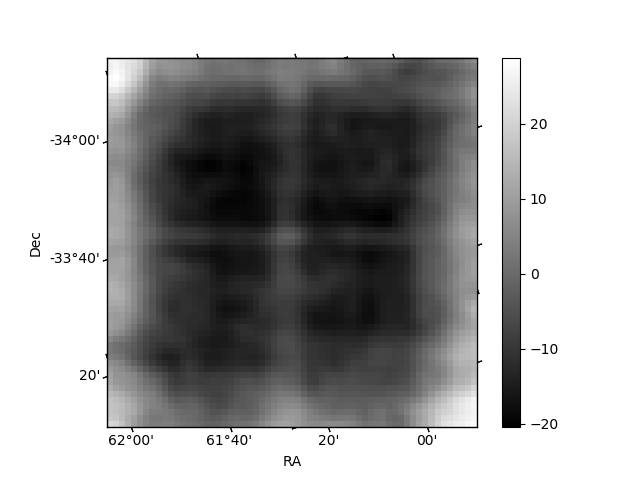
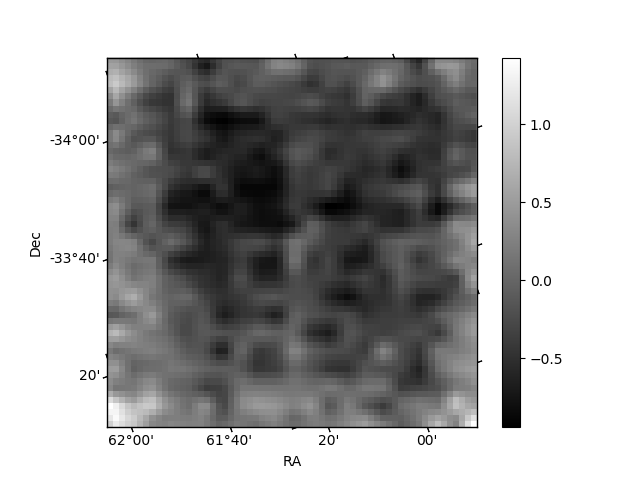
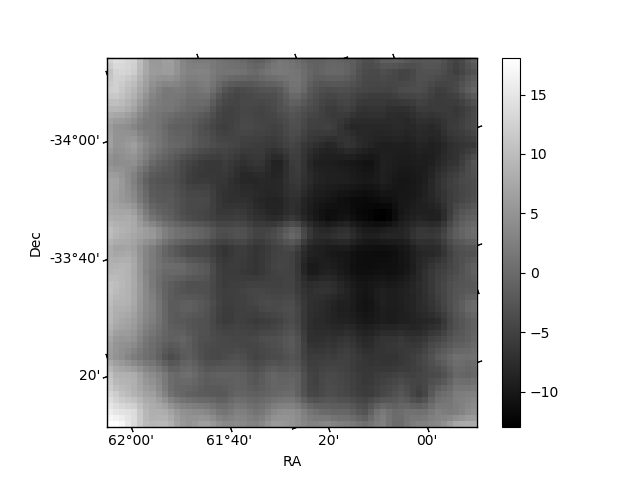
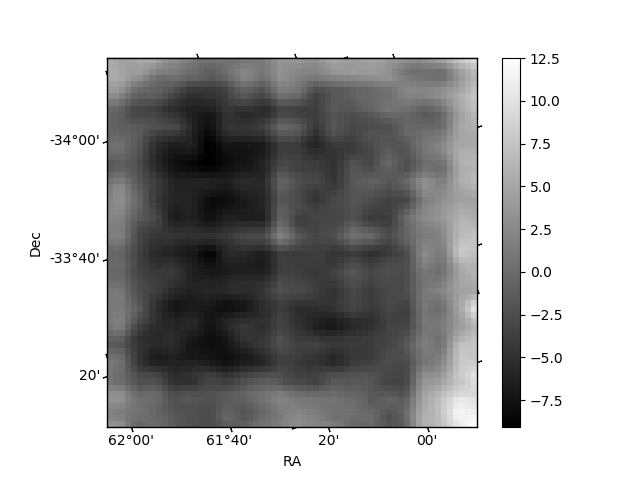
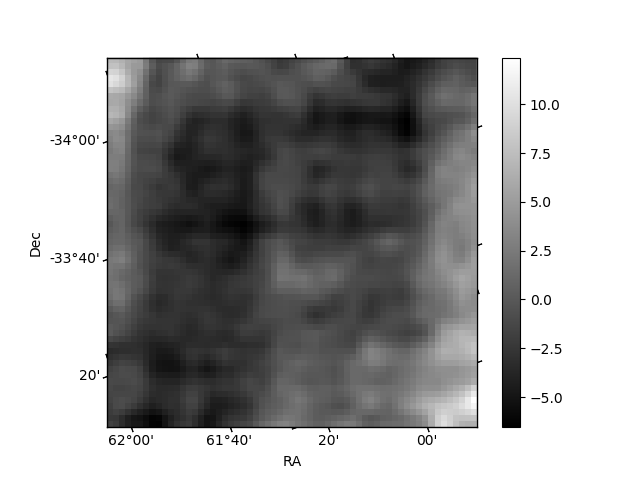
Histogram calculated using DETX and DETY for each event in the final _common_clean file
| Quadrant A | 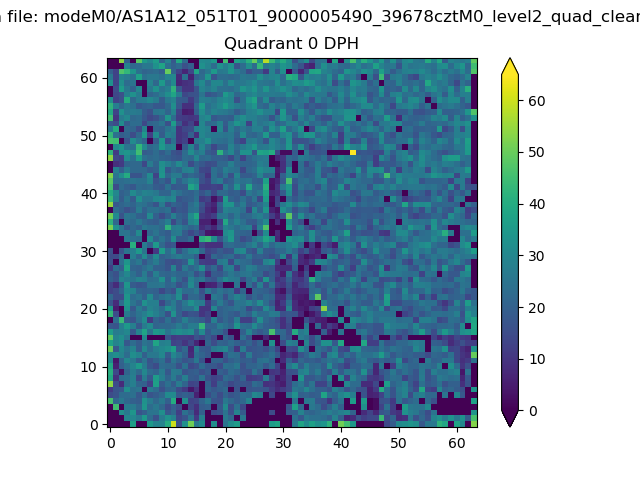 |
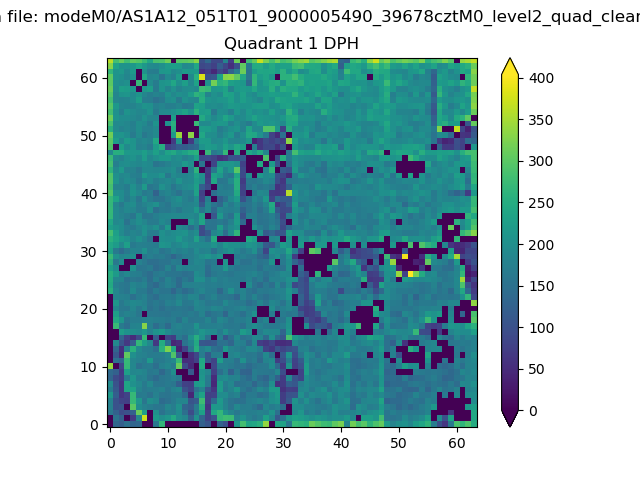 |
Quadrant B |
|---|---|---|---|
| Quadrant D | 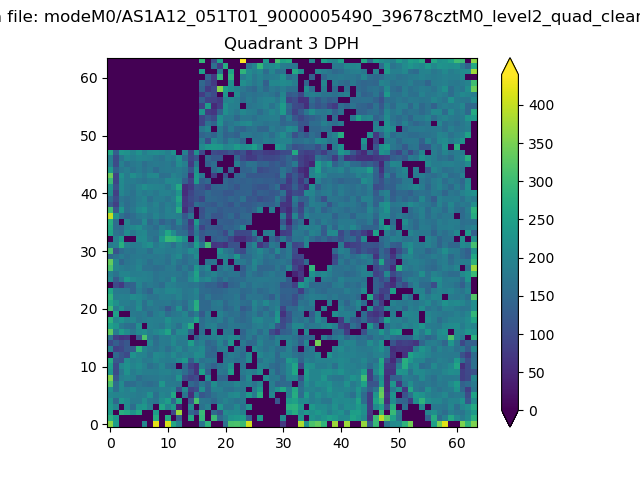 |
 |
Quadrant C |
| Plot type | Count rate plots | Images |
|---|---|---|
| Comparison with Poisson distribution Blue bars denote a histogram of data divided into 1 sec bins. Red curve is a Poisson curve with rate = median count rate of data. |
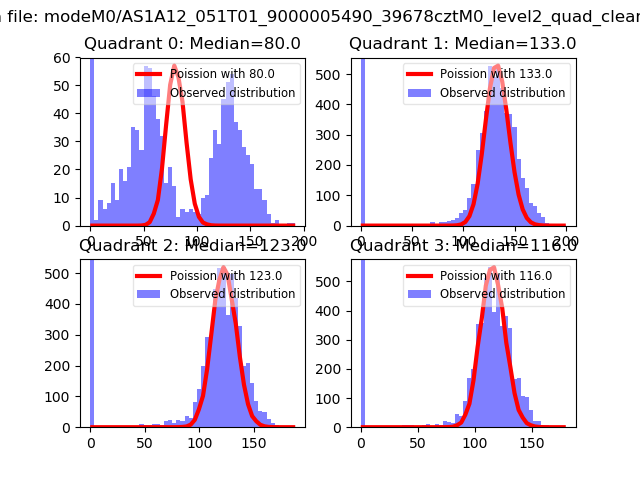 |
 |
| Quadrant-wise count rates Data is divided into 100 sec bins |
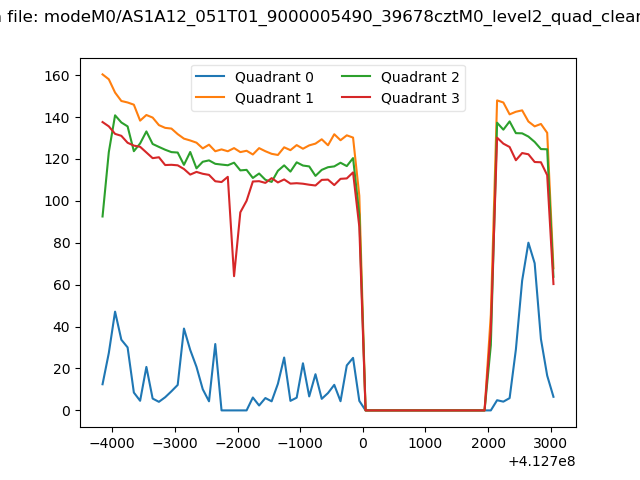 |
|
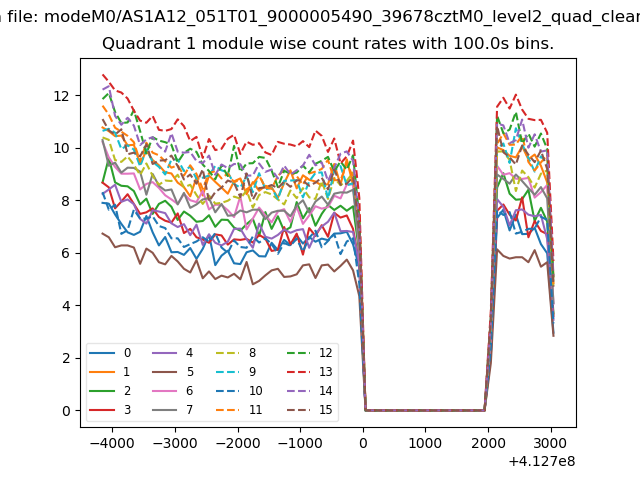
| Module-wise count rates for Quadrant A Data is divided into 100 sec bins |
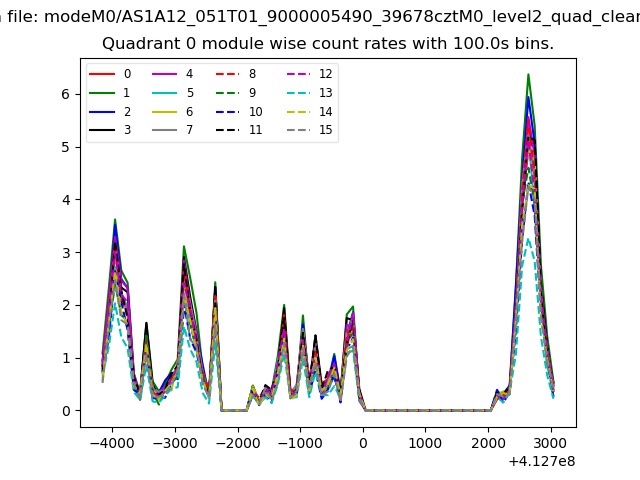 |
 |
| Module-wise count rates for Quadrant B Data is divided into 100 sec bins |
 |
 |
| Module-wise count rates for Quadrant C Data is divided into 100 sec bins |
 |
 |
| Module-wise count rates for Quadrant D Data is divided into 100 sec bins |
 |
 |
| Parameter | Plot |
|---|---|
| CZT HV Monitor |  |
| D_VDD | 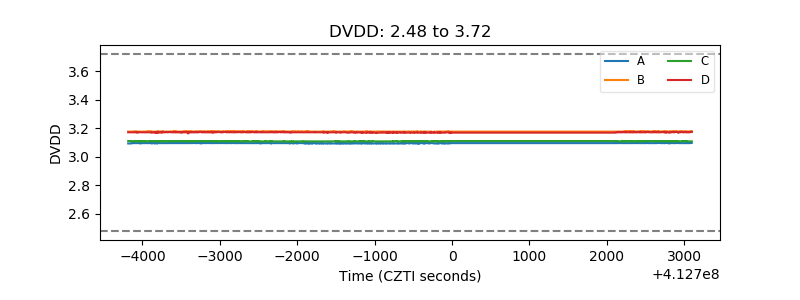 |
| Temperature 1 | 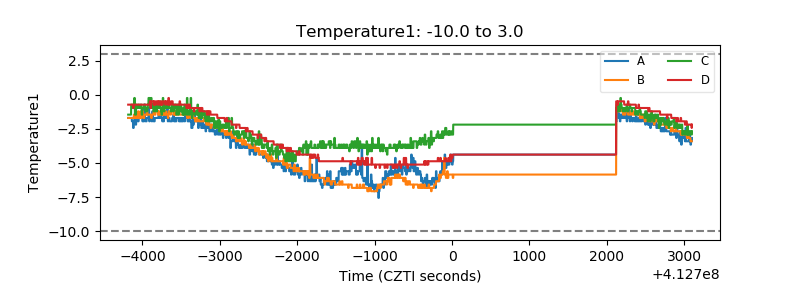 |
| Veto HV Monitor | 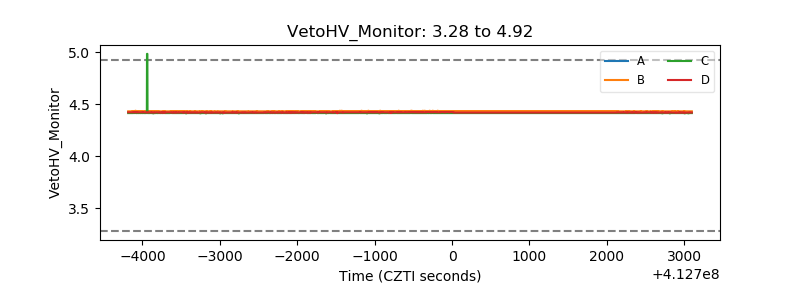 |
| Veto LLD | 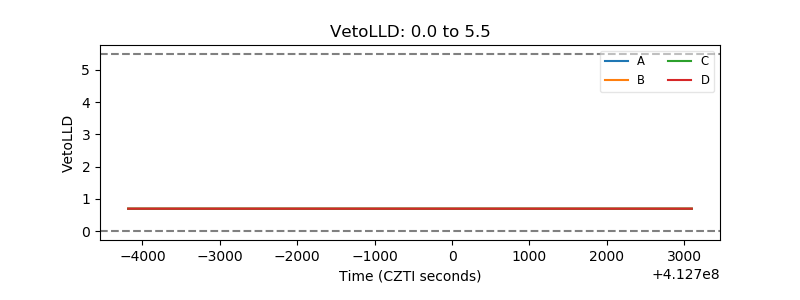 |
| Alpha Counter | 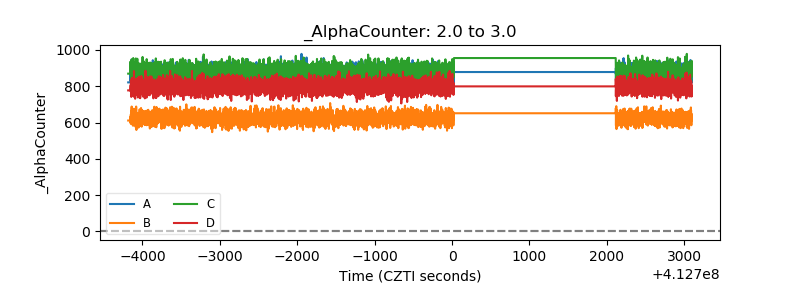 |
| _CPM_Rate | 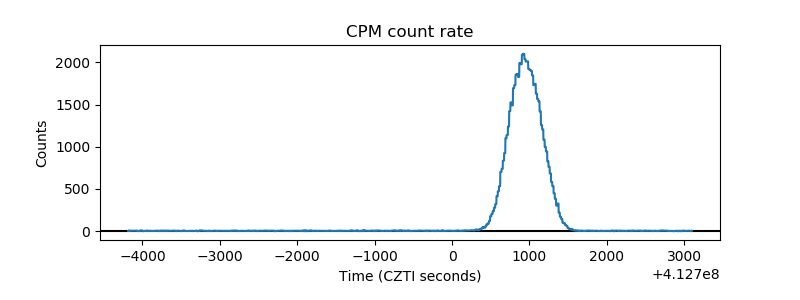 |
| CZT Counter | 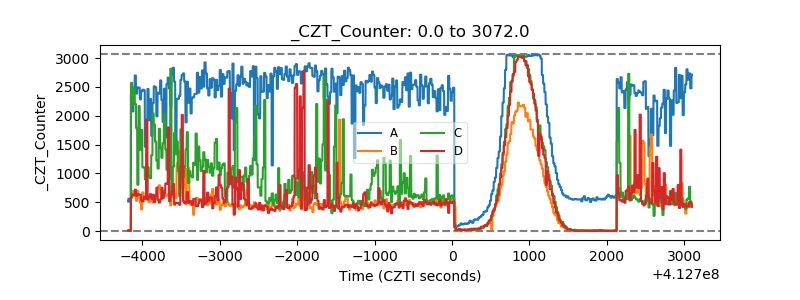 |
| +2.5 Volts monitor | 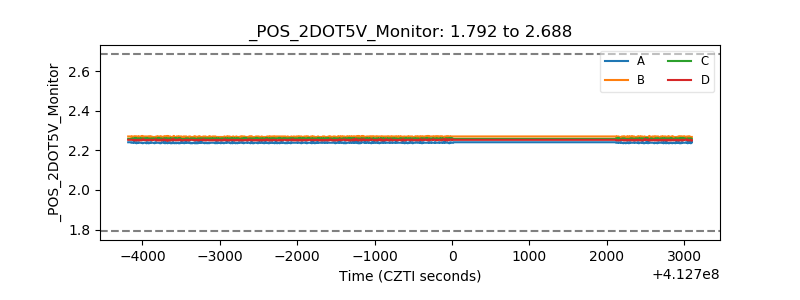 |
| +5 Volts monitor | 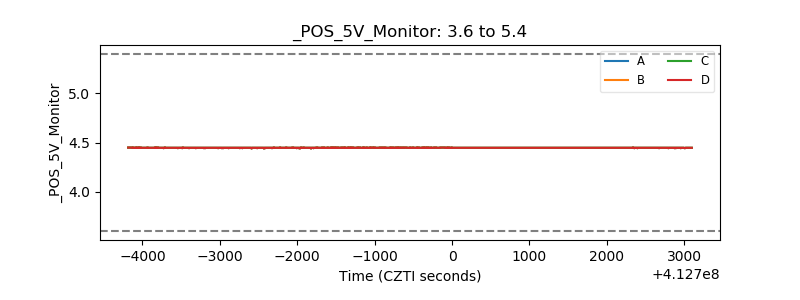 |
| _ROLL_ROT | 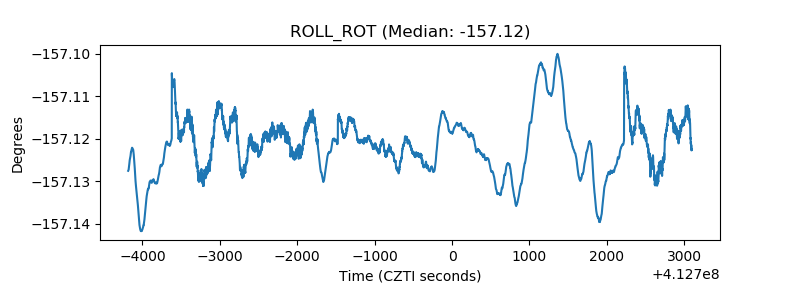 |
| _Roll_DEC | 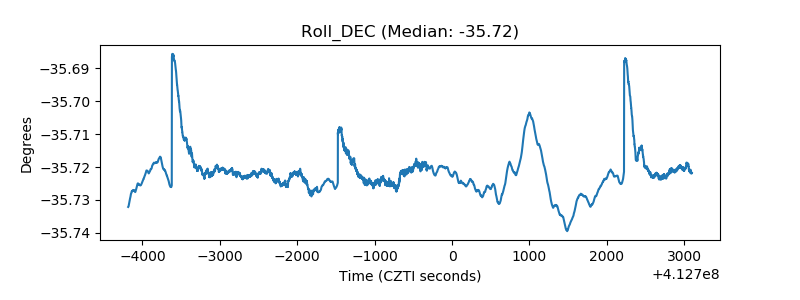 |
| _Roll_RA | 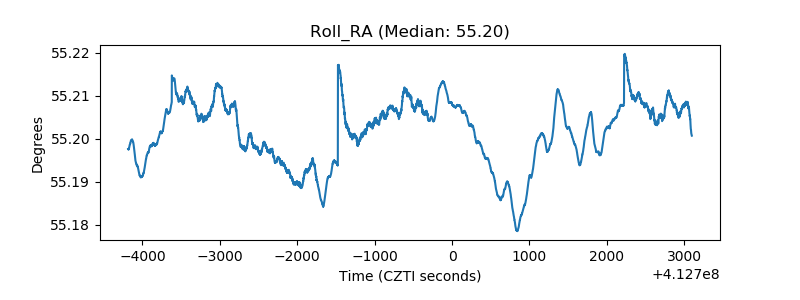 |
| Veto Counter | 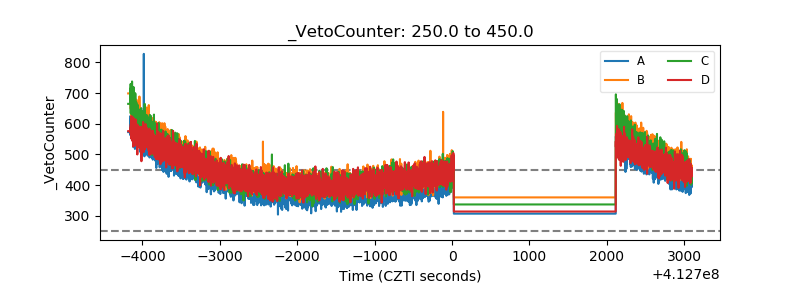 |