| Param | Original file | Final file |
|---|---|---|
| Filename | modeM0/AS1A12_051T01_9000005490_39679cztM0_level2.fits | modeM0/AS1A12_051T01_9000005490_39679cztM0_level2_quad_clean.evt |
| Size (bytes) | 623,957,760 | 74,220,480 |
| Size | 595.1 MB | 70.8 MB |
| Events in quadrant A | 12,223,709 | 119,988 |
| Events in quadrant B | 2,977,821 | 645,998 |
| Events in quadrant C | 4,467,108 | 570,675 |
| Events in quadrant D | 3,036,363 | 557,446 |
| Mode M9 | |||
|---|---|---|---|
| Quadrant | BADHDUFLAG | Total packets | Discarded packets |
| A | 0 | 23 | 0 |
| B | 0 | 23 | 0 |
| C | 0 | 23 | 0 |
| D | 0 | 24 | 0 |
| Mode M0 | |||
|---|---|---|---|
| Quadrant | BADHDUFLAG | Total packets | Discarded packets |
| A | 0 | 39785 | 2 |
| B | 0 | 12180 | 1 |
| C | 0 | 16546 | 1 |
| D | 0 | 12443 | 1 |
| Mode SS | |||
|---|---|---|---|
| Quadrant | BADHDUFLAG | Total packets | Discarded packets |
| A | 0 | 102 | 0 |
| B | 0 | 102 | 0 |
| C | 0 | 102 | 0 |
| D | 0 | 102 | 0 |
| Quadrant | Total seconds | Saturated seconds | Saturation percentage |
|---|---|---|---|
| A | 5041 | 4383 | 86.947034% |
| B | 5041 | 83 | 1.646499% |
| C | 5041 | 430 | 8.530054% |
| D | 5041 | 130 | 2.578853% |
Noise dominated data is calculated using 1-second bins in cleaned event files. If a bin has >2000 counts, and if more than 50% of those come from <1% of pixels, then it is considered to be noise-dominated and hence unusable.
| Quadrant | # 1 sec bins | Bins with >0 counts | Bins with >2000 counts | High rate bins dominated by noise | Noise dominated (total time) | Noise dominated (detector-on time) | Marked lightcurve |
|---|---|---|---|---|---|---|---|
| A | 7193 | 5042 | 3814 | 3814 | 53.02% | 75.64% | 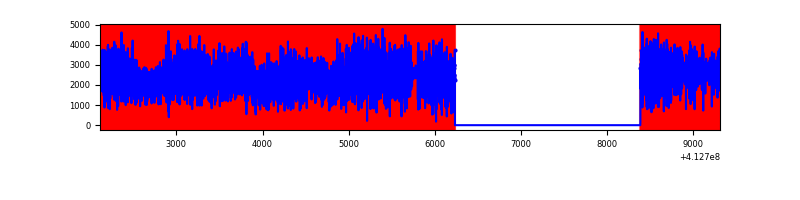 |
| B | 7193 | 5042 | 63 | 63 | 0.88% | 1.25% | 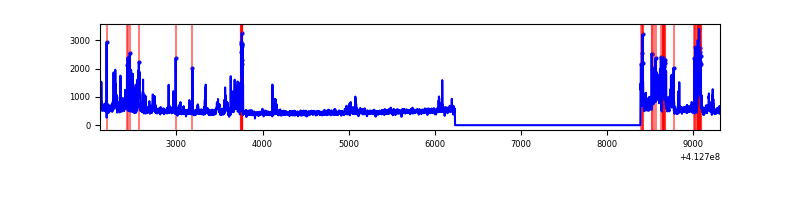 |
| C | 7193 | 5042 | 431 | 431 | 5.99% | 8.55% | 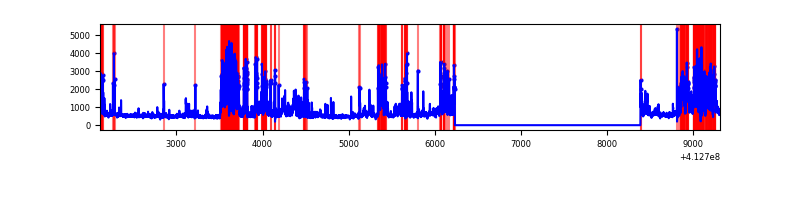 |
| D | 7193 | 5042 | 121 | 121 | 1.68% | 2.40% | 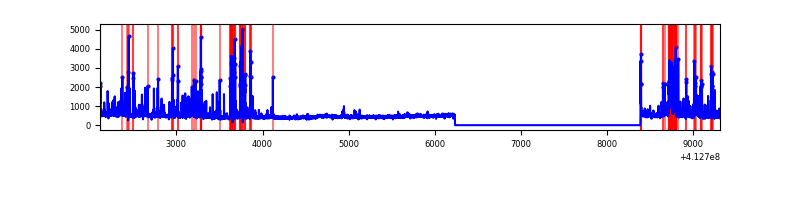 |
Top three noisy pixels from each quadrant. If the there are fewer than three noisy pixels in the level2.evt file, extra rows are filled as -1
| Pixel properties | Quadrant properties | ||||||
|---|---|---|---|---|---|---|---|
| Quadrant | DetID | PixID | Counts | Sigma | Mean | Median | Sigma |
| A | 15 | 222 | 9449231 | 126525.65 | 368 | 362 | 74.7 |
| A | 14 | 254 | 601695 | 8052.19 | 368 | 362 | 74.7 |
| A | 15 | 174 | 428913 | 5738.54 | 368 | 362 | 74.7 |
| B | 5 | 172 | 375058 | 3385.77 | 582 | 569 | 110.6 |
| B | 5 | 32 | 97013 | 871.95 | 582 | 569 | 110.6 |
| B | 0 | 229 | 85942 | 771.86 | 582 | 569 | 110.6 |
| C | 9 | 187 | 2008193 | 16020.24 | 542 | 547 | 125.3 |
| C | 15 | 214 | 206330 | 1642.07 | 542 | 547 | 125.3 |
| C | 15 | 208 | 112301 | 891.75 | 542 | 547 | 125.3 |
| D | 12 | 218 | 318652 | 2362.39 | 554 | 537 | 134.7 |
| D | 5 | 32 | 177464 | 1313.9 | 554 | 537 | 134.7 |
| D | 13 | 249 | 176574 | 1307.29 | 554 | 537 | 134.7 |
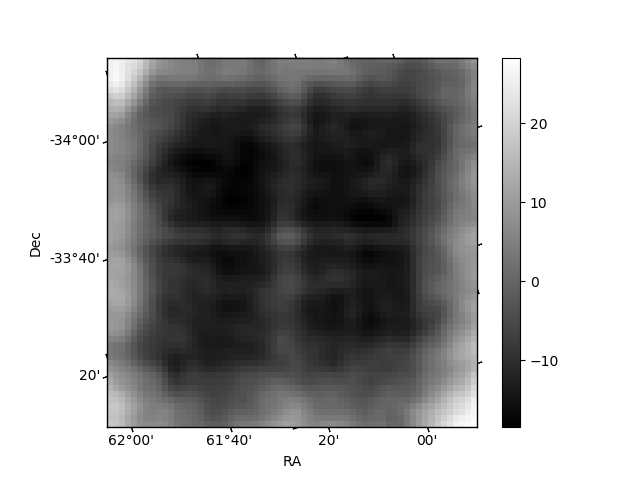
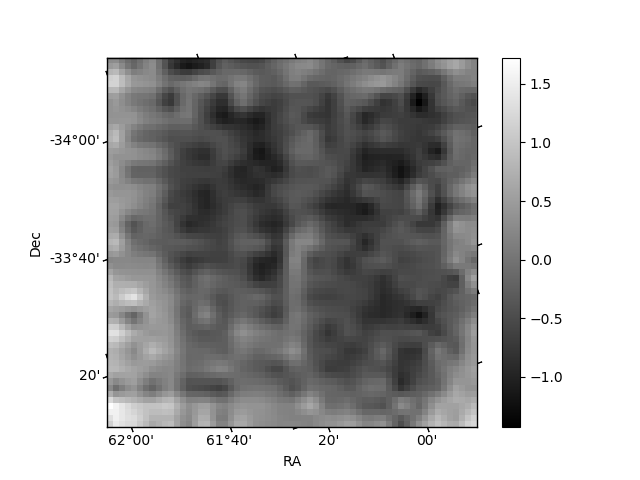
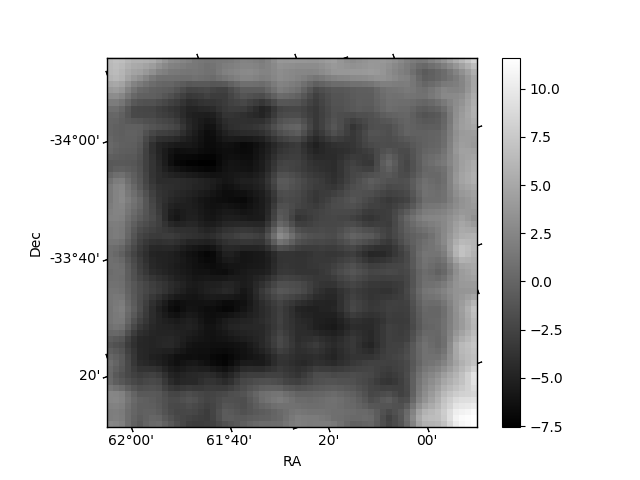
Histogram calculated using DETX and DETY for each event in the final _common_clean file
| Quadrant A | 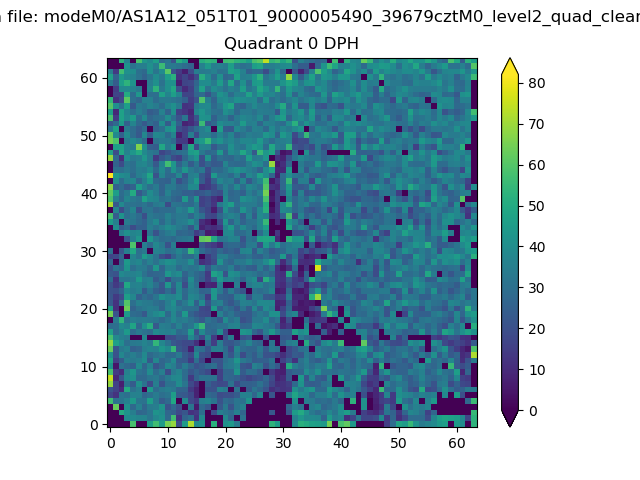 |
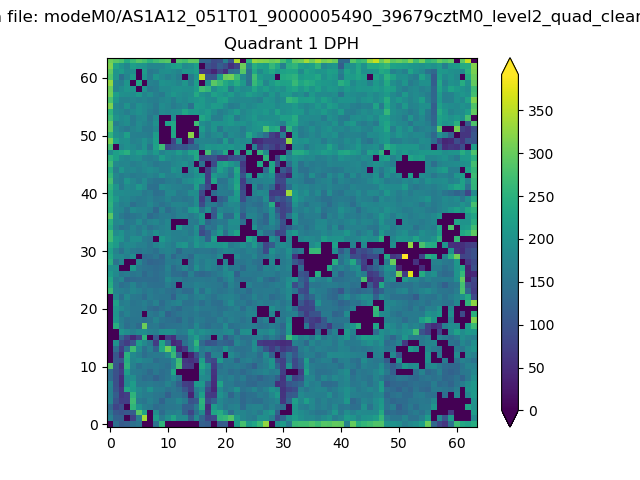 |
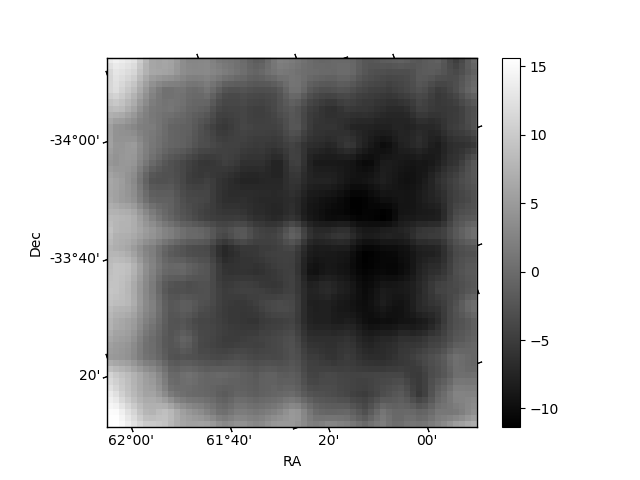
Quadrant B |
|---|---|---|---|
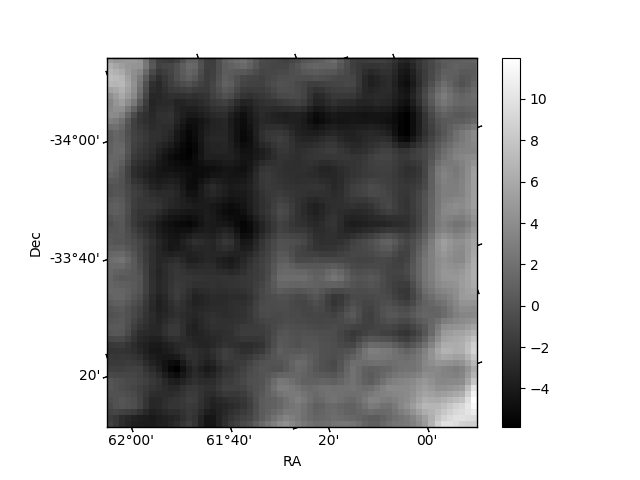
| Quadrant D | 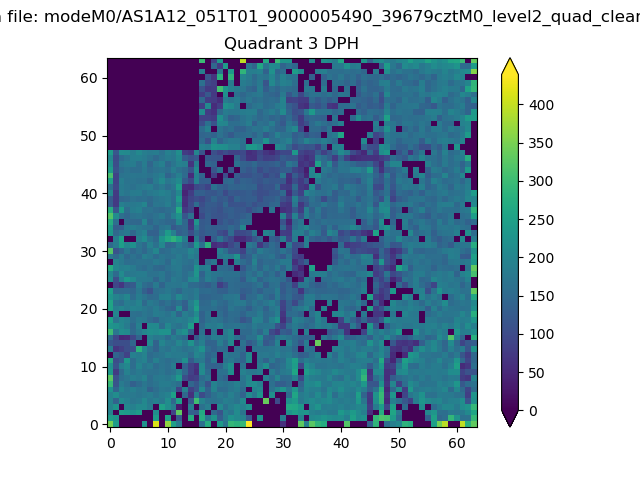 |
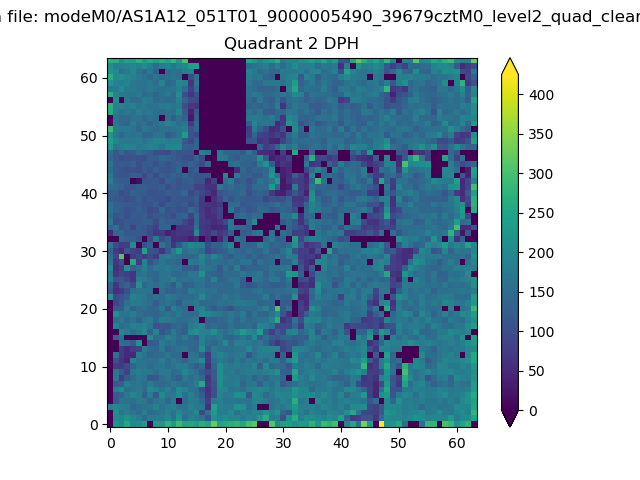 |
Quadrant C |
| Plot type | Count rate plots | Images |
|---|---|---|
| Comparison with Poisson distribution Blue bars denote a histogram of data divided into 1 sec bins. Red curve is a Poisson curve with rate = median count rate of data. |
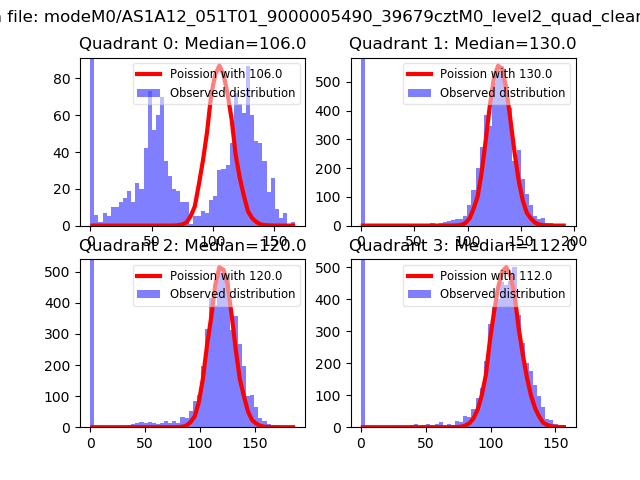 |
 |
| Quadrant-wise count rates Data is divided into 100 sec bins |
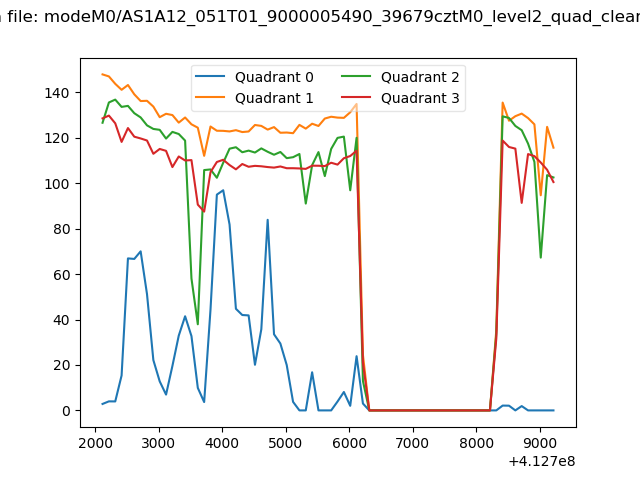 |
|
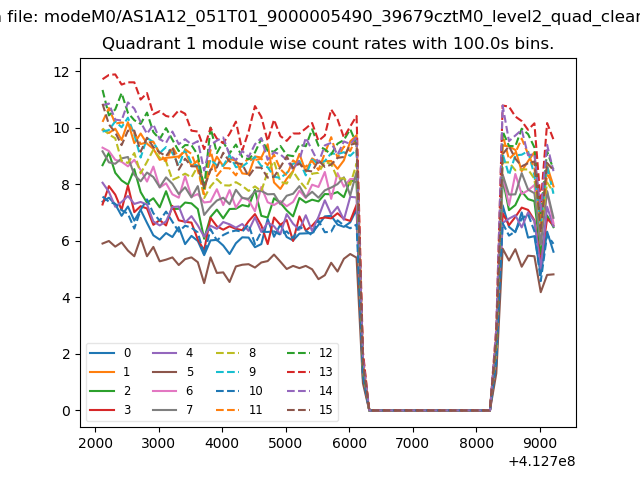
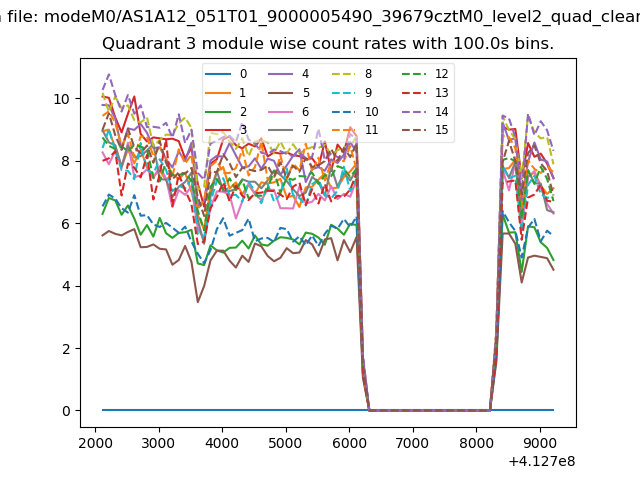
| Module-wise count rates for Quadrant A Data is divided into 100 sec bins |
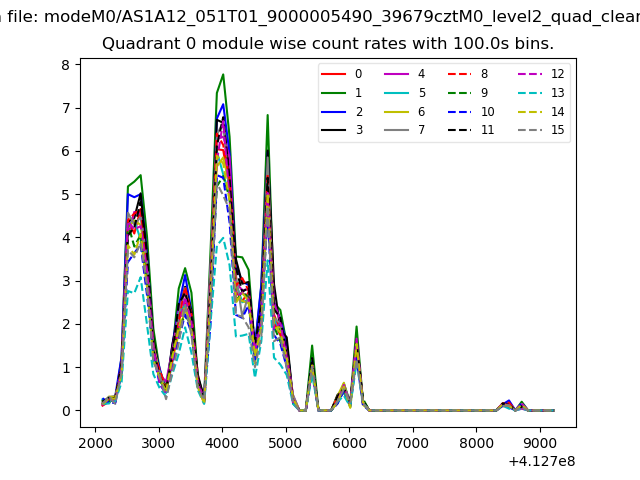 |
 |
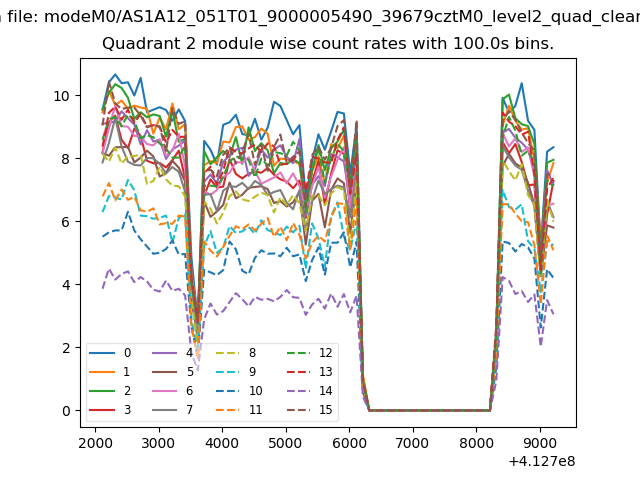
| Module-wise count rates for Quadrant B Data is divided into 100 sec bins |
 |
 |
| Module-wise count rates for Quadrant C Data is divided into 100 sec bins |
 |
 |
| Module-wise count rates for Quadrant D Data is divided into 100 sec bins |
 |
 |
| Parameter | Plot |
|---|---|
| CZT HV Monitor |  |
| D_VDD | 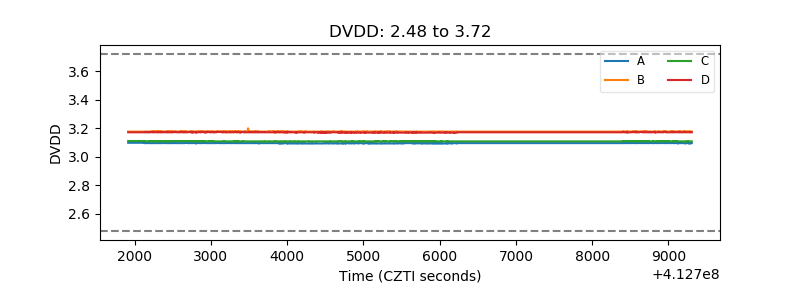 |
| Temperature 1 | 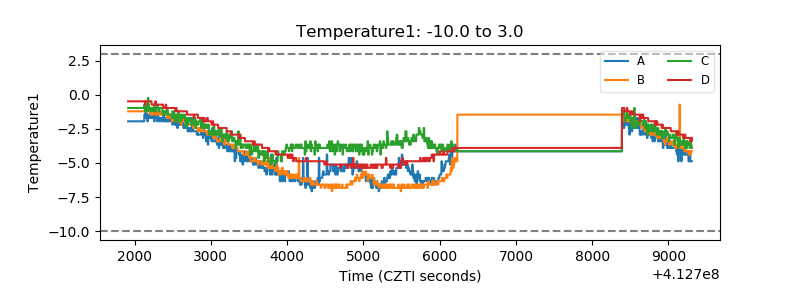 |
| Veto HV Monitor | 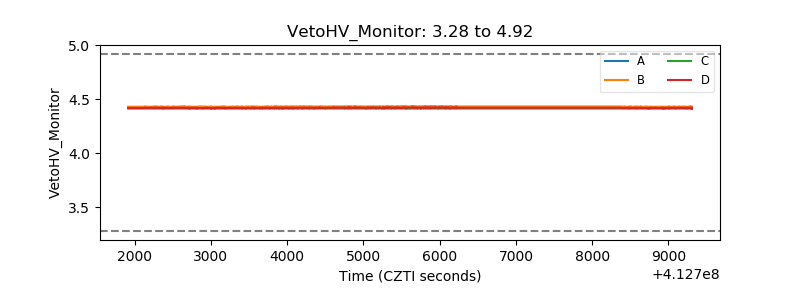 |
| Veto LLD | 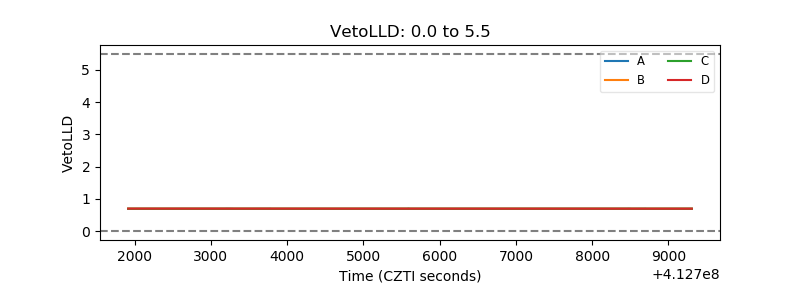 |
| Alpha Counter | 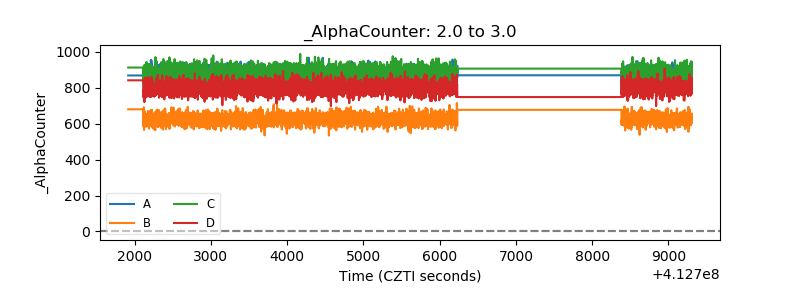 |
| _CPM_Rate | 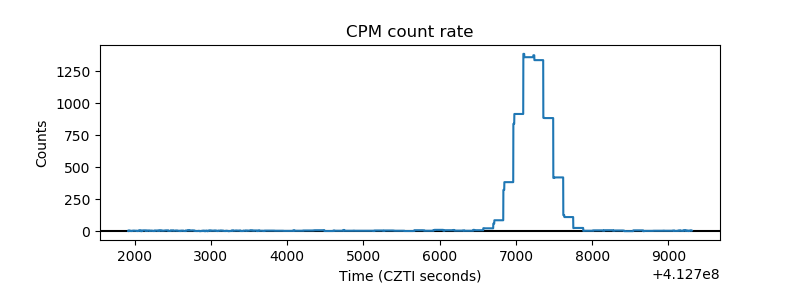 |
| CZT Counter | 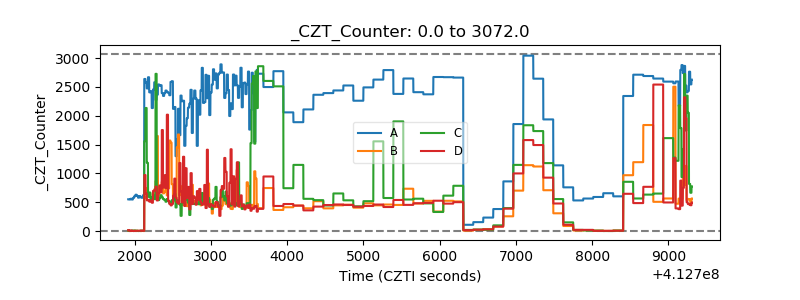 |
| +2.5 Volts monitor | 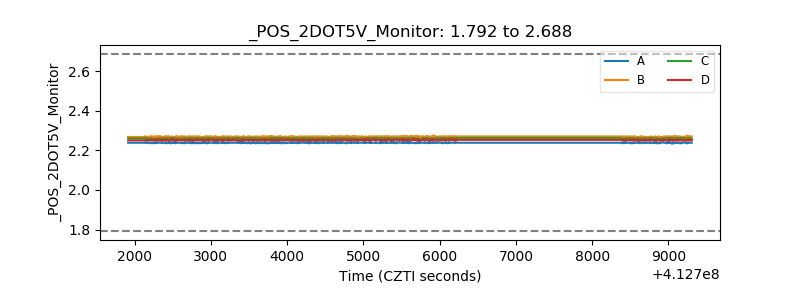 |
| +5 Volts monitor | 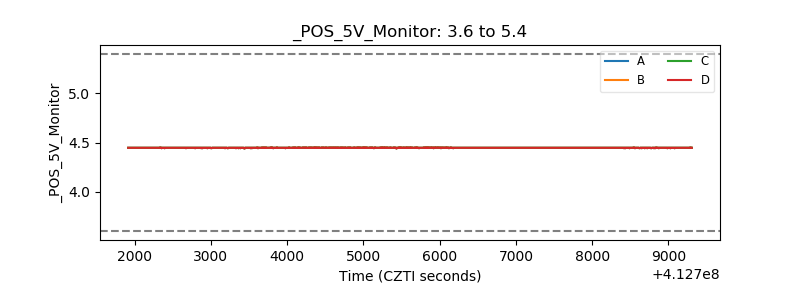 |
| _ROLL_ROT | 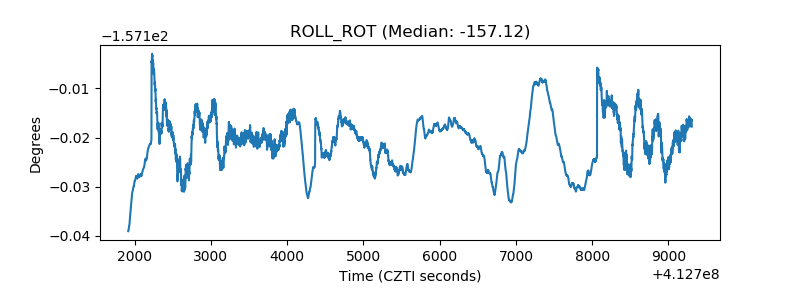 |
| _Roll_DEC | 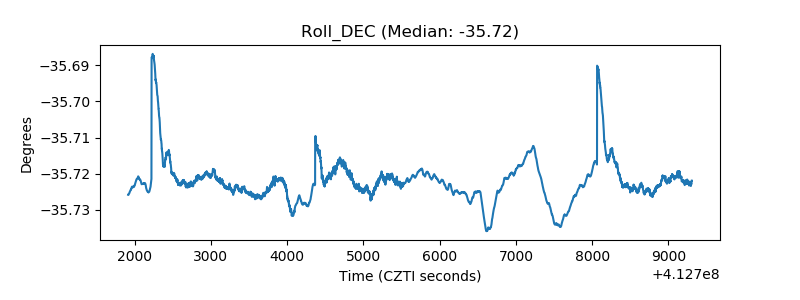 |
| _Roll_RA | 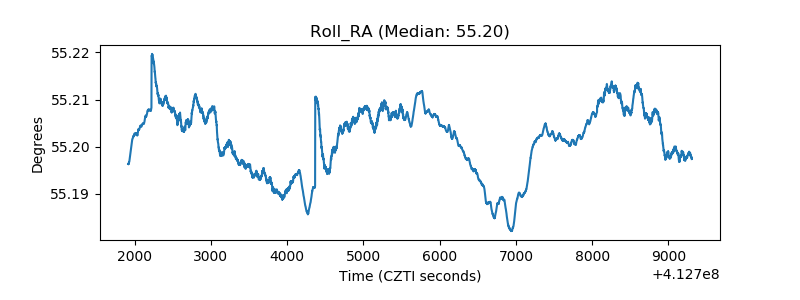 |
| Veto Counter | 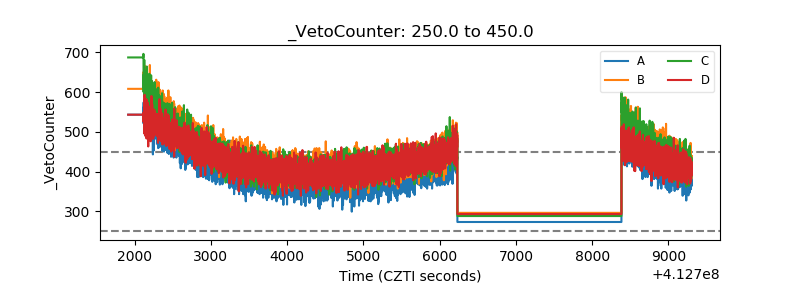 |