| Param | Original file | Final file |
|---|---|---|
| Filename | modeM0/AS1A12_051T01_9000005490_39680cztM0_level2.fits | modeM0/AS1A12_051T01_9000005490_39680cztM0_level2_quad_clean.evt |
| Size (bytes) | 640,964,160 | 66,643,200 |
| Size | 611.3 MB | 63.6 MB |
| Events in quadrant A | 12,452,937 | 34,794 |
| Events in quadrant B | 2,841,170 | 599,550 |
| Events in quadrant C | 5,357,665 | 520,432 |
| Events in quadrant D | 2,692,800 | 518,064 |
| Mode M9 | |||
|---|---|---|---|
| Quadrant | BADHDUFLAG | Total packets | Discarded packets |
| A | 0 | 24 | 0 |
| B | 0 | 24 | 0 |
| C | 0 | 24 | 0 |
| D | 0 | 25 | 0 |
| Mode M0 | |||
|---|---|---|---|
| Quadrant | BADHDUFLAG | Total packets | Discarded packets |
| A | 0 | 40354 | 3 |
| B | 0 | 11715 | 2 |
| C | 0 | 19360 | 2 |
| D | 0 | 11537 | 2 |
| Mode SS | |||
|---|---|---|---|
| Quadrant | BADHDUFLAG | Total packets | Discarded packets |
| A | 0 | 102 | 0 |
| B | 0 | 102 | 0 |
| C | 0 | 102 | 0 |
| D | 0 | 102 | 0 |
| Quadrant | Total seconds | Saturated seconds | Saturation percentage |
|---|---|---|---|
| A | 4913 | 4717 | 96.010584% |
| B | 4913 | 82 | 1.669041% |
| C | 4913 | 588 | 11.968248% |
| D | 4913 | 96 | 1.954000% |
Noise dominated data is calculated using 1-second bins in cleaned event files. If a bin has >2000 counts, and if more than 50% of those come from <1% of pixels, then it is considered to be noise-dominated and hence unusable.
| Quadrant | # 1 sec bins | Bins with >0 counts | Bins with >2000 counts | High rate bins dominated by noise | Noise dominated (total time) | Noise dominated (detector-on time) | Marked lightcurve |
|---|---|---|---|---|---|---|---|
| A | 7035 | 4914 | 4078 | 4078 | 57.97% | 82.99% | 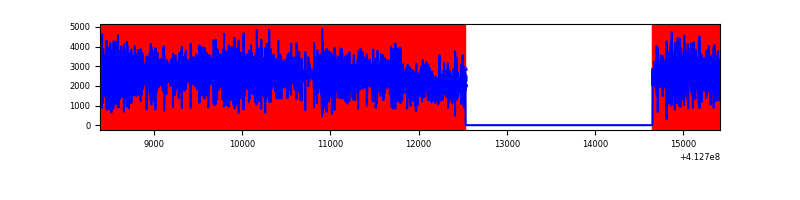 |
| B | 7035 | 4914 | 64 | 64 | 0.91% | 1.30% | 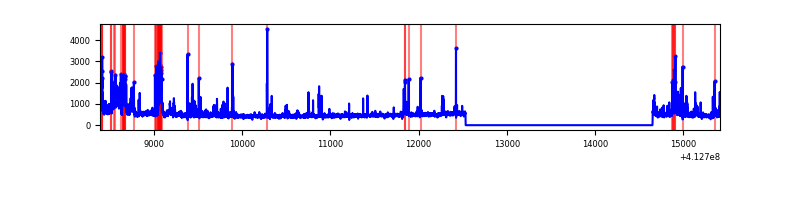 |
| C | 7035 | 4914 | 590 | 590 | 8.39% | 12.01% | 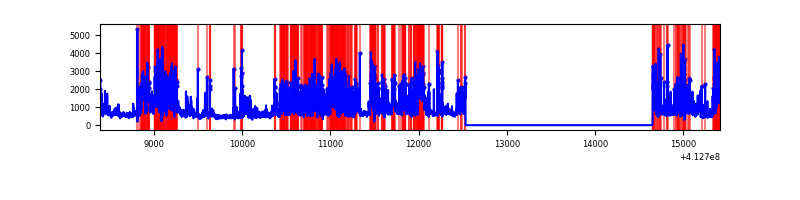 |
| D | 7035 | 4914 | 111 | 111 | 1.58% | 2.26% | 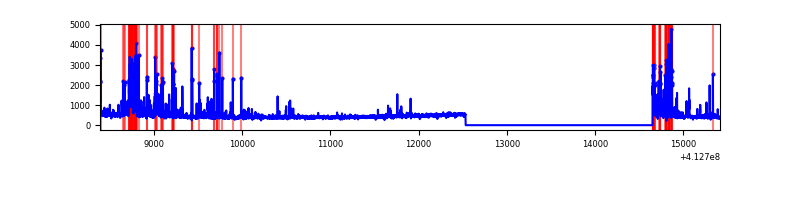 |
Top three noisy pixels from each quadrant. If the there are fewer than three noisy pixels in the level2.evt file, extra rows are filled as -1
| Pixel properties | Quadrant properties | ||||||
|---|---|---|---|---|---|---|---|
| Quadrant | DetID | PixID | Counts | Sigma | Mean | Median | Sigma |
| A | 15 | 222 | 10387139 | 174256.25 | 292 | 286 | 59.6 |
| A | 15 | 174 | 697826 | 11702.36 | 292 | 286 | 59.6 |
| A | 10 | 83 | 220704 | 3697.87 | 292 | 286 | 59.6 |
| B | 5 | 172 | 248048 | 2330.48 | 550 | 536 | 106.2 |
| B | 0 | 229 | 100219 | 938.58 | 550 | 536 | 106.2 |
| B | 5 | 32 | 96961 | 907.9 | 550 | 536 | 106.2 |
| C | 15 | 208 | 1822138 | 15084.36 | 515 | 518 | 120.8 |
| C | 9 | 187 | 1227580 | 10160.98 | 515 | 518 | 120.8 |
| C | 15 | 214 | 202178 | 1669.89 | 515 | 518 | 120.8 |
| D | 12 | 218 | 351865 | 2685.2 | 527 | 512 | 130.8 |
| D | 12 | 233 | 116465 | 886.17 | 527 | 512 | 130.8 |
| D | 13 | 249 | 60020 | 454.79 | 527 | 512 | 130.8 |
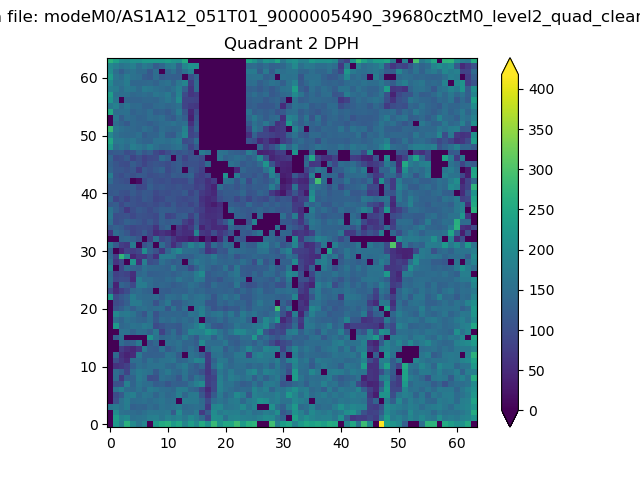
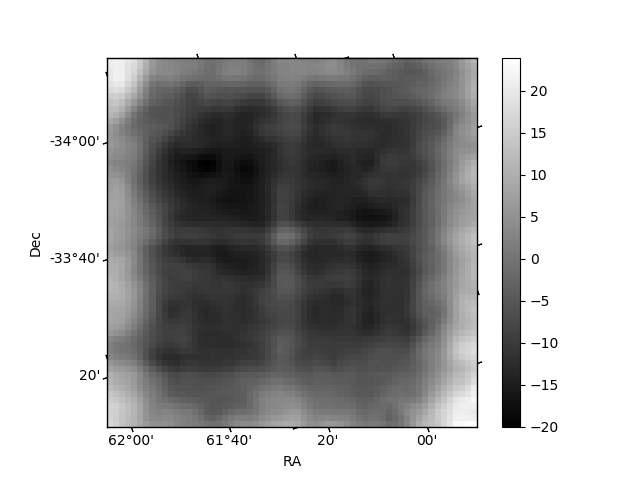
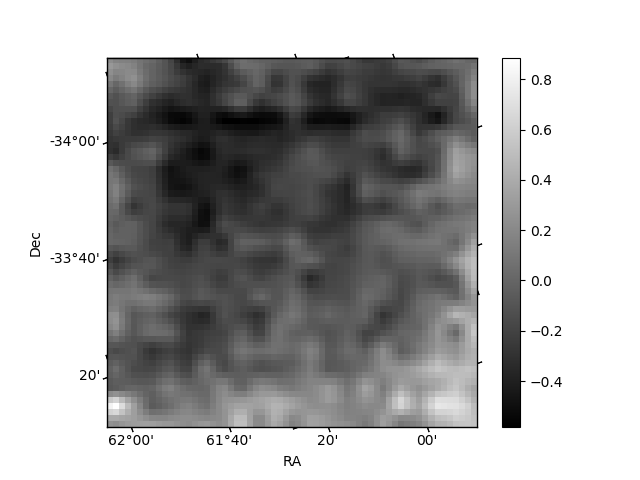
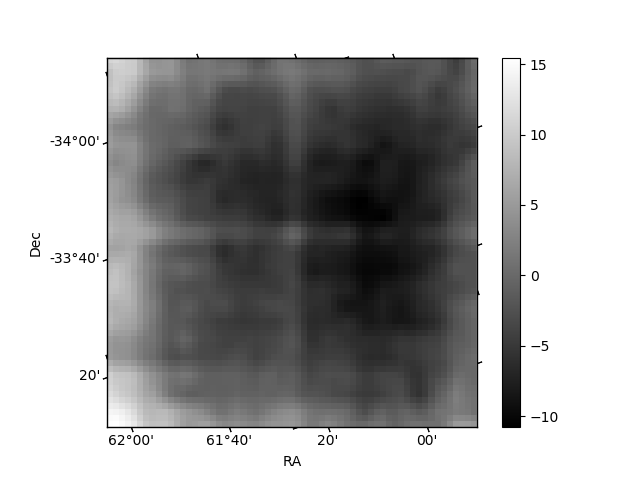
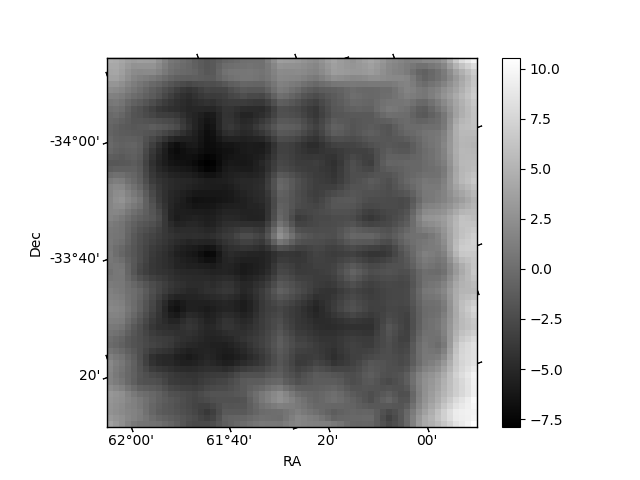
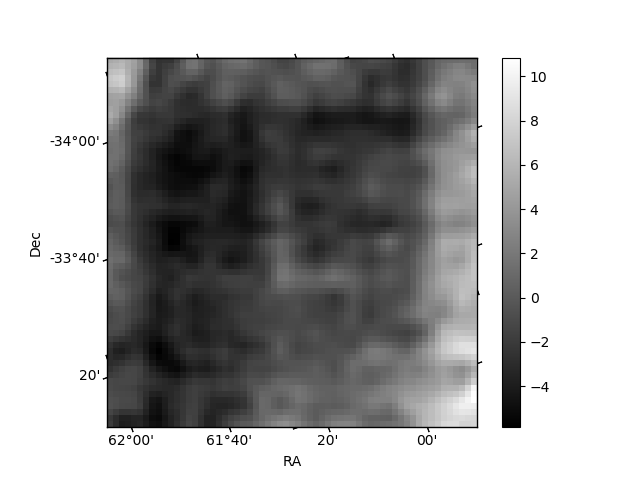
Histogram calculated using DETX and DETY for each event in the final _common_clean file
| Quadrant A | 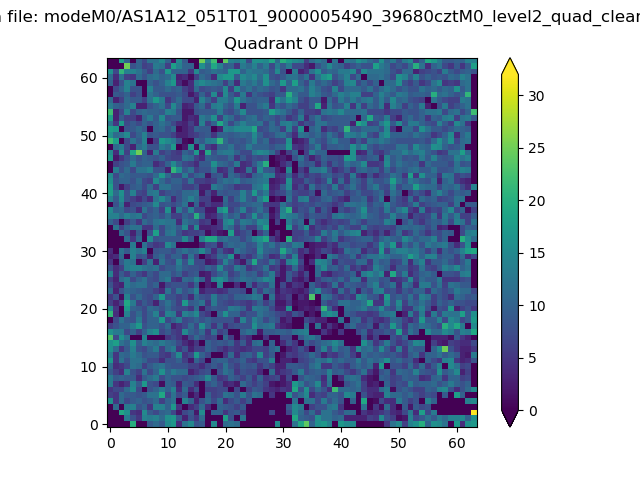 |
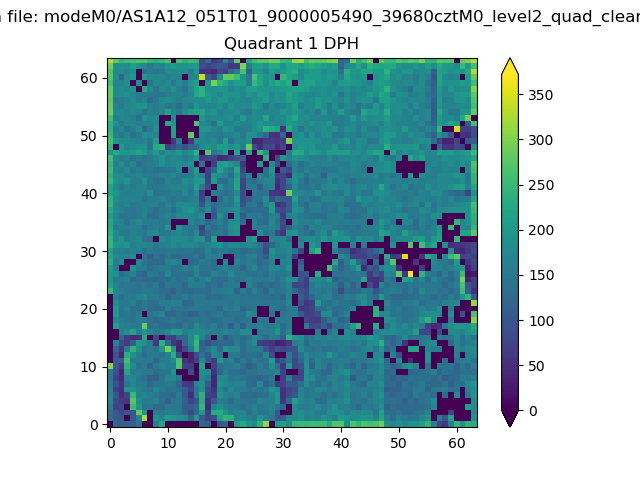 |
Quadrant B |
|---|---|---|---|
| Quadrant D | 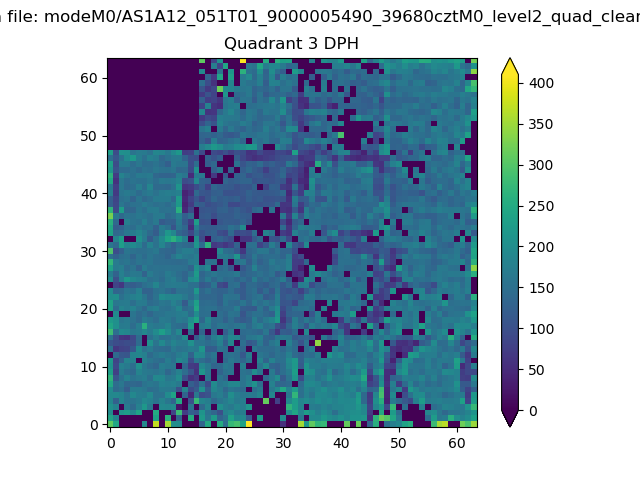 |
 |
Quadrant C |
| Plot type | Count rate plots | Images |
|---|---|---|
| Comparison with Poisson distribution Blue bars denote a histogram of data divided into 1 sec bins. Red curve is a Poisson curve with rate = median count rate of data. |
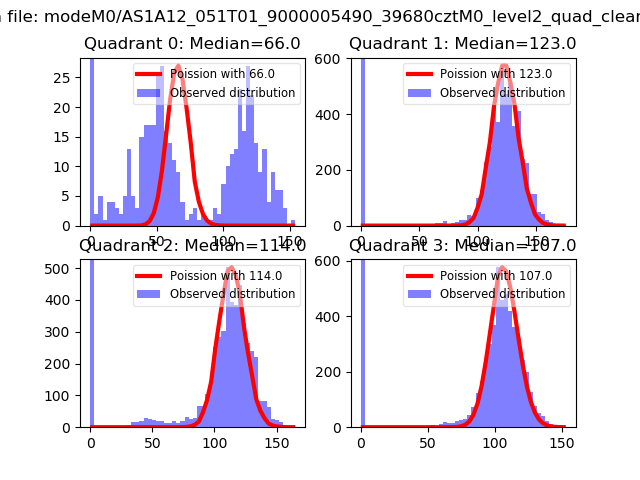 |
 |
| Quadrant-wise count rates Data is divided into 100 sec bins |
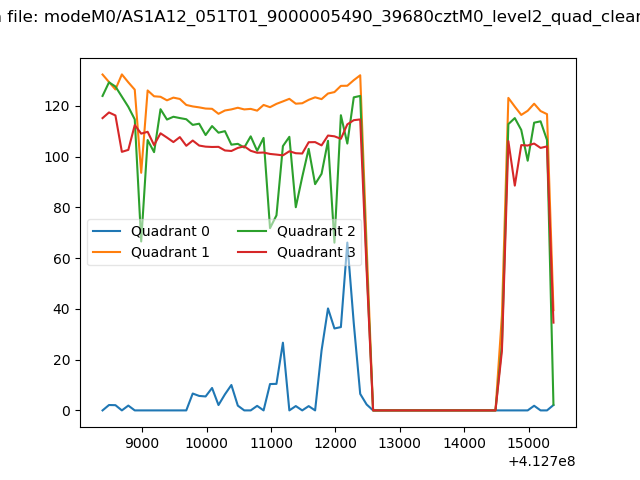 |
|
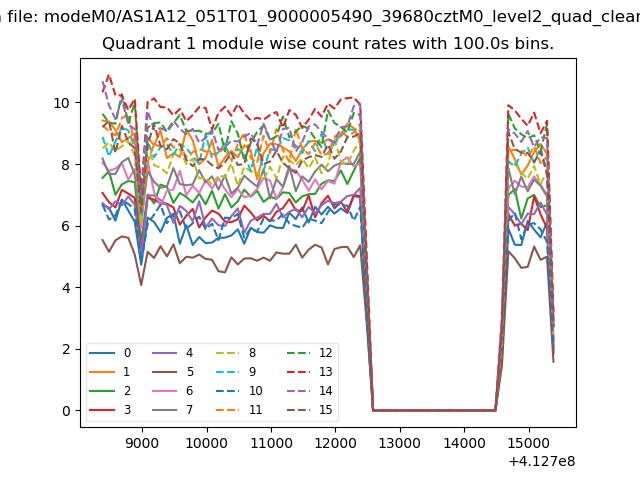
| Module-wise count rates for Quadrant A Data is divided into 100 sec bins |
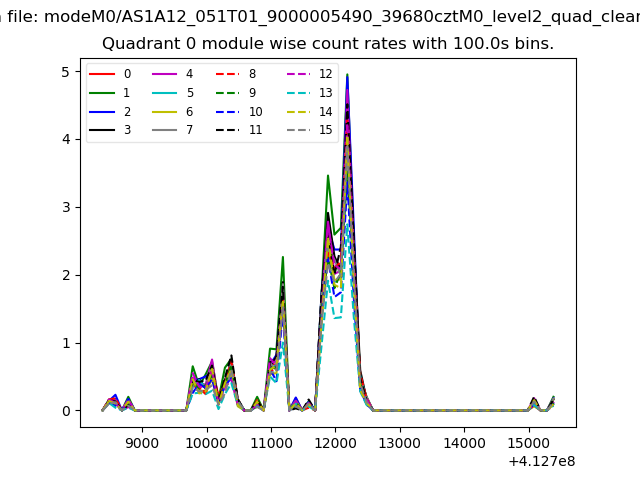 |
 |
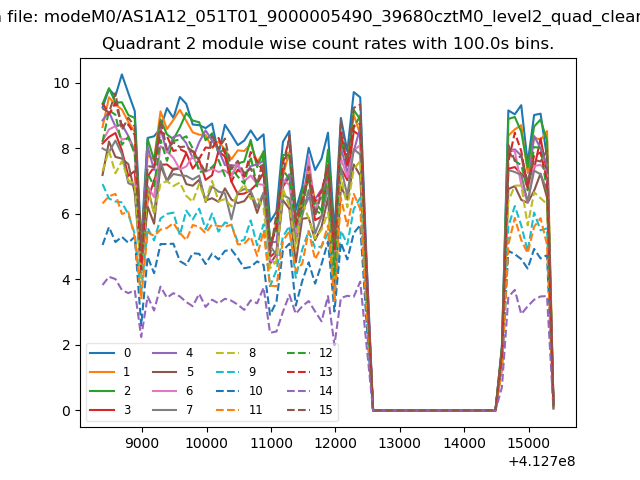
| Module-wise count rates for Quadrant B Data is divided into 100 sec bins |
 |
 |
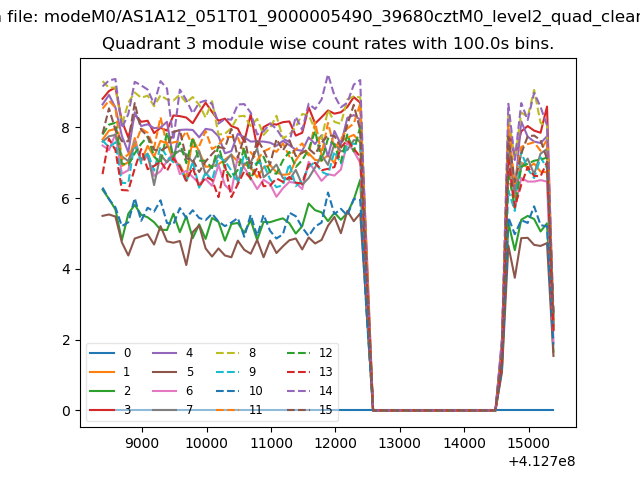
| Module-wise count rates for Quadrant C Data is divided into 100 sec bins |
 |
 |
| Module-wise count rates for Quadrant D Data is divided into 100 sec bins |
 |
 |
| Parameter | Plot |
|---|---|
| CZT HV Monitor | 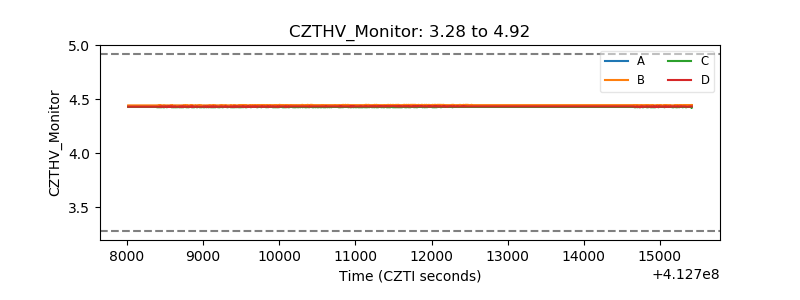 |
| D_VDD | 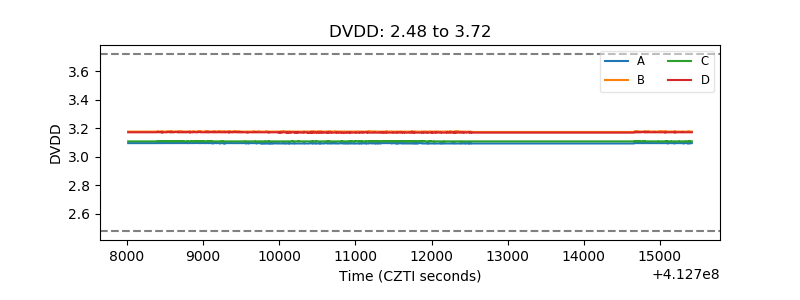 |
| Temperature 1 | 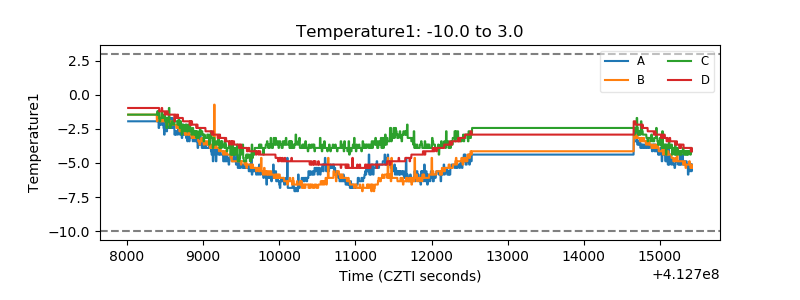 |
| Veto HV Monitor | 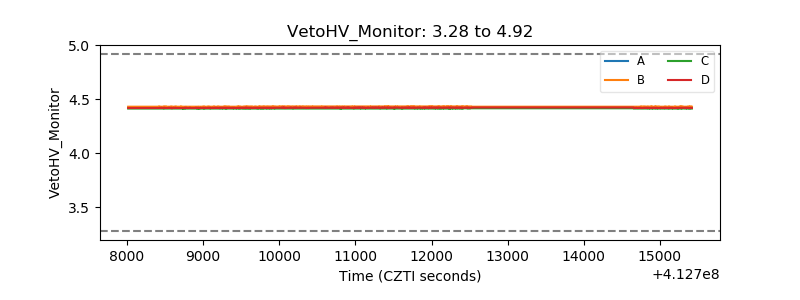 |
| Veto LLD | 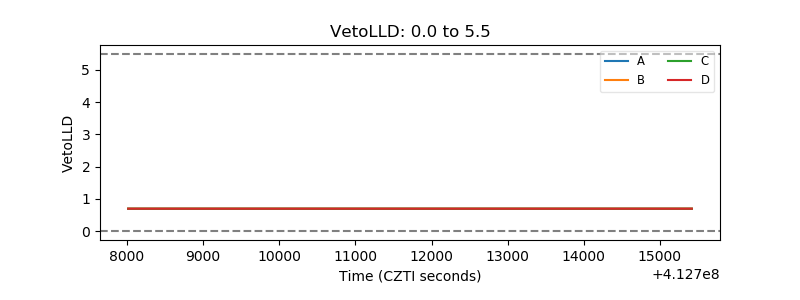 |
| Alpha Counter | 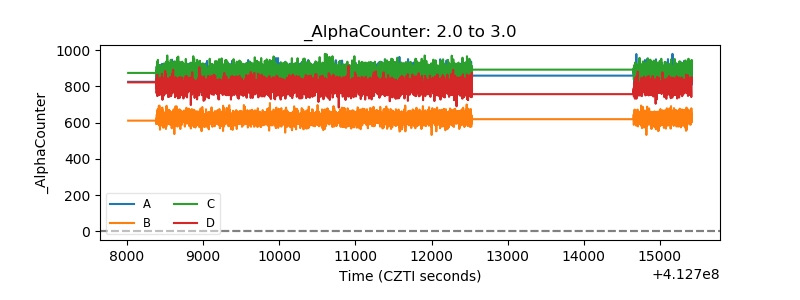 |
| _CPM_Rate | 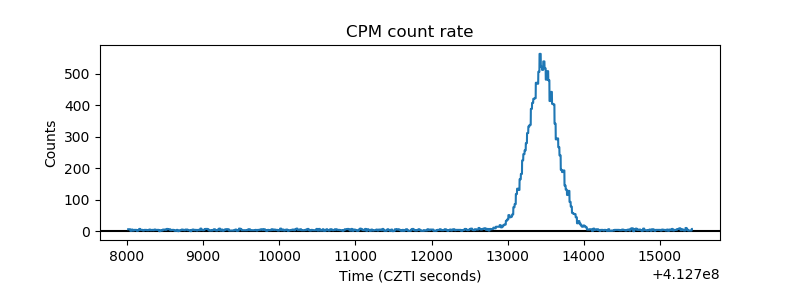 |
| CZT Counter | 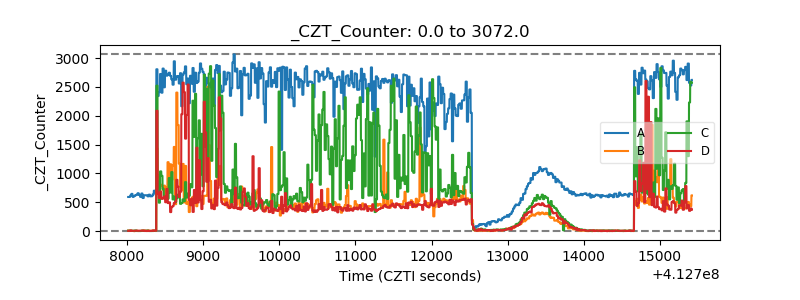 |
| +2.5 Volts monitor | 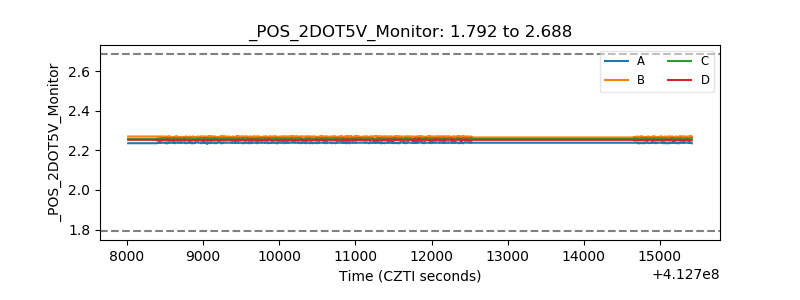 |
| +5 Volts monitor | 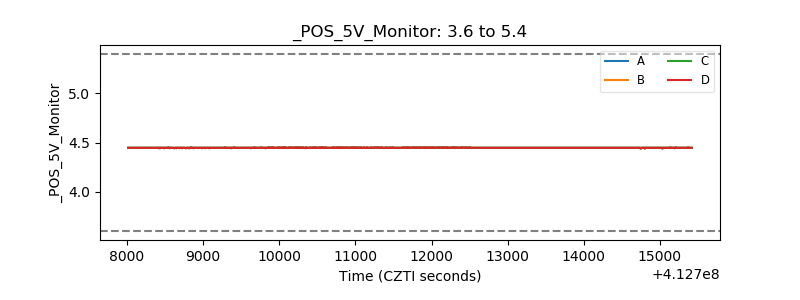 |
| _ROLL_ROT | 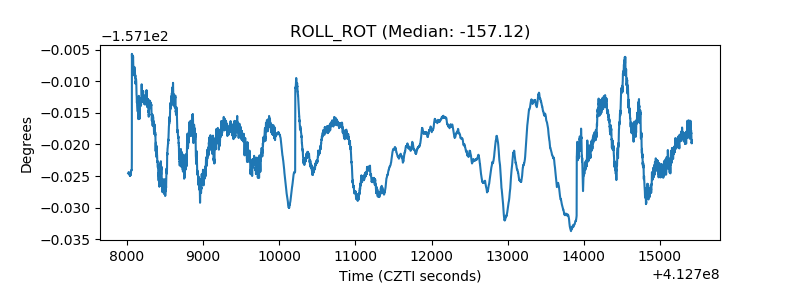 |
| _Roll_DEC | 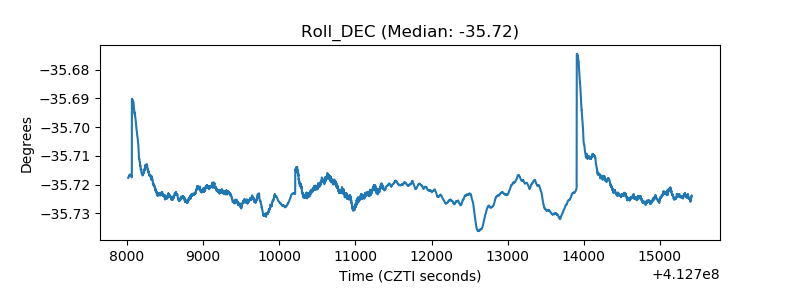 |
| _Roll_RA | 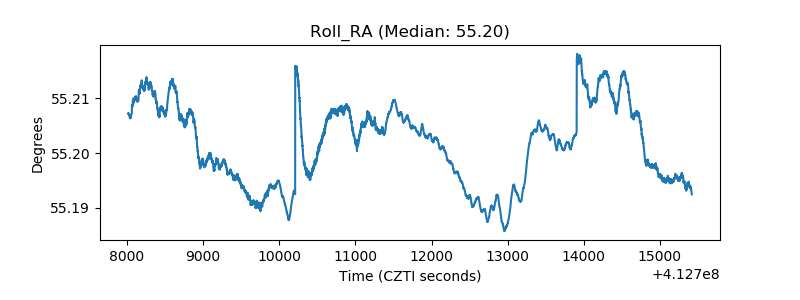 |
| Veto Counter | 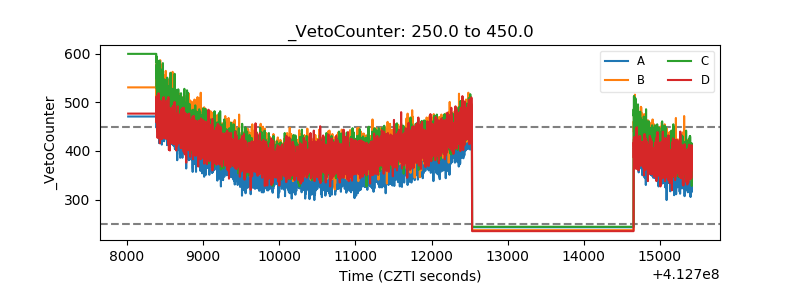 |