| Param | Original file | Final file |
|---|---|---|
| Filename | modeM0/AS1A12_051T01_9000005490_39681cztM0_level2.fits | modeM0/AS1A12_051T01_9000005490_39681cztM0_level2_quad_clean.evt |
| Size (bytes) | 601,277,760 | 68,374,080 |
| Size | 573.4 MB | 65.2 MB |
| Events in quadrant A | 11,319,067 | 121,864 |
| Events in quadrant B | 2,977,440 | 579,862 |
| Events in quadrant C | 4,778,730 | 513,152 |
| Events in quadrant D | 2,791,787 | 503,606 |
| Mode M9 | |||
|---|---|---|---|
| Quadrant | BADHDUFLAG | Total packets | Discarded packets |
| A | 0 | 26 | 0 |
| B | 0 | 26 | 0 |
| C | 0 | 26 | 0 |
| D | 0 | 27 | 0 |
| Mode M0 | |||
|---|---|---|---|
| Quadrant | BADHDUFLAG | Total packets | Discarded packets |
| A | 0 | 37100 | 3 |
| B | 0 | 12245 | 2 |
| C | 0 | 17624 | 2 |
| D | 0 | 12020 | 2 |
| Mode SS | |||
|---|---|---|---|
| Quadrant | BADHDUFLAG | Total packets | Discarded packets |
| A | 0 | 102 | 0 |
| B | 0 | 102 | 0 |
| C | 0 | 102 | 0 |
| D | 0 | 102 | 0 |
| Quadrant | Total seconds | Saturated seconds | Saturation percentage |
|---|---|---|---|
| A | 5018 | 4089 | 81.486648% |
| B | 5018 | 137 | 2.730171% |
| C | 5018 | 487 | 9.705062% |
| D | 5018 | 137 | 2.730171% |
Noise dominated data is calculated using 1-second bins in cleaned event files. If a bin has >2000 counts, and if more than 50% of those come from <1% of pixels, then it is considered to be noise-dominated and hence unusable.
| Quadrant | # 1 sec bins | Bins with >0 counts | Bins with >2000 counts | High rate bins dominated by noise | Noise dominated (total time) | Noise dominated (detector-on time) | Marked lightcurve |
|---|---|---|---|---|---|---|---|
| A | 6991 | 5019 | 3386 | 3386 | 48.43% | 67.46% | 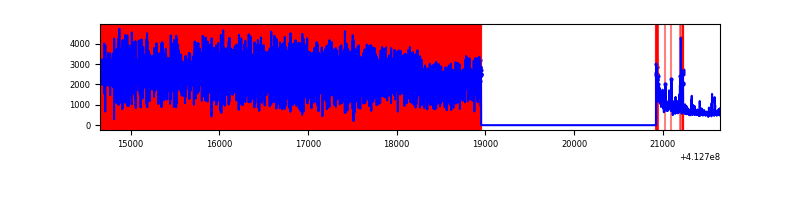 |
| B | 6991 | 5019 | 95 | 95 | 1.36% | 1.89% | 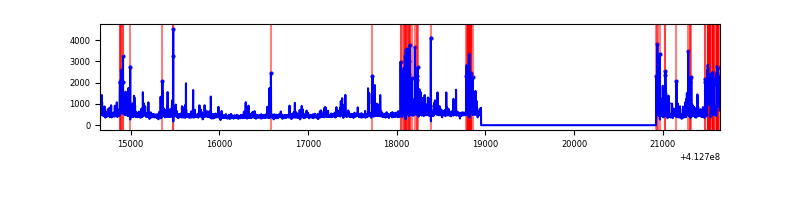 |
| C | 6991 | 5019 | 432 | 432 | 6.18% | 8.61% | 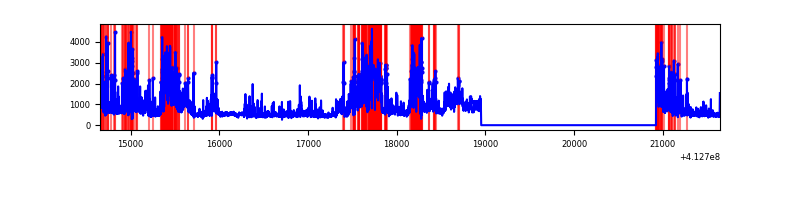 |
| D | 6991 | 5019 | 111 | 111 | 1.59% | 2.21% | 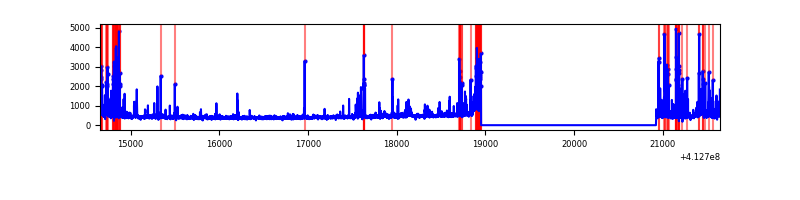 |
Top three noisy pixels from each quadrant. If the there are fewer than three noisy pixels in the level2.evt file, extra rows are filled as -1
| Pixel properties | Quadrant properties | ||||||
|---|---|---|---|---|---|---|---|
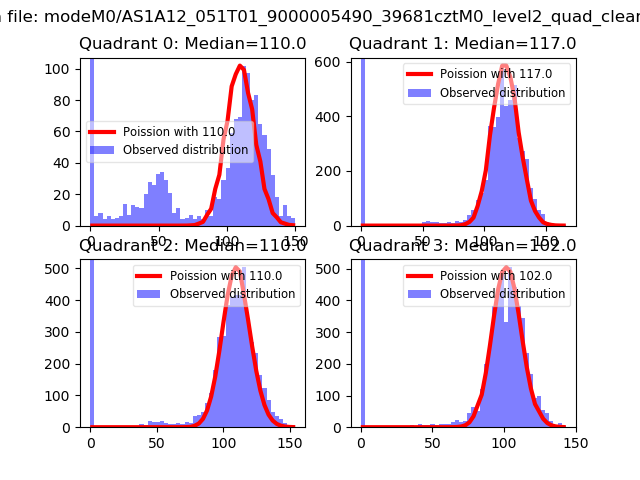
| Quadrant | DetID | PixID | Counts | Sigma | Mean | Median | Sigma |
| A | 15 | 222 | 9086310 | 126717.14 | 346 | 340 | 71.7 |
| A | 15 | 174 | 496693 | 6922.37 | 346 | 340 | 71.7 |
| A | 10 | 83 | 294267 | 4099.24 | 346 | 340 | 71.7 |
| B | 5 | 172 | 440107 | 4150.36 | 548 | 534 | 105.9 |
| B | 10 | 246 | 235645 | 2219.87 | 548 | 534 | 105.9 |
| B | 5 | 255 | 84075 | 788.78 | 548 | 534 | 105.9 |
| C | 9 | 187 | 1652267 | 13546.55 | 520 | 523 | 121.9 |
| C | 15 | 208 | 782075 | 6409.79 | 520 | 523 | 121.9 |
| C | 15 | 214 | 206303 | 1687.68 | 520 | 523 | 121.9 |
| D | 12 | 218 | 195602 | 1509.25 | 529 | 514 | 129.3 |
| D | 2 | 250 | 152426 | 1175.23 | 529 | 514 | 129.3 |
| D | 13 | 171 | 115462 | 889.27 | 529 | 514 | 129.3 |
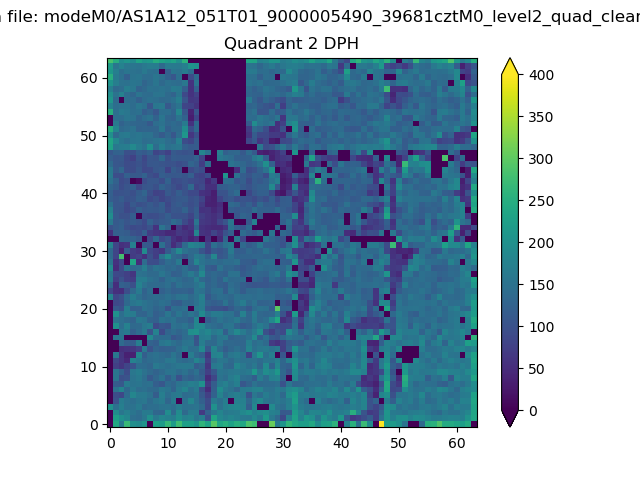
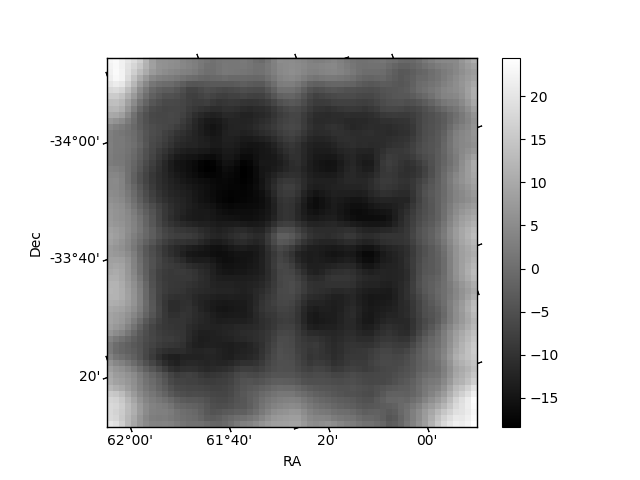
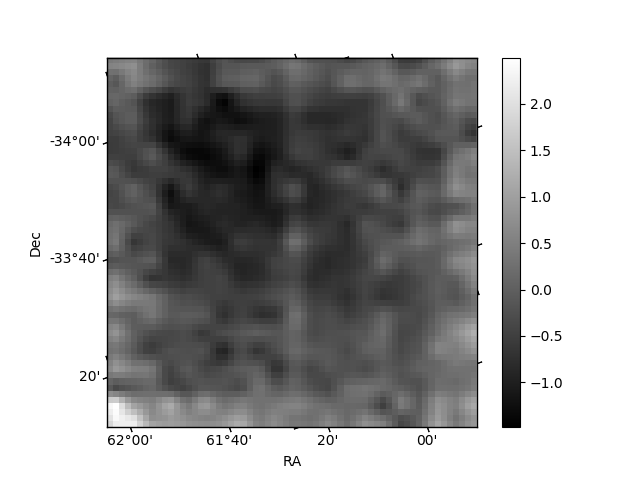
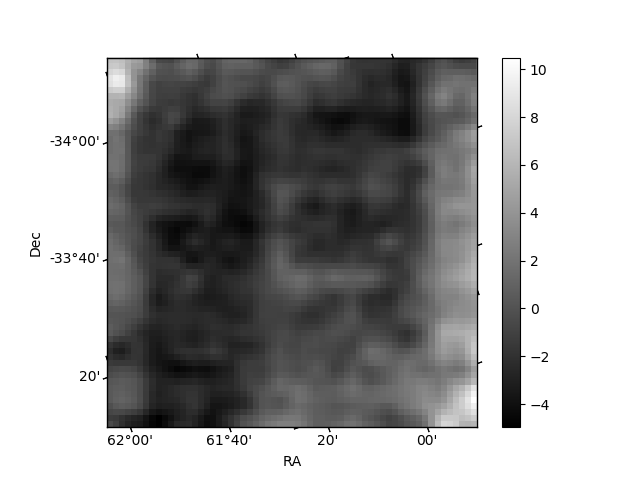
Histogram calculated using DETX and DETY for each event in the final _common_clean file
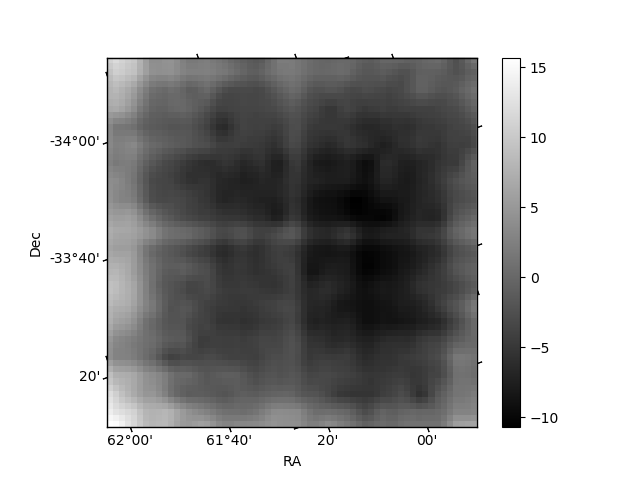
| Quadrant A | 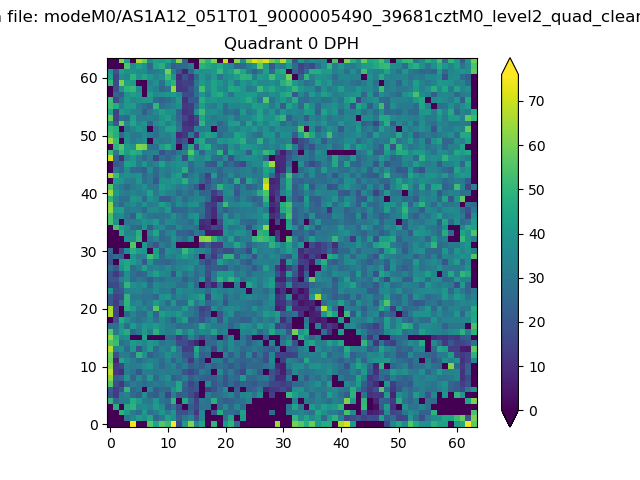 |
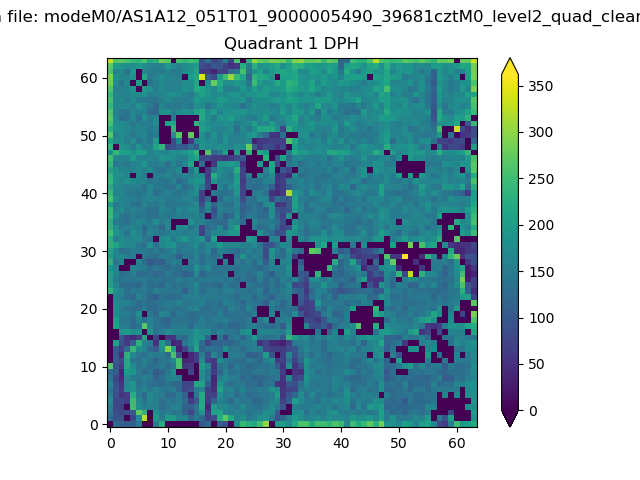 |
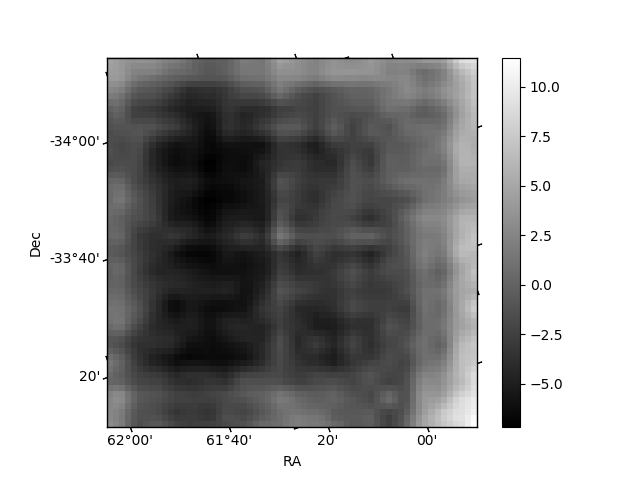
Quadrant B |
|---|---|---|---|
| Quadrant D | 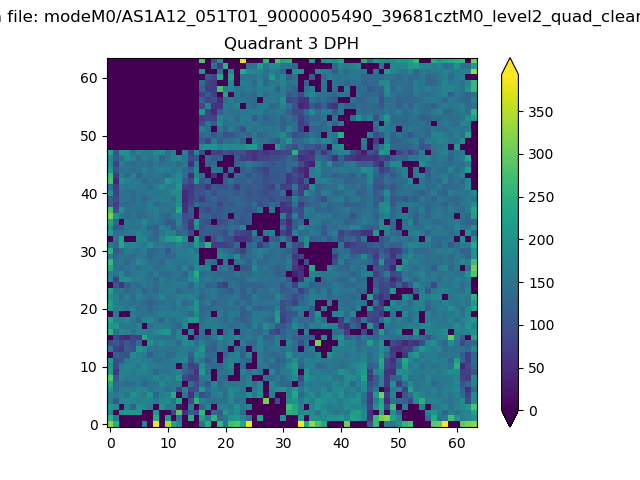 |
 |
Quadrant C |
| Plot type | Count rate plots | Images |
|---|---|---|
| Comparison with Poisson distribution Blue bars denote a histogram of data divided into 1 sec bins. Red curve is a Poisson curve with rate = median count rate of data. |
 |
 |
| Quadrant-wise count rates Data is divided into 100 sec bins |
 |
|
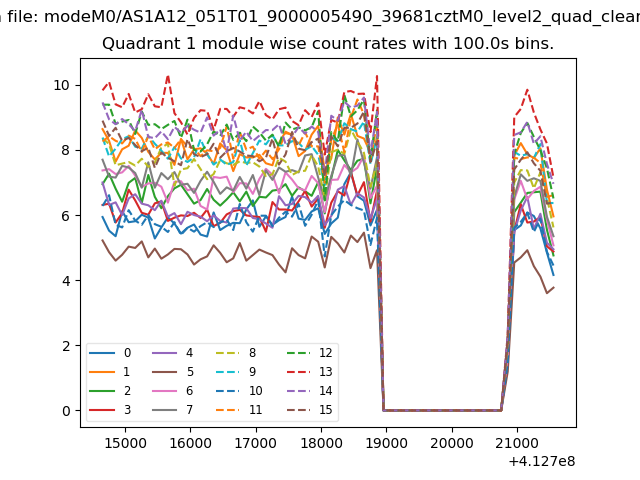
| Module-wise count rates for Quadrant A Data is divided into 100 sec bins |
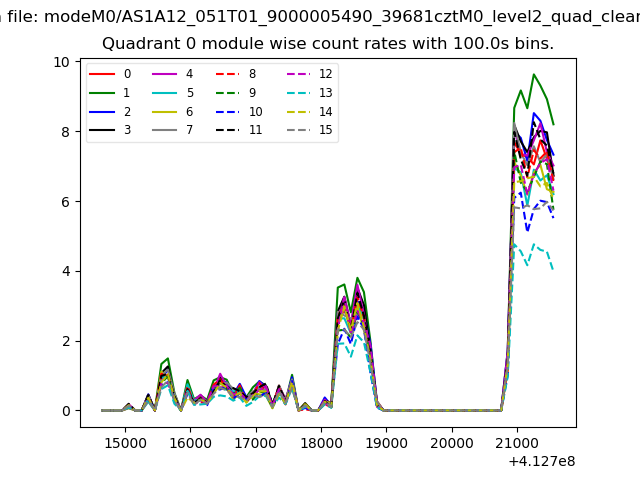 |
 |
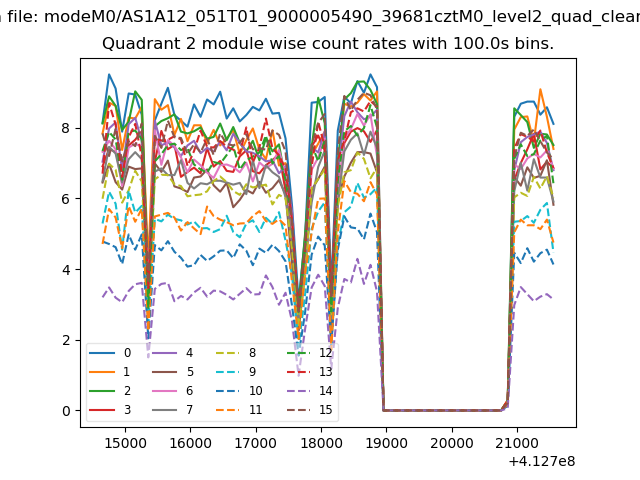
| Module-wise count rates for Quadrant B Data is divided into 100 sec bins |
 |
 |
| Module-wise count rates for Quadrant C Data is divided into 100 sec bins |
 |
 |
| Module-wise count rates for Quadrant D Data is divided into 100 sec bins |
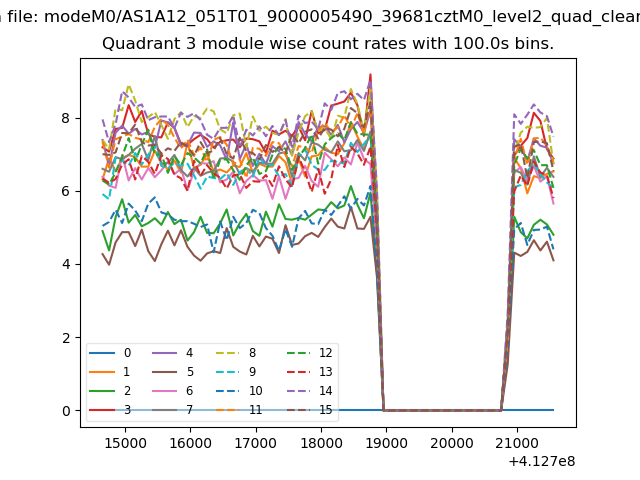 |
 |
| Parameter | Plot |
|---|---|
| CZT HV Monitor | 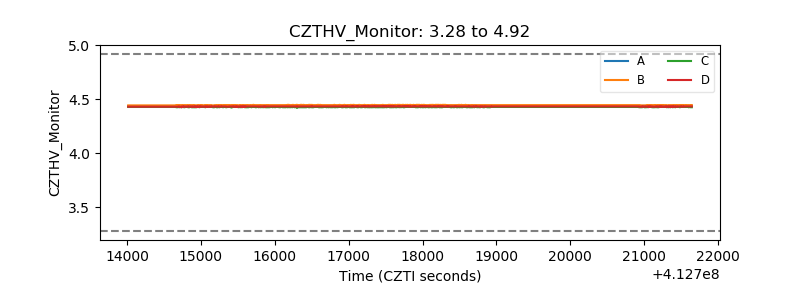 |
| D_VDD | 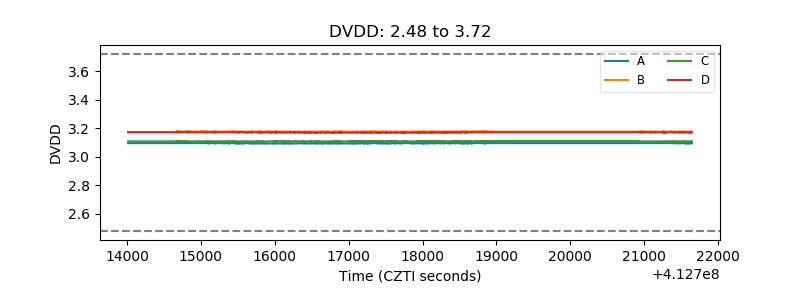 |
| Temperature 1 | 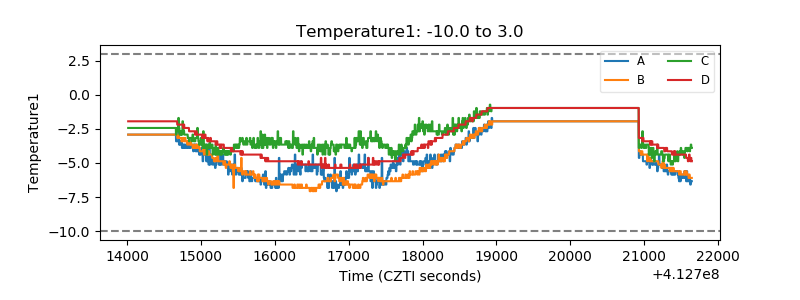 |
| Veto HV Monitor | 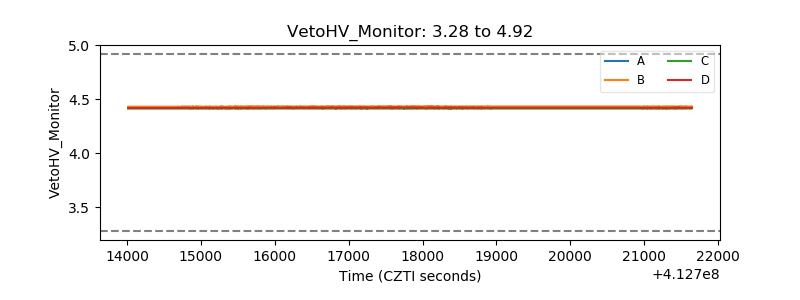 |
| Veto LLD | 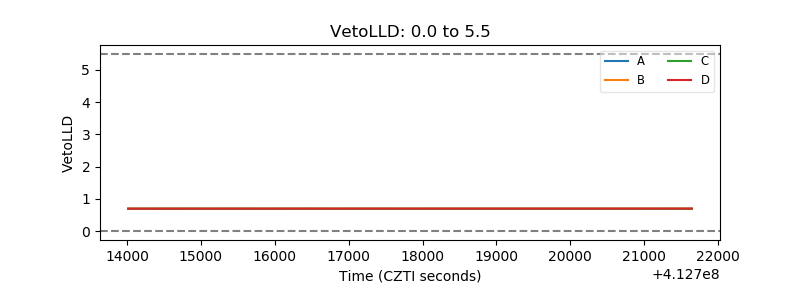 |
| Alpha Counter | 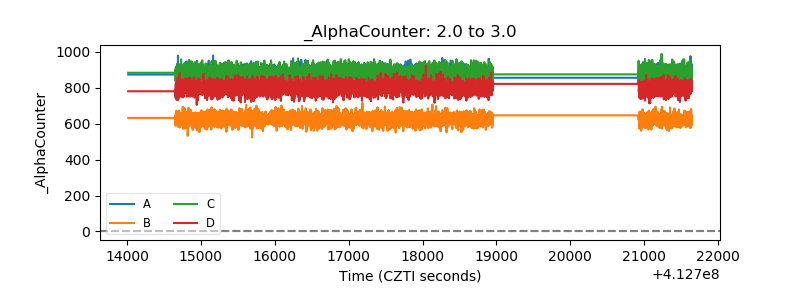 |
| _CPM_Rate | 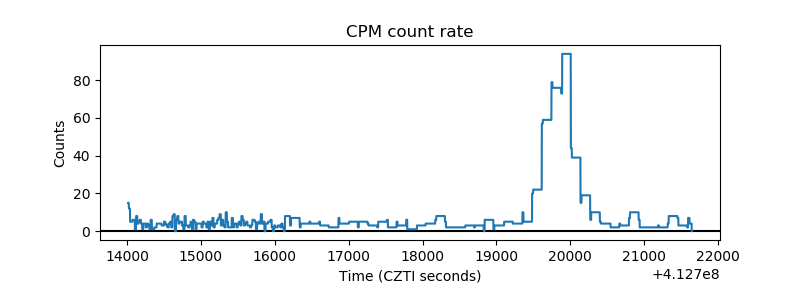 |
| CZT Counter | 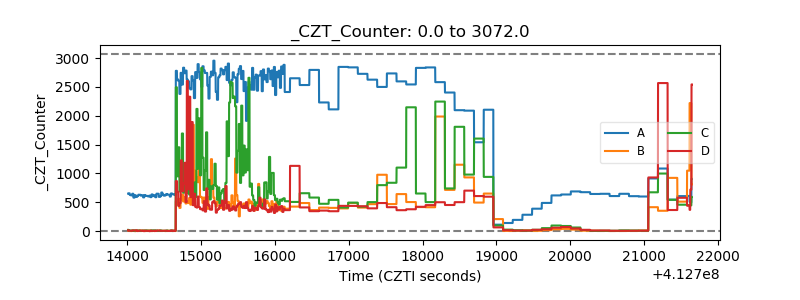 |
| +2.5 Volts monitor | 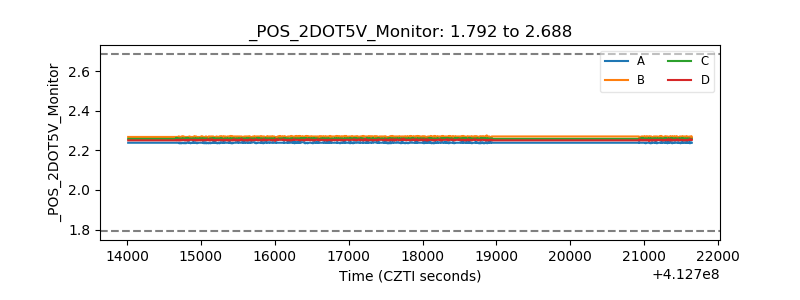 |
| +5 Volts monitor | 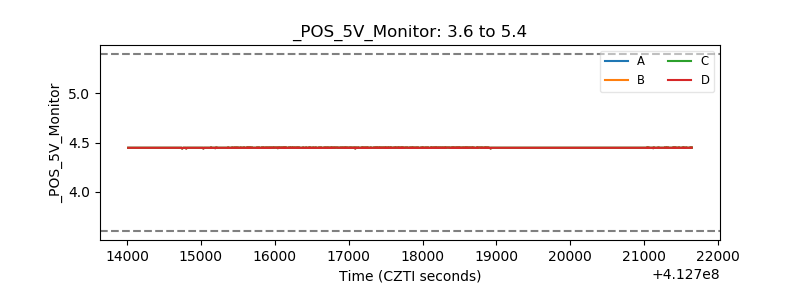 |
| _ROLL_ROT | 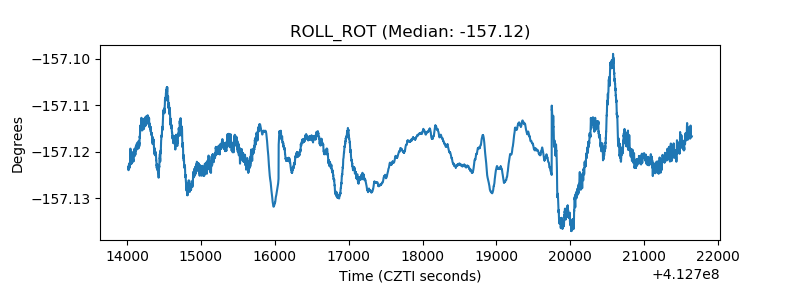 |
| _Roll_DEC | 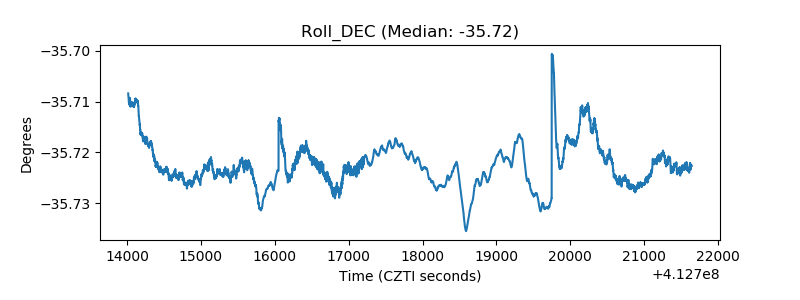 |
| _Roll_RA | 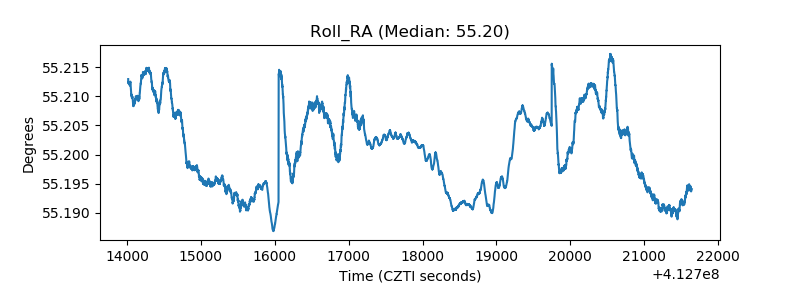 |
| Veto Counter | 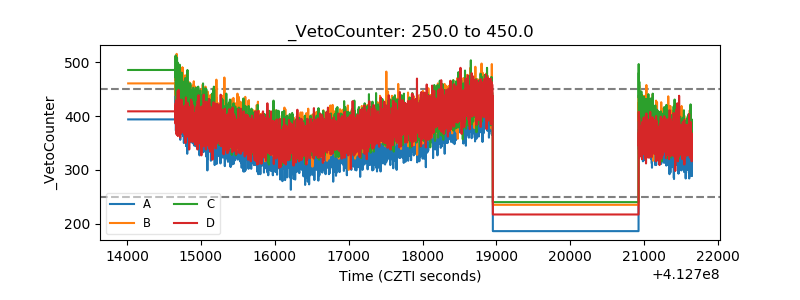 |