| Param | Original file | Final file |
|---|---|---|
| Filename | modeM0/AS1A12_051T01_9000005490_39682cztM0_level2.fits | modeM0/AS1A12_051T01_9000005490_39682cztM0_level2_quad_clean.evt |
| Size (bytes) | 533,505,600 | 85,613,760 |
| Size | 508.8 MB | 81.6 MB |
| Events in quadrant A | 7,805,764 | 513,056 |
| Events in quadrant B | 3,331,243 | 616,911 |
| Events in quadrant C | 4,890,058 | 548,502 |
| Events in quadrant D | 3,298,492 | 532,206 |
| Mode M9 | |||
|---|---|---|---|
| Quadrant | BADHDUFLAG | Total packets | Discarded packets |
| A | 0 | 26 | 0 |
| B | 0 | 26 | 0 |
| C | 0 | 26 | 0 |
| D | 0 | 27 | 0 |
| Mode M0 | |||
|---|---|---|---|
| Quadrant | BADHDUFLAG | Total packets | Discarded packets |
| A | 0 | 27021 | 3 |
| B | 0 | 13645 | 2 |
| C | 0 | 18150 | 2 |
| D | 0 | 13830 | 2 |
| Mode SS | |||
|---|---|---|---|
| Quadrant | BADHDUFLAG | Total packets | Discarded packets |
| A | 0 | 110 | 0 |
| B | 0 | 110 | 0 |
| C | 0 | 110 | 0 |
| D | 0 | 110 | 0 |
| Quadrant | Total seconds | Saturated seconds | Saturation percentage |
|---|---|---|---|
| A | 5454 | 1271 | 23.303997% |
| B | 5454 | 142 | 2.603594% |
| C | 5454 | 516 | 9.460946% |
| D | 5454 | 201 | 3.685369% |
Noise dominated data is calculated using 1-second bins in cleaned event files. If a bin has >2000 counts, and if more than 50% of those come from <1% of pixels, then it is considered to be noise-dominated and hence unusable.
| Quadrant | # 1 sec bins | Bins with >0 counts | Bins with >2000 counts | High rate bins dominated by noise | Noise dominated (total time) | Noise dominated (detector-on time) | Marked lightcurve |
|---|---|---|---|---|---|---|---|
| A | 7038 | 5455 | 1161 | 1161 | 16.50% | 21.28% | 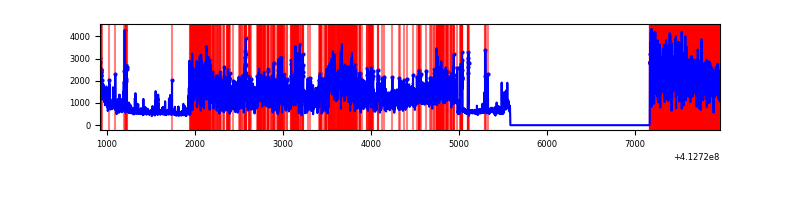 |
| B | 7038 | 5455 | 110 | 110 | 1.56% | 2.02% | 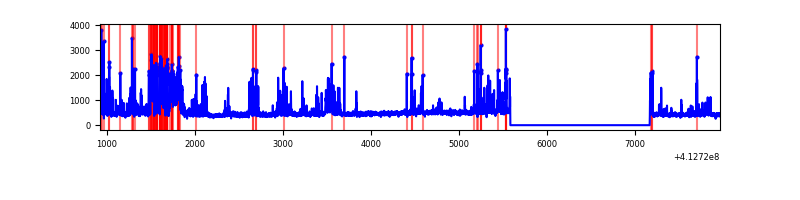 |
| C | 7038 | 5455 | 468 | 468 | 6.65% | 8.58% | 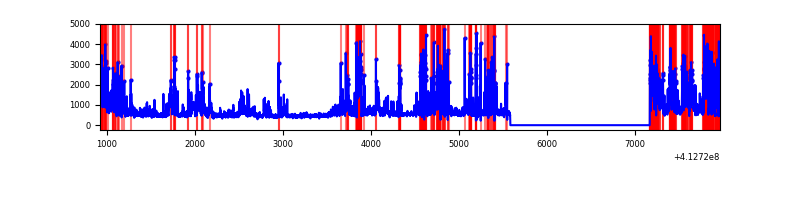 |
| D | 7038 | 5455 | 158 | 158 | 2.24% | 2.90% | 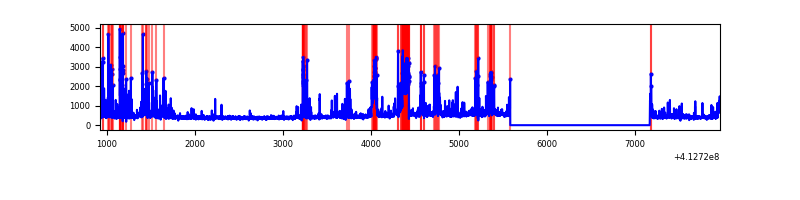 |
Top three noisy pixels from each quadrant. If the there are fewer than three noisy pixels in the level2.evt file, extra rows are filled as -1
| Pixel properties | Quadrant properties | ||||||
|---|---|---|---|---|---|---|---|
| Quadrant | DetID | PixID | Counts | Sigma | Mean | Median | Sigma |
| A | 15 | 222 | 4708780 | 40531.07 | 562 | 551 | 116.2 |
| A | 10 | 83 | 413632 | 3556.03 | 562 | 551 | 116.2 |
| A | 15 | 174 | 255052 | 2190.89 | 562 | 551 | 116.2 |
| B | 5 | 172 | 813172 | 7019.74 | 595 | 579 | 115.8 |
| B | 10 | 246 | 104455 | 897.35 | 595 | 579 | 115.8 |
| B | 0 | 186 | 22470 | 189.11 | 595 | 579 | 115.8 |
| C | 9 | 187 | 1299896 | 9801.65 | 565 | 569 | 132.6 |
| C | 15 | 208 | 1055220 | 7955.9 | 565 | 569 | 132.6 |
| C | 15 | 214 | 220423 | 1658.5 | 565 | 569 | 132.6 |
| D | 2 | 250 | 358777 | 2532.53 | 576 | 557 | 141.4 |
| D | 12 | 218 | 353265 | 2493.56 | 576 | 557 | 141.4 |
| D | 13 | 171 | 113813 | 800.69 | 576 | 557 | 141.4 |
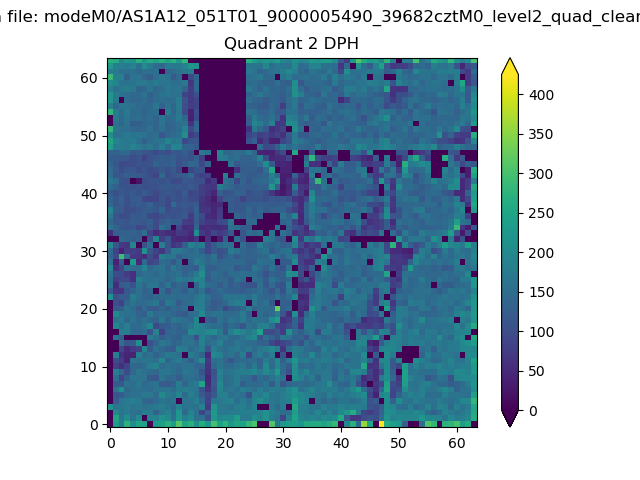
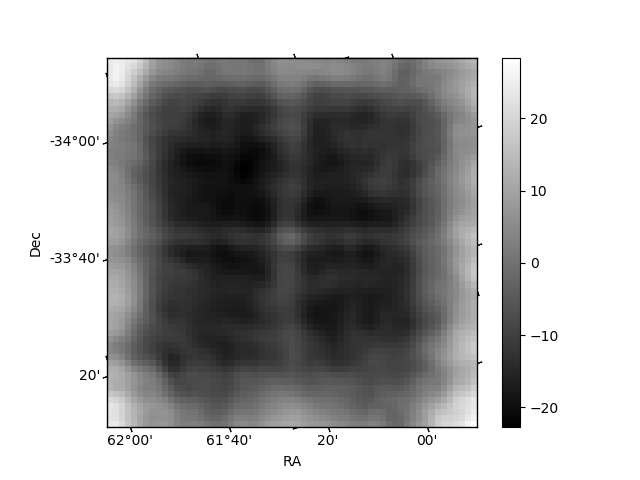
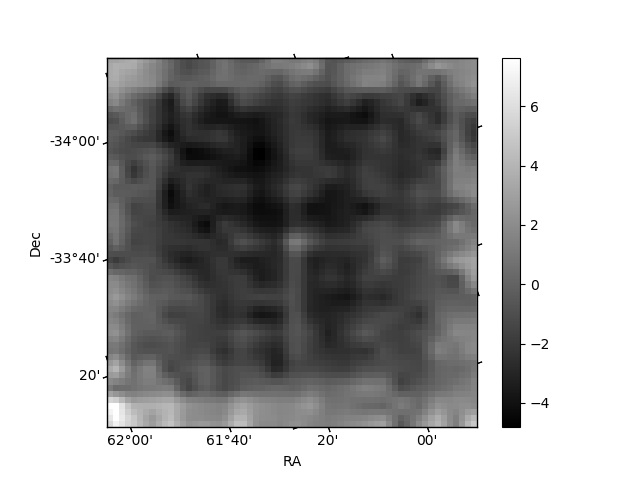
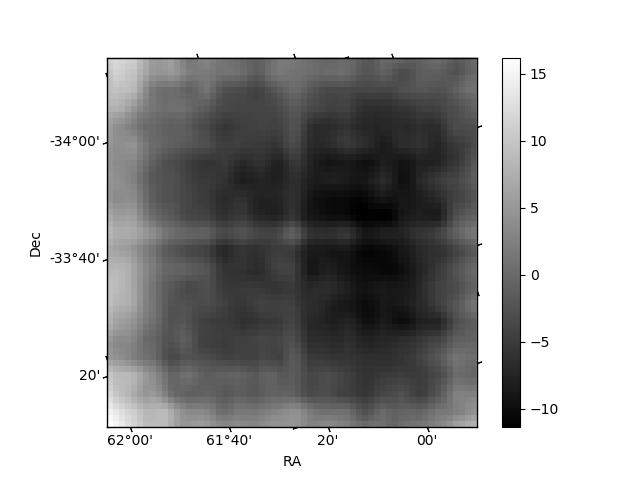
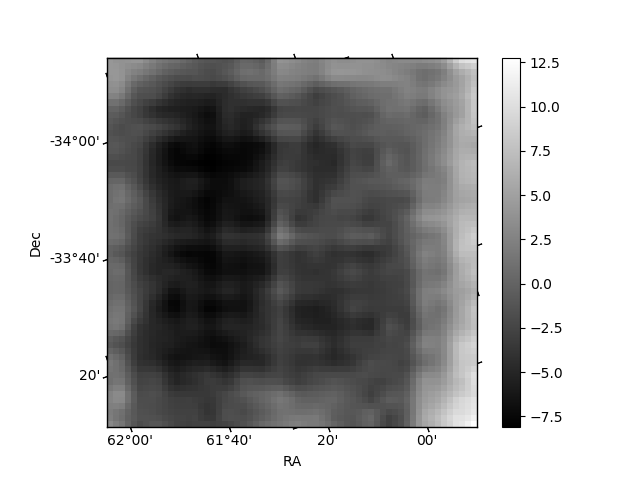
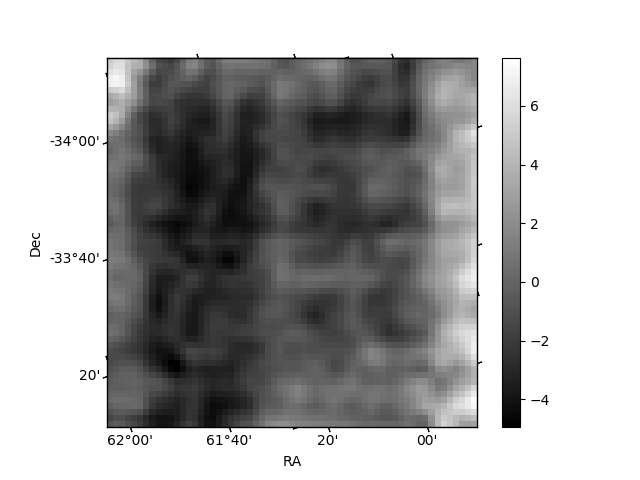
Histogram calculated using DETX and DETY for each event in the final _common_clean file
| Quadrant A | 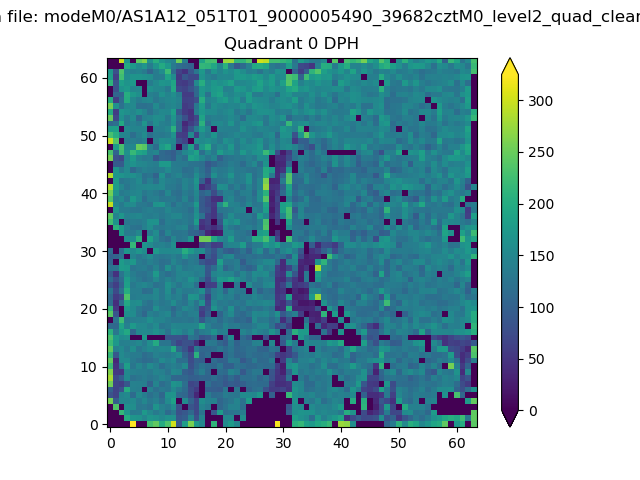 |
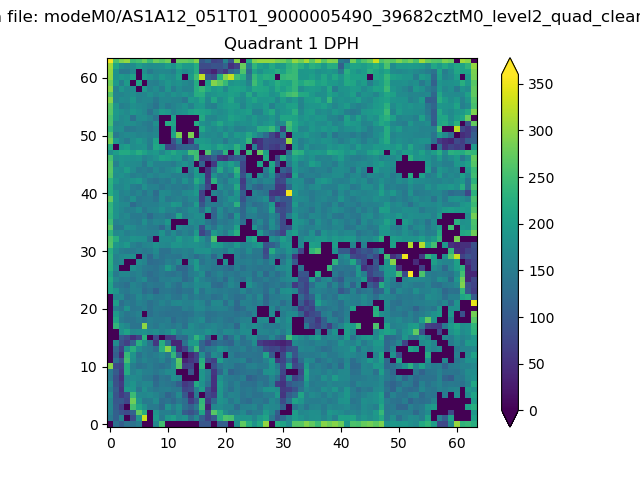 |
Quadrant B |
|---|---|---|---|
| Quadrant D | 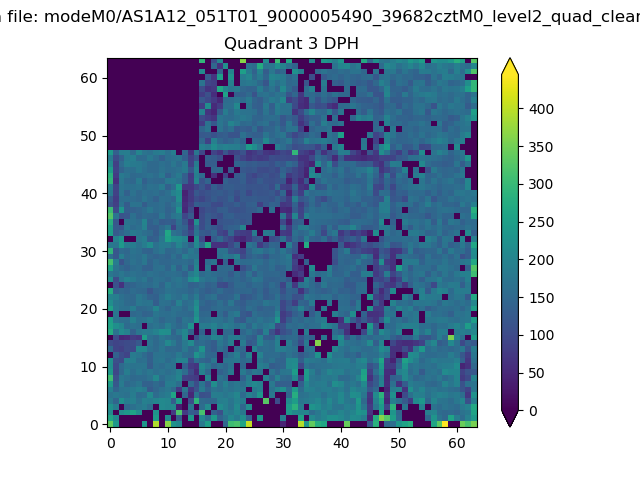 |
 |
Quadrant C |
| Plot type | Count rate plots | Images |
|---|---|---|
| Comparison with Poisson distribution Blue bars denote a histogram of data divided into 1 sec bins. Red curve is a Poisson curve with rate = median count rate of data. |
 |
 |
| Quadrant-wise count rates Data is divided into 100 sec bins |
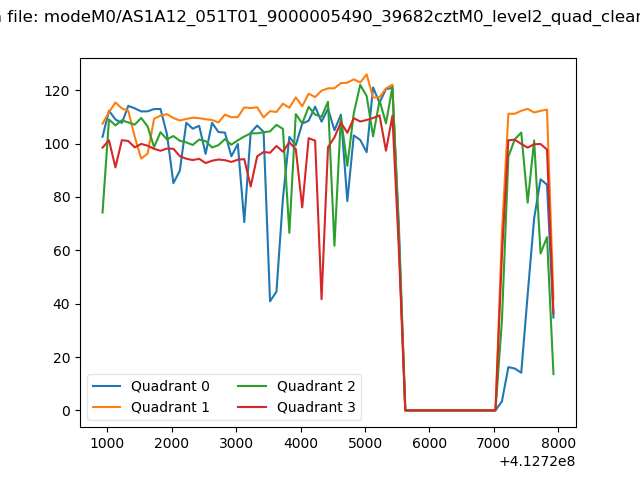 |
|
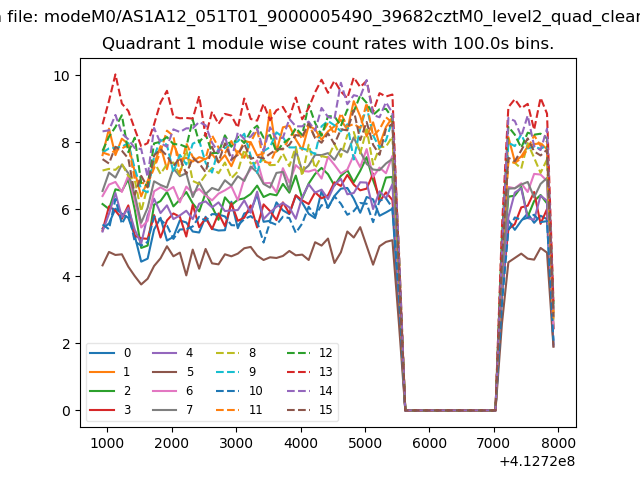
| Module-wise count rates for Quadrant A Data is divided into 100 sec bins |
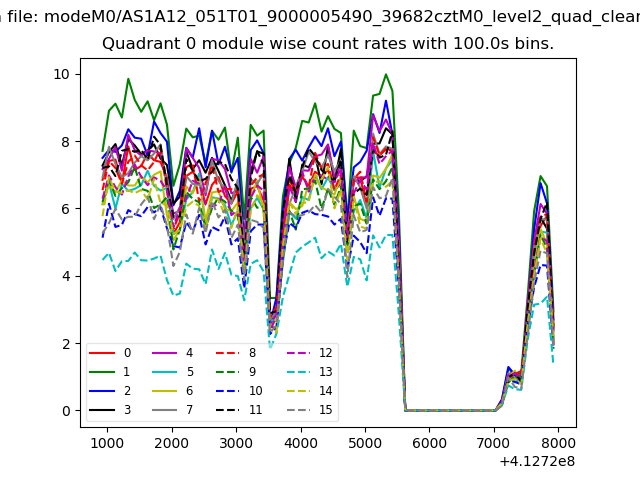 |
 |
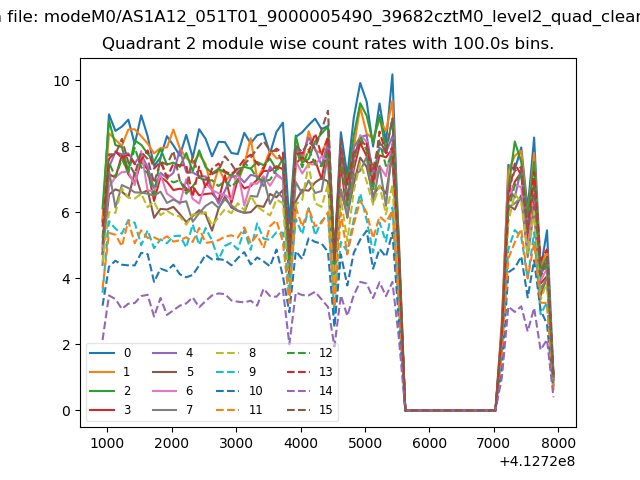
| Module-wise count rates for Quadrant B Data is divided into 100 sec bins |
 |
 |
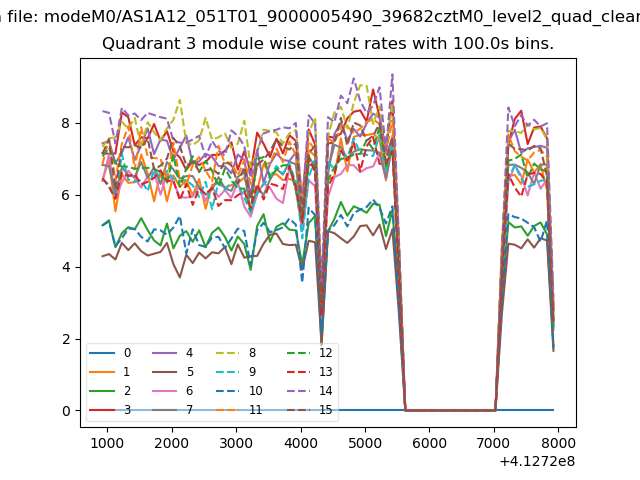
| Module-wise count rates for Quadrant C Data is divided into 100 sec bins |
 |
 |
| Module-wise count rates for Quadrant D Data is divided into 100 sec bins |
 |
 |
| Parameter | Plot |
|---|---|
| CZT HV Monitor | 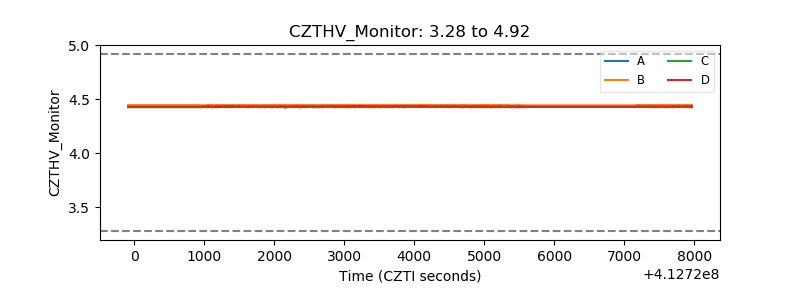 |
| D_VDD | 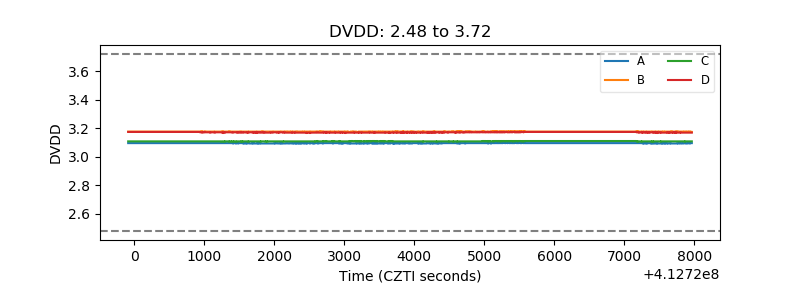 |
| Temperature 1 | 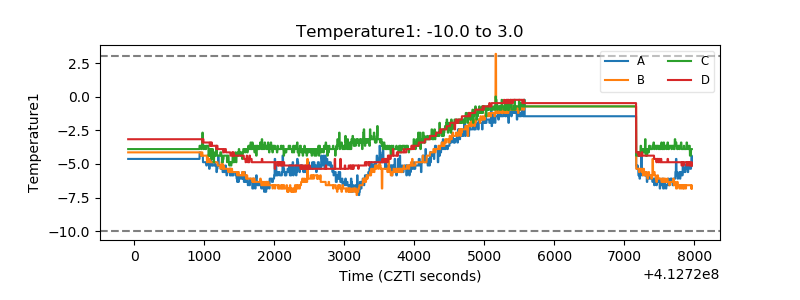 |
| Veto HV Monitor | 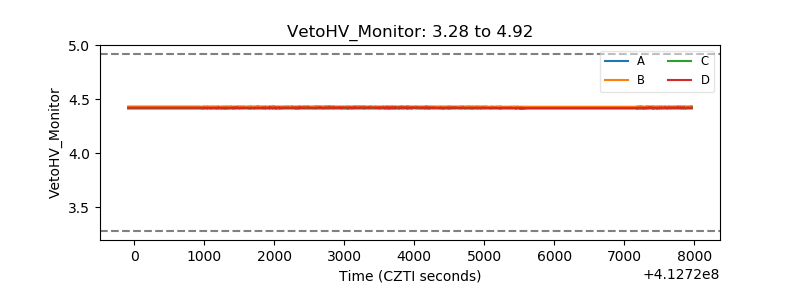 |
| Veto LLD | 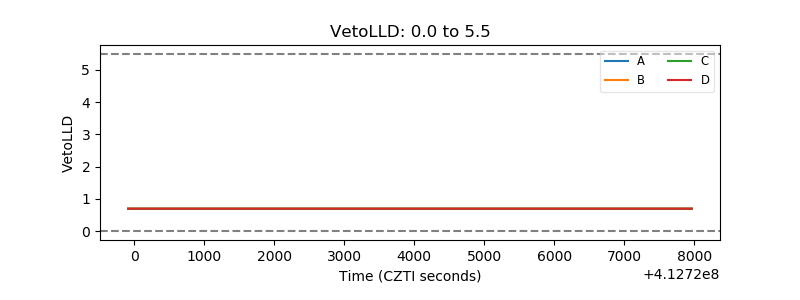 |
| Alpha Counter | 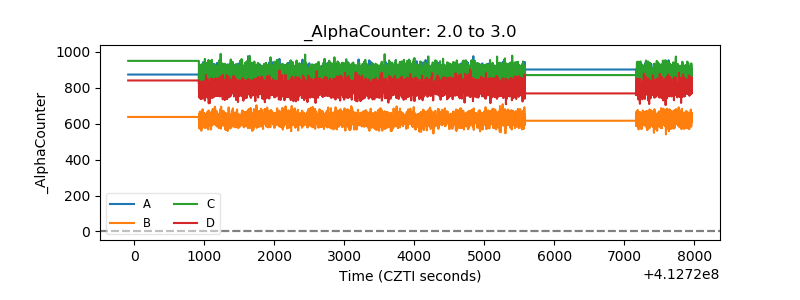 |
| _CPM_Rate | 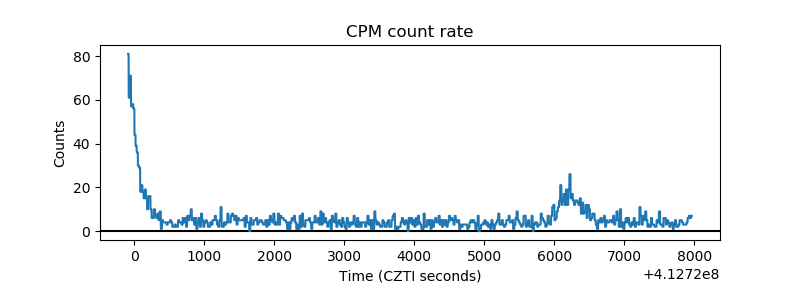 |
| CZT Counter | 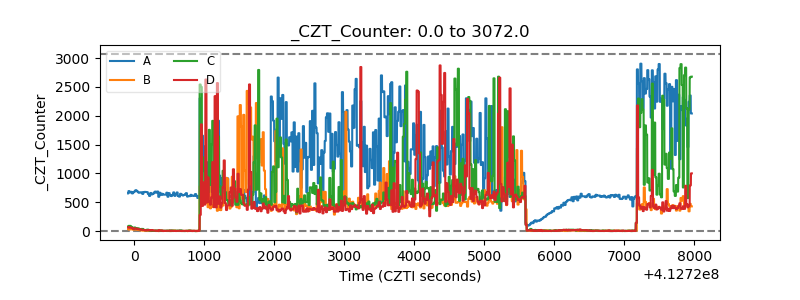 |
| +2.5 Volts monitor | 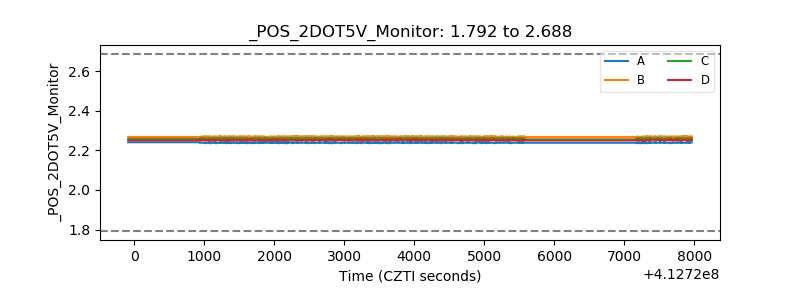 |
| +5 Volts monitor | 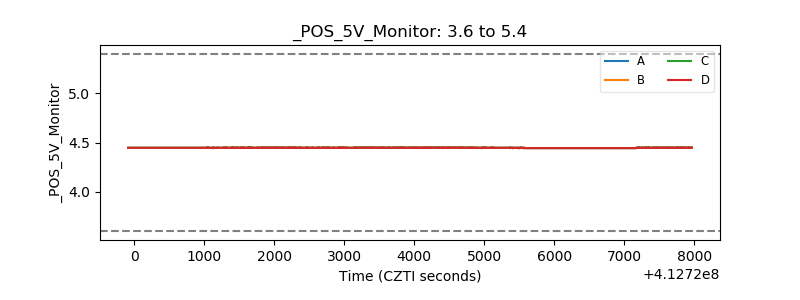 |
| _ROLL_ROT | 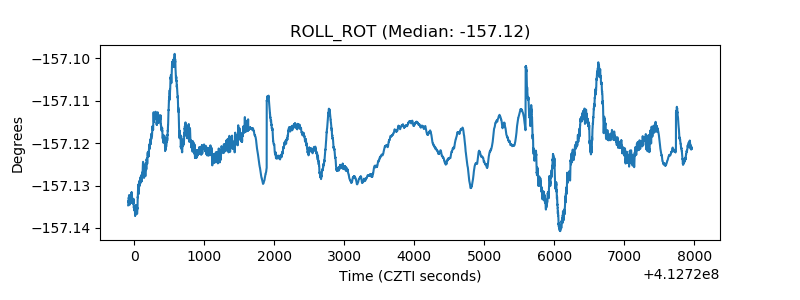 |
| _Roll_DEC | 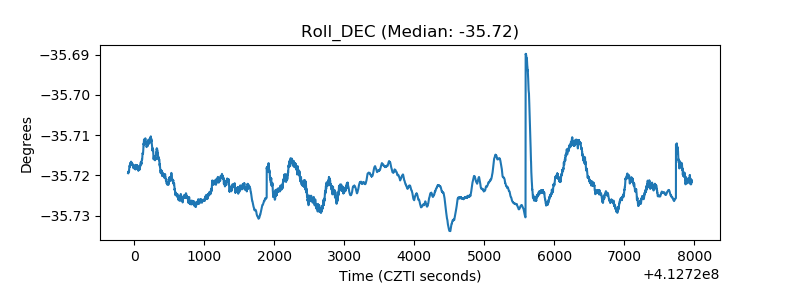 |
| _Roll_RA | 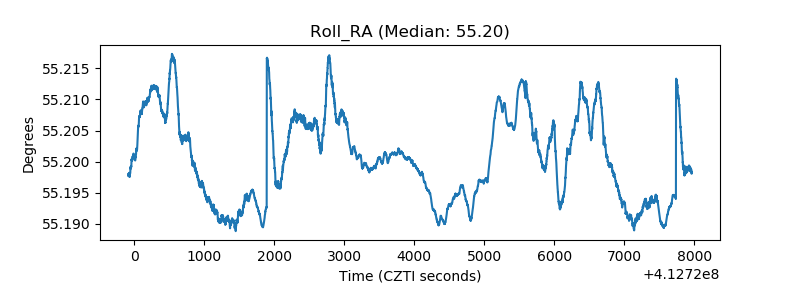 |
| Veto Counter | 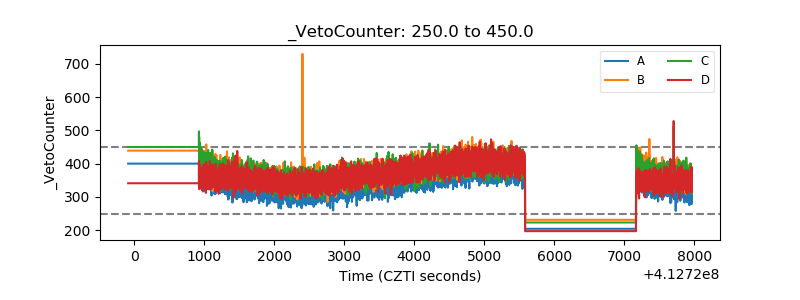 |