| Param | Original file | Final file |
|---|---|---|
| Filename | modeM0/AS1A12_051T01_9000005490_39683cztM0_level2.fits | modeM0/AS1A12_051T01_9000005490_39683cztM0_level2_quad_clean.evt |
| Size (bytes) | 742,898,880 | 80,006,400 |
| Size | 708.5 MB | 76.3 MB |
| Events in quadrant A | 12,372,446 | 293,532 |
| Events in quadrant B | 3,006,985 | 666,425 |
| Events in quadrant C | 8,500,145 | 468,794 |
| Events in quadrant D | 3,159,215 | 577,939 |
| Mode M9 | |||
|---|---|---|---|
| Quadrant | BADHDUFLAG | Total packets | Discarded packets |
| A | 0 | 23 | 0 |
| B | 0 | 23 | 0 |
| C | 0 | 23 | 0 |
| D | 0 | 24 | 0 |
| Mode M0 | |||
|---|---|---|---|
| Quadrant | BADHDUFLAG | Total packets | Discarded packets |
| A | 0 | 40859 | 3 |
| B | 0 | 13066 | 2 |
| C | 0 | 29385 | 2 |
| D | 0 | 13755 | 2 |
| Mode SS | |||
|---|---|---|---|
| Quadrant | BADHDUFLAG | Total packets | Discarded packets |
| A | 0 | 120 | 0 |
| B | 0 | 120 | 0 |
| C | 0 | 120 | 0 |
| D | 0 | 120 | 0 |
| Quadrant | Total seconds | Saturated seconds | Saturation percentage |
|---|---|---|---|
| A | 5946 | 3904 | 65.657585% |
| B | 5946 | 58 | 0.975446% |
| C | 5946 | 1800 | 30.272452% |
| D | 5946 | 125 | 2.102254% |
Noise dominated data is calculated using 1-second bins in cleaned event files. If a bin has >2000 counts, and if more than 50% of those come from <1% of pixels, then it is considered to be noise-dominated and hence unusable.
| Quadrant | # 1 sec bins | Bins with >0 counts | Bins with >2000 counts | High rate bins dominated by noise | Noise dominated (total time) | Noise dominated (detector-on time) | Marked lightcurve |
|---|---|---|---|---|---|---|---|
| A | 7290 | 5947 | 3414 | 3414 | 46.83% | 57.41% | 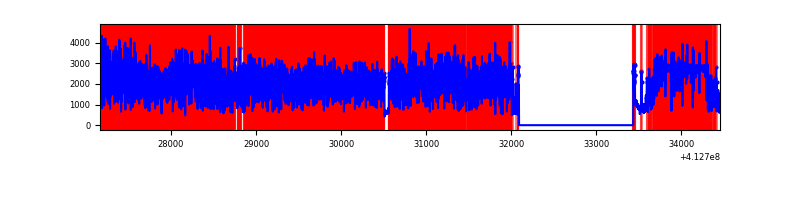 |
| B | 7290 | 5947 | 45 | 45 | 0.62% | 0.76% | 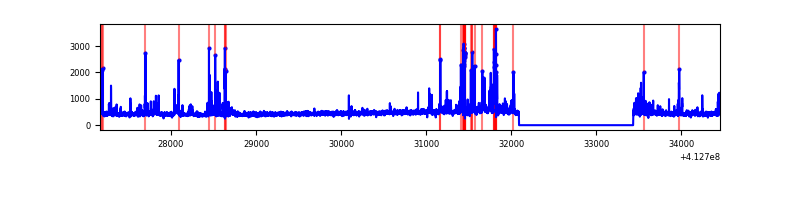 |
| C | 7290 | 5947 | 1581 | 1581 | 21.69% | 26.58% | 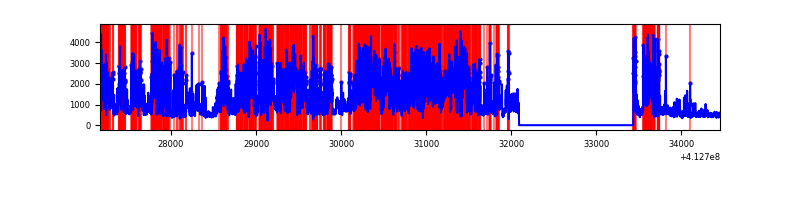 |
| D | 7290 | 5947 | 92 | 92 | 1.26% | 1.55% | 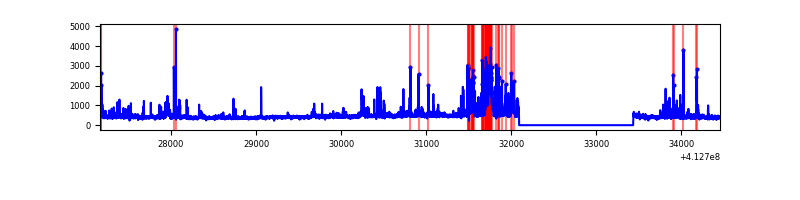 |
Top three noisy pixels from each quadrant. If the there are fewer than three noisy pixels in the level2.evt file, extra rows are filled as -1
| Pixel properties | Quadrant properties | ||||||
|---|---|---|---|---|---|---|---|
| Quadrant | DetID | PixID | Counts | Sigma | Mean | Median | Sigma |
| A | 15 | 222 | 8036571 | 76358.8 | 514 | 503 | 105.2 |
| A | 15 | 174 | 1573403 | 14945.71 | 514 | 503 | 105.2 |
| A | 10 | 83 | 382576 | 3630.46 | 514 | 503 | 105.2 |
| B | 10 | 246 | 196429 | 1550.79 | 649 | 630 | 126.3 |
| B | 5 | 172 | 144605 | 1140.33 | 649 | 630 | 126.3 |
| B | 4 | 170 | 60467 | 473.93 | 649 | 630 | 126.3 |
| C | 15 | 208 | 5131732 | 39111.66 | 562 | 566 | 131.2 |
| C | 9 | 187 | 918940 | 7000.19 | 562 | 566 | 131.2 |
| C | 15 | 214 | 220394 | 1675.61 | 562 | 566 | 131.2 |
| D | 13 | 249 | 323309 | 2101.1 | 627 | 607 | 153.6 |
| D | 2 | 250 | 223788 | 1453.13 | 627 | 607 | 153.6 |
| D | 12 | 227 | 50076 | 322.09 | 627 | 607 | 153.6 |
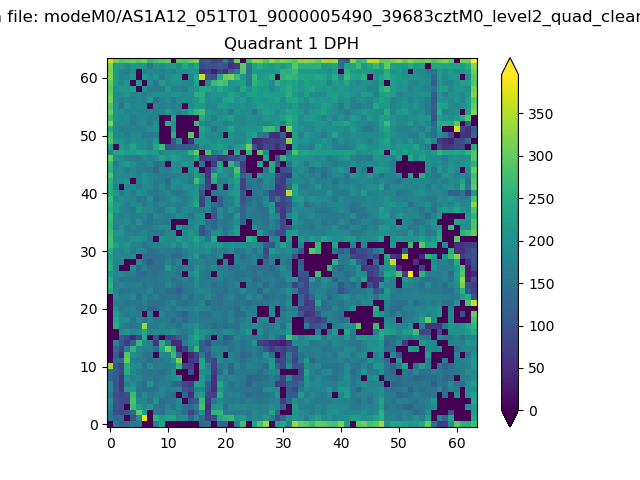
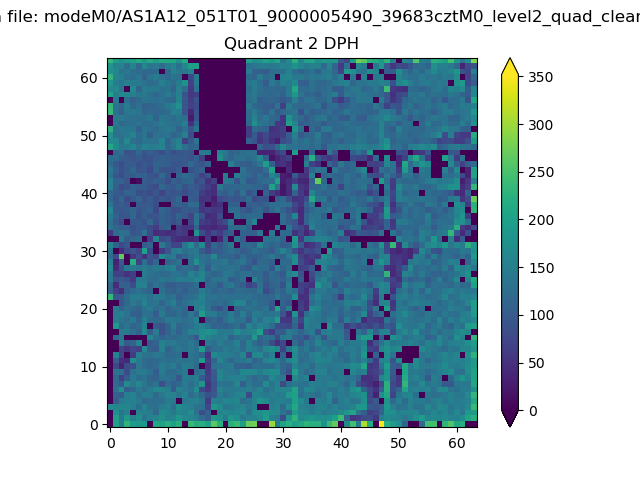
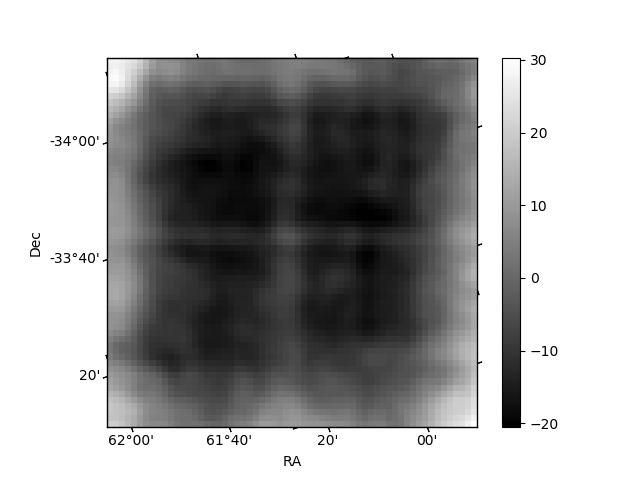
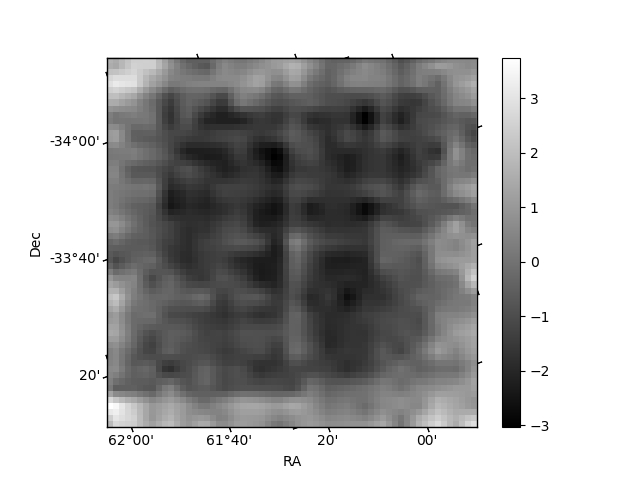
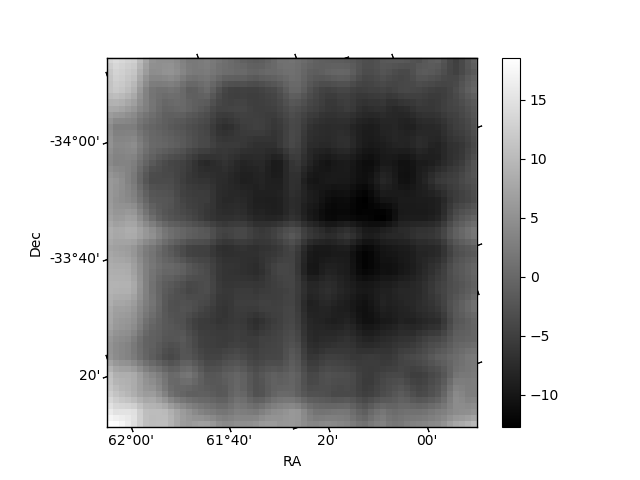
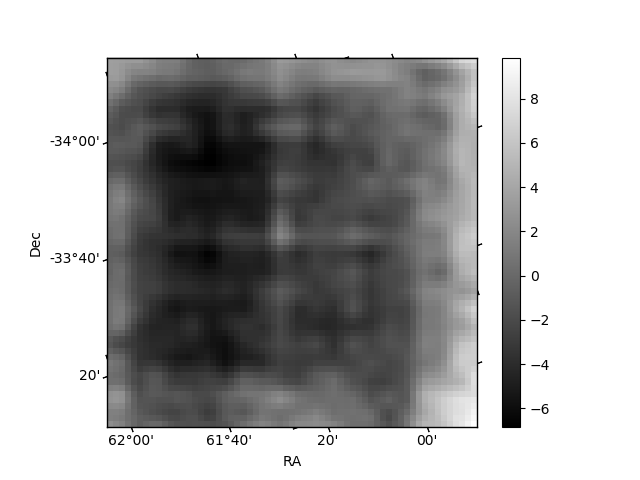
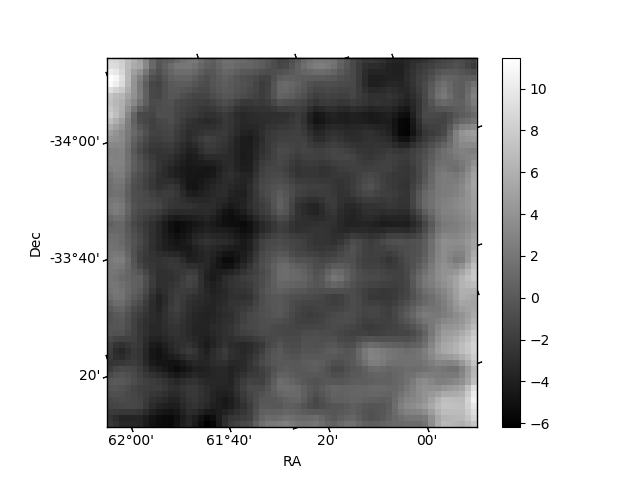
Histogram calculated using DETX and DETY for each event in the final _common_clean file
| Quadrant A | 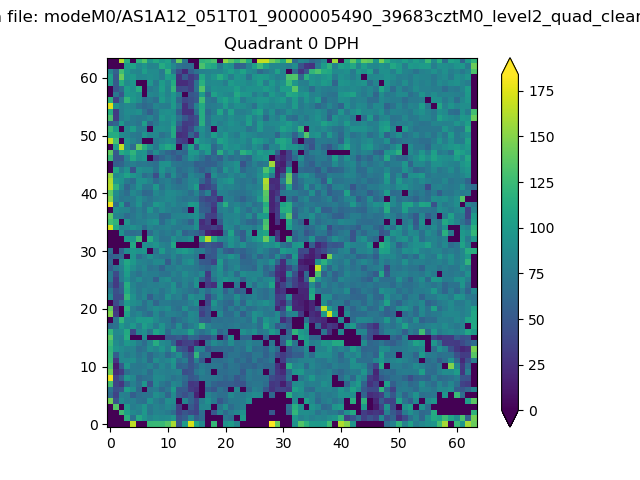 |
 |
Quadrant B |
|---|---|---|---|
| Quadrant D |  |
 |
Quadrant C |
| Plot type | Count rate plots | Images |
|---|---|---|
| Comparison with Poisson distribution Blue bars denote a histogram of data divided into 1 sec bins. Red curve is a Poisson curve with rate = median count rate of data. |
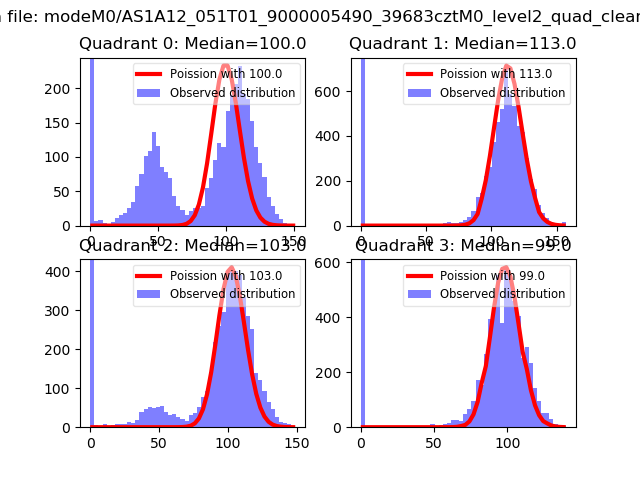 |
 |
| Quadrant-wise count rates Data is divided into 100 sec bins |
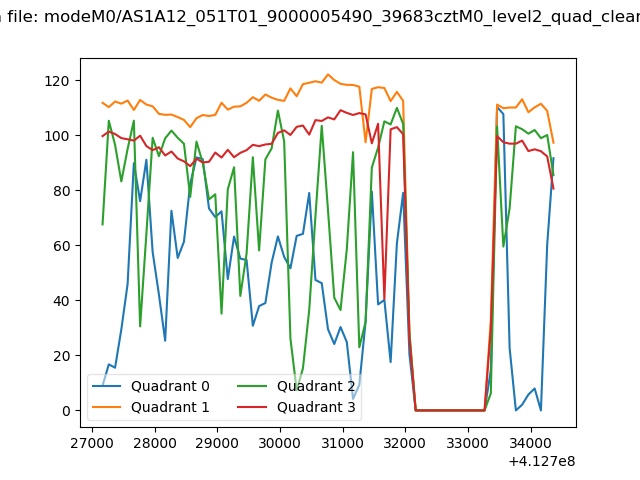 |
|
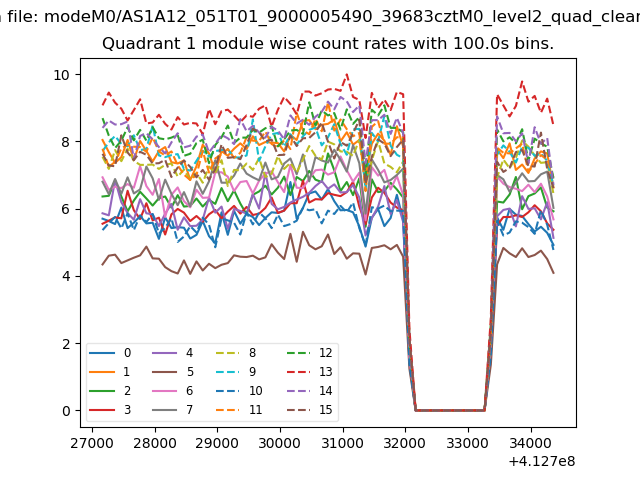
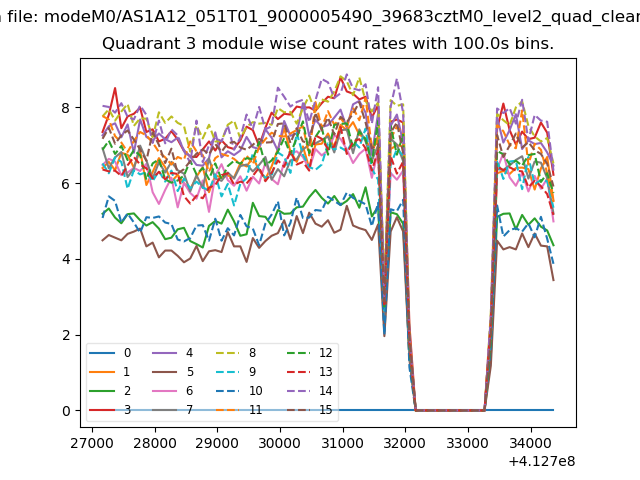
| Module-wise count rates for Quadrant A Data is divided into 100 sec bins |
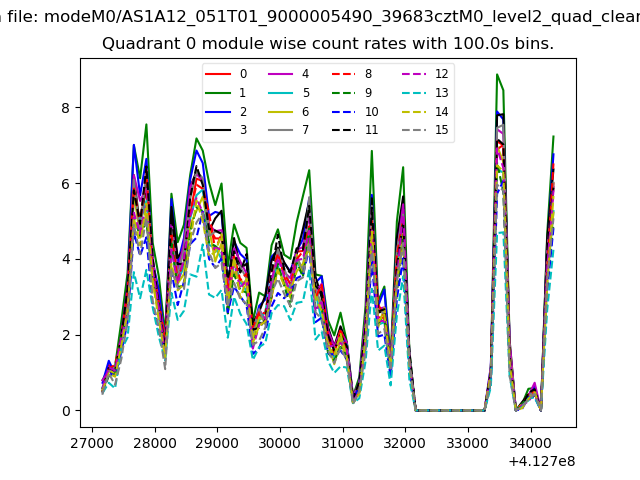 |
 |
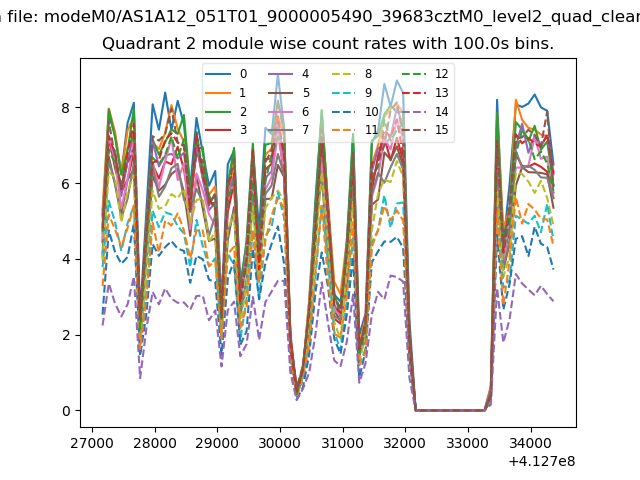
| Module-wise count rates for Quadrant B Data is divided into 100 sec bins |
 |
 |
| Module-wise count rates for Quadrant C Data is divided into 100 sec bins |
 |
 |
| Module-wise count rates for Quadrant D Data is divided into 100 sec bins |
 |
 |
| Parameter | Plot |
|---|---|
| CZT HV Monitor | 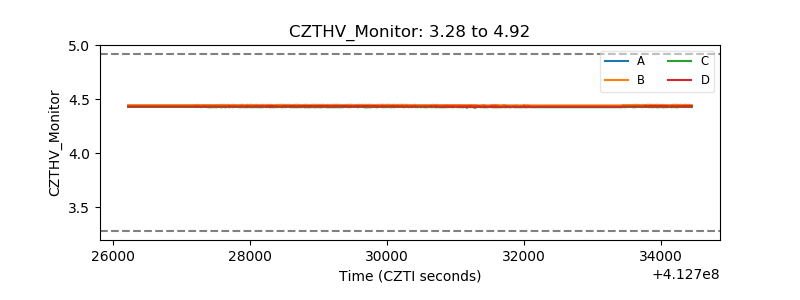 |
| D_VDD | 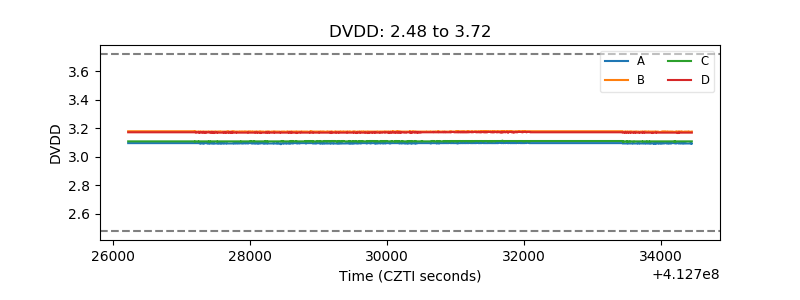 |
| Temperature 1 | 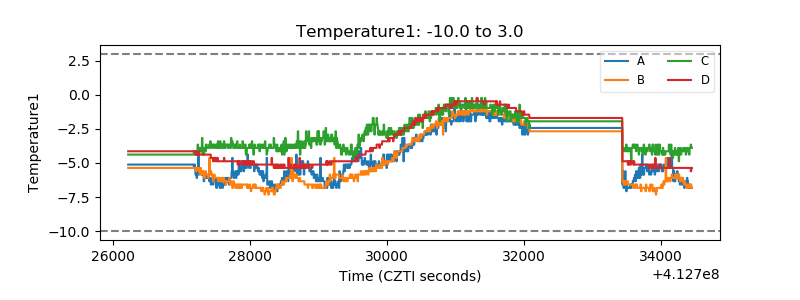 |
| Veto HV Monitor | 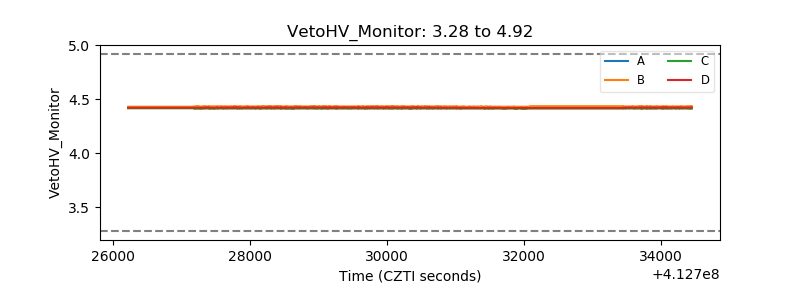 |
| Veto LLD | 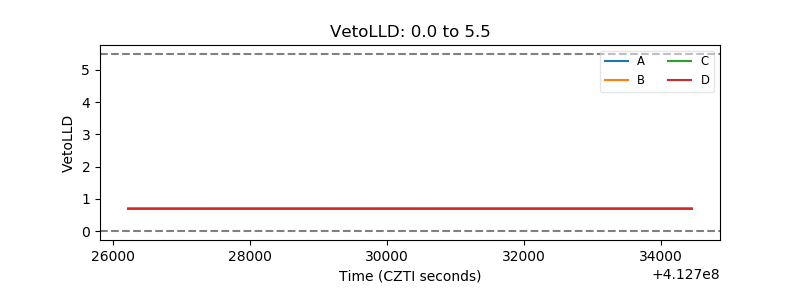 |
| Alpha Counter | 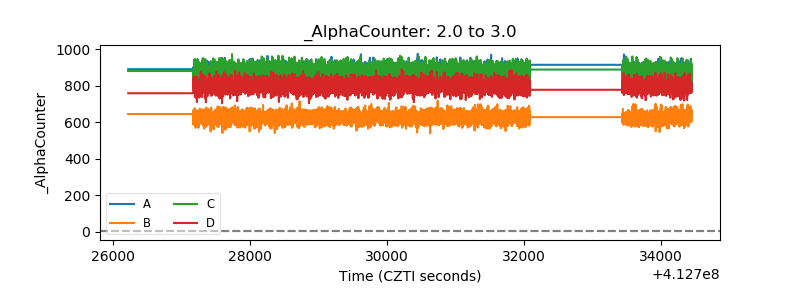 |
| _CPM_Rate | 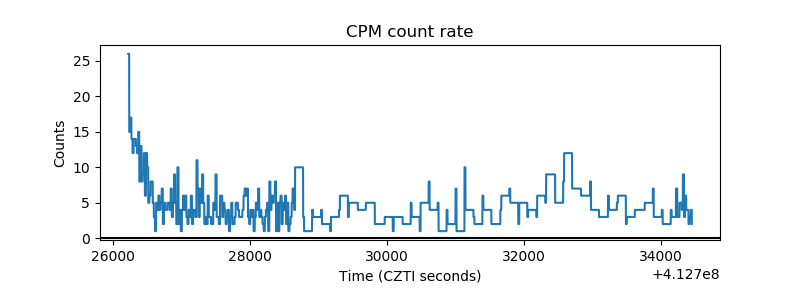 |
| CZT Counter | 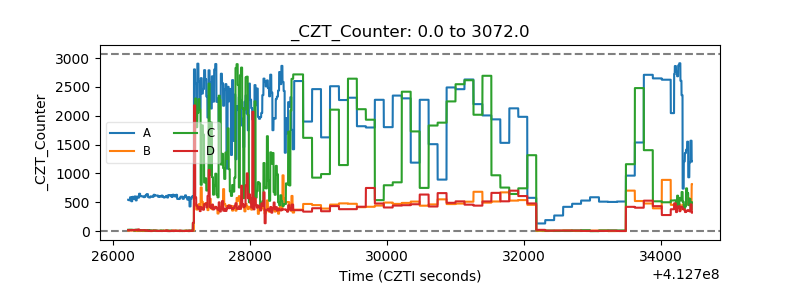 |
| +2.5 Volts monitor | 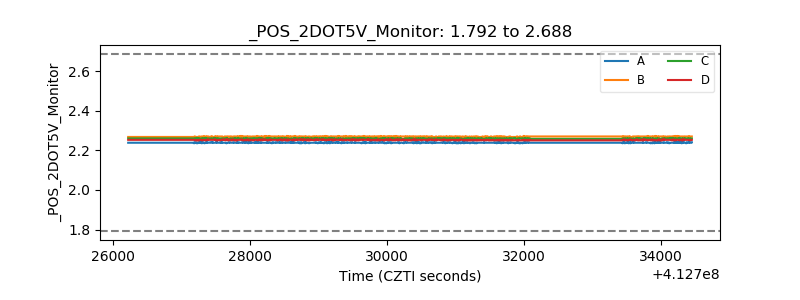 |
| +5 Volts monitor | 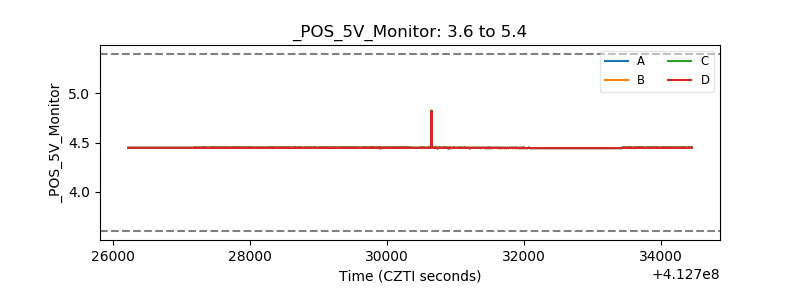 |
| _ROLL_ROT | 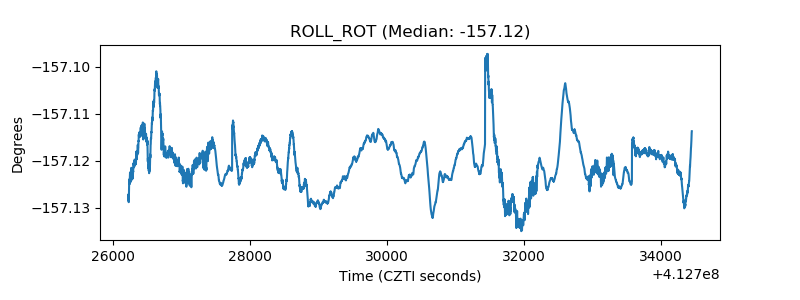 |
| _Roll_DEC | 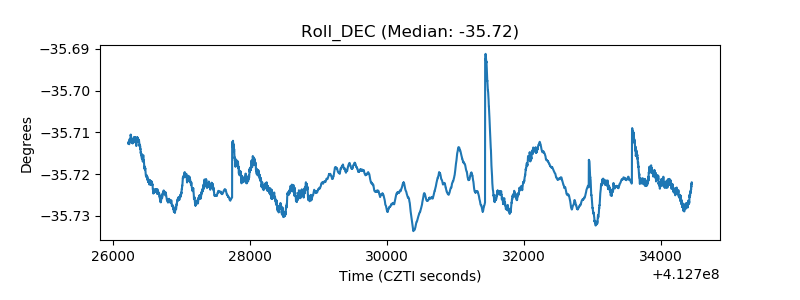 |
| _Roll_RA | 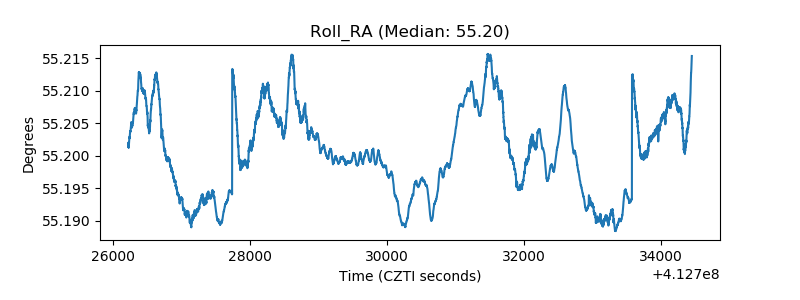 |
| Veto Counter | 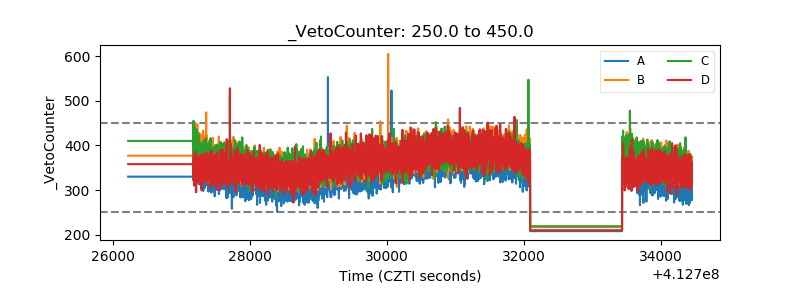 |