| Param | Original file | Final file |
|---|---|---|
| Filename | modeM0/AS1A12_051T01_9000005490_39684cztM0_level2.fits | modeM0/AS1A12_051T01_9000005490_39684cztM0_level2_quad_clean.evt |
| Size (bytes) | 687,816,000 | 84,862,080 |
| Size | 656.0 MB | 80.9 MB |
| Events in quadrant A | 11,319,983 | 373,023 |
| Events in quadrant B | 3,025,257 | 682,342 |
| Events in quadrant C | 7,441,481 | 497,474 |
| Events in quadrant D | 3,201,055 | 590,307 |
| Mode M9 | |||
|---|---|---|---|
| Quadrant | BADHDUFLAG | Total packets | Discarded packets |
| A | 0 | 26 | 0 |
| B | 0 | 26 | 0 |
| C | 0 | 26 | 0 |
| D | 0 | 26 | 0 |
| Mode M0 | |||
|---|---|---|---|
| Quadrant | BADHDUFLAG | Total packets | Discarded packets |
| A | 0 | 37758 | 3 |
| B | 0 | 13136 | 2 |
| C | 0 | 26232 | 2 |
| D | 0 | 13914 | 2 |
| Mode SS | |||
|---|---|---|---|
| Quadrant | BADHDUFLAG | Total packets | Discarded packets |
| A | 0 | 126 | 0 |
| B | 0 | 126 | 0 |
| C | 0 | 126 | 0 |
| D | 0 | 126 | 0 |
| Quadrant | Total seconds | Saturated seconds | Saturation percentage |
|---|---|---|---|
| A | 6099 | 3204 | 52.533202% |
| B | 6099 | 24 | 0.393507% |
| C | 6099 | 1598 | 26.201017% |
| D | 6099 | 104 | 1.705198% |
Noise dominated data is calculated using 1-second bins in cleaned event files. If a bin has >2000 counts, and if more than 50% of those come from <1% of pixels, then it is considered to be noise-dominated and hence unusable.
| Quadrant | # 1 sec bins | Bins with >0 counts | Bins with >2000 counts | High rate bins dominated by noise | Noise dominated (total time) | Noise dominated (detector-on time) | Marked lightcurve |
|---|---|---|---|---|---|---|---|
| A | 8724 | 6101 | 2739 | 2739 | 31.40% | 44.89% | 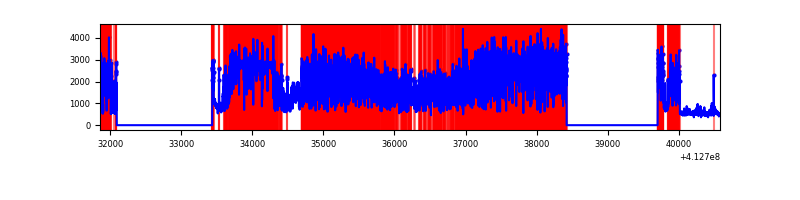 |
| B | 8724 | 6101 | 11 | 11 | 0.13% | 0.18% | 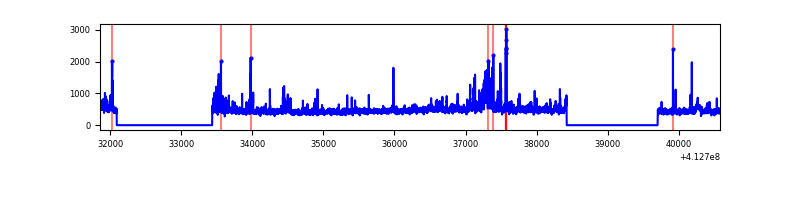 |
| C | 8724 | 6101 | 1186 | 1186 | 13.59% | 19.44% | 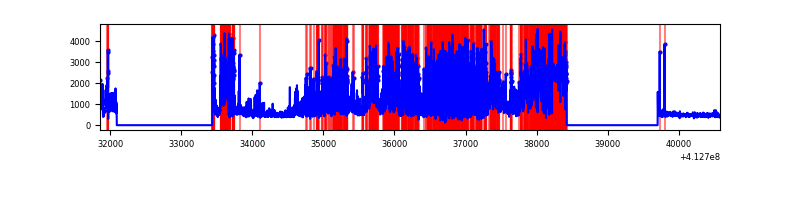 |
| D | 8724 | 6101 | 93 | 93 | 1.07% | 1.52% | 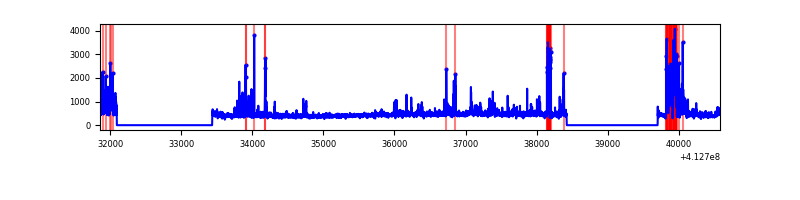 |
Top three noisy pixels from each quadrant. If the there are fewer than three noisy pixels in the level2.evt file, extra rows are filled as -1
| Pixel properties | Quadrant properties | ||||||
|---|---|---|---|---|---|---|---|
| Quadrant | DetID | PixID | Counts | Sigma | Mean | Median | Sigma |
| A | 15 | 222 | 7068443 | 63923.08 | 539 | 527 | 110.6 |
| A | 15 | 174 | 1593464 | 14406.71 | 539 | 527 | 110.6 |
| A | 10 | 83 | 410293 | 3705.97 | 539 | 527 | 110.6 |
| B | 5 | 172 | 217399 | 1660.86 | 668 | 649 | 130.5 |
| B | 10 | 246 | 103293 | 786.52 | 668 | 649 | 130.5 |
| B | 15 | 85 | 30043 | 225.23 | 668 | 649 | 130.5 |
| C | 15 | 208 | 3155003 | 23476.21 | 573 | 576 | 134.4 |
| C | 9 | 187 | 1747963 | 13004.59 | 573 | 576 | 134.4 |
| C | 15 | 214 | 226259 | 1679.6 | 573 | 576 | 134.4 |
| D | 13 | 171 | 183276 | 1145.3 | 647 | 628 | 159.5 |
| D | 2 | 250 | 161301 | 1007.5 | 647 | 628 | 159.5 |
| D | 5 | 32 | 117379 | 732.09 | 647 | 628 | 159.5 |
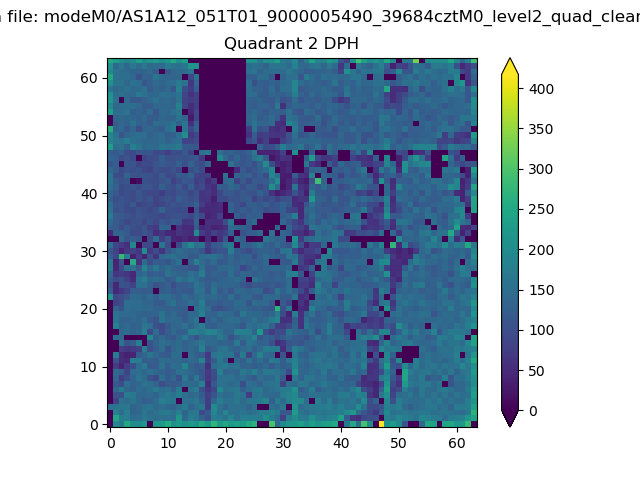
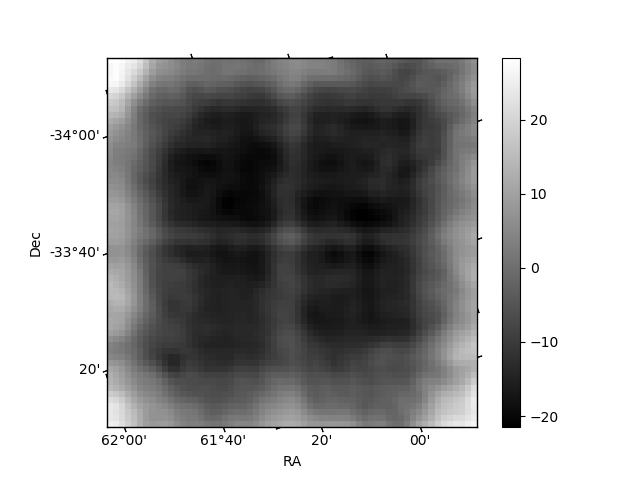
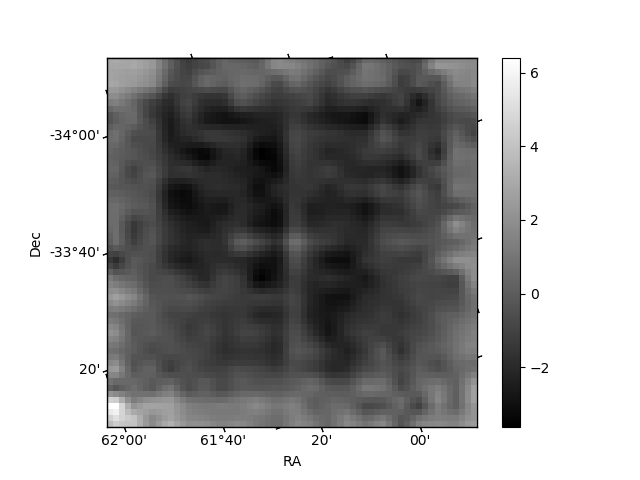
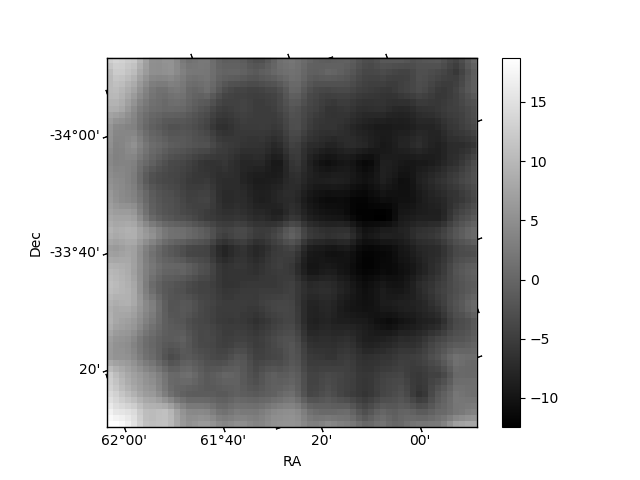
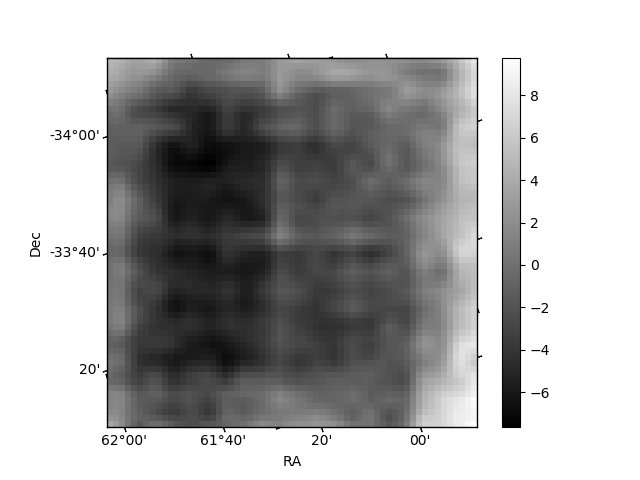
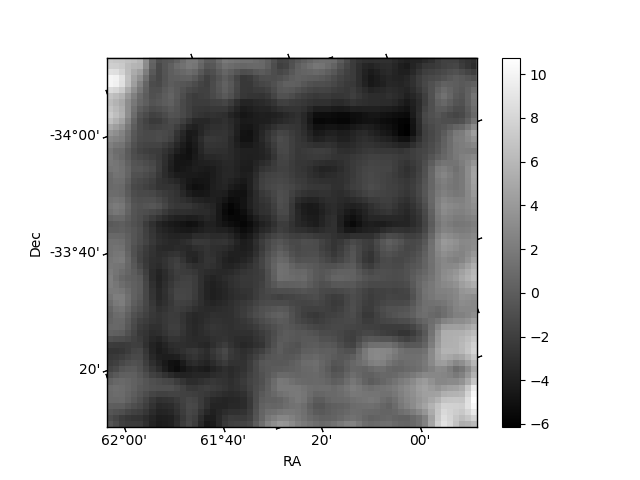
Histogram calculated using DETX and DETY for each event in the final _common_clean file
| Quadrant A | 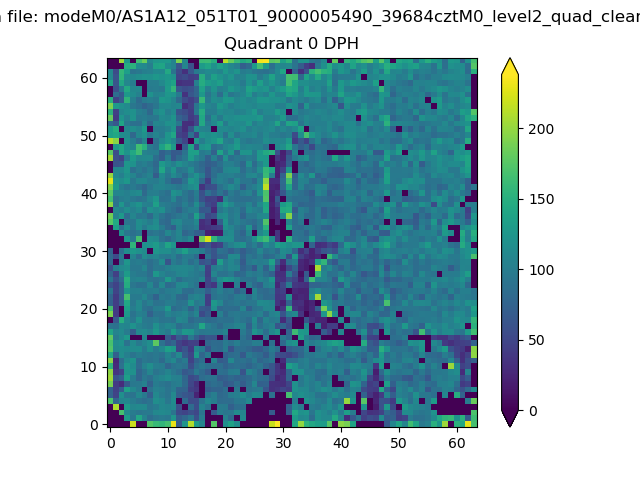 |
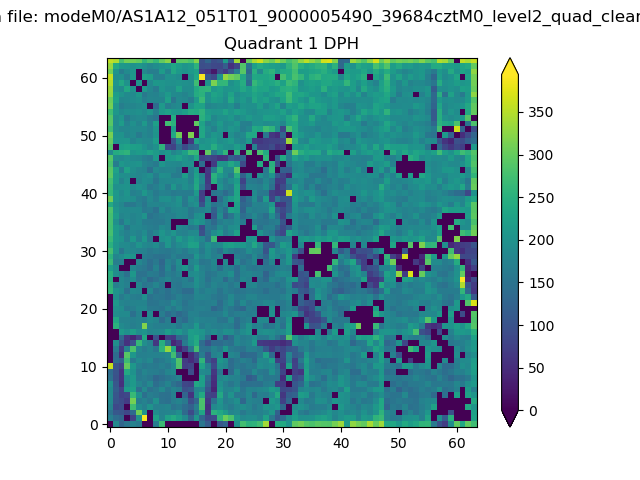 |
Quadrant B |
|---|---|---|---|
| Quadrant D | 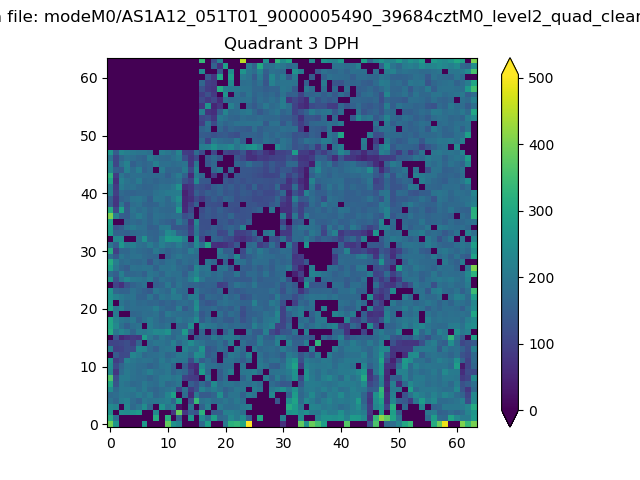 |
 |
Quadrant C |
| Plot type | Count rate plots | Images |
|---|---|---|
| Comparison with Poisson distribution Blue bars denote a histogram of data divided into 1 sec bins. Red curve is a Poisson curve with rate = median count rate of data. |
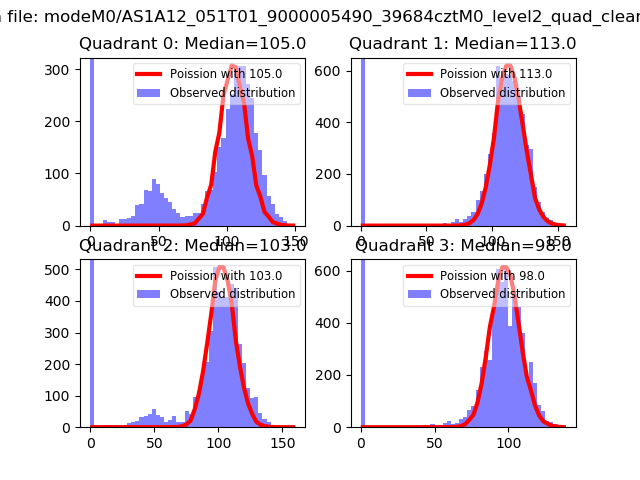 |
 |
| Quadrant-wise count rates Data is divided into 100 sec bins |
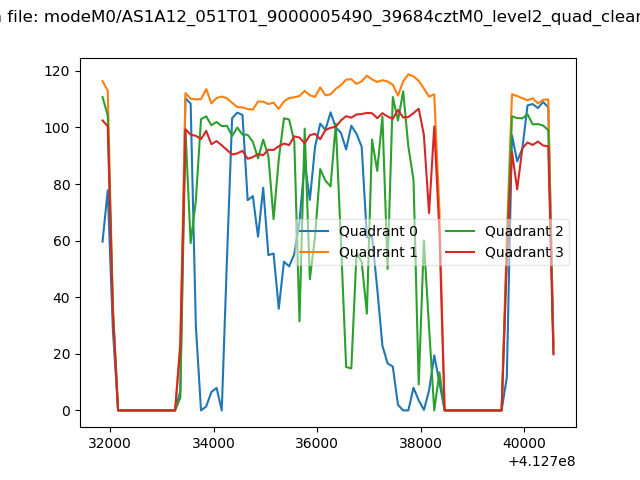 |
|
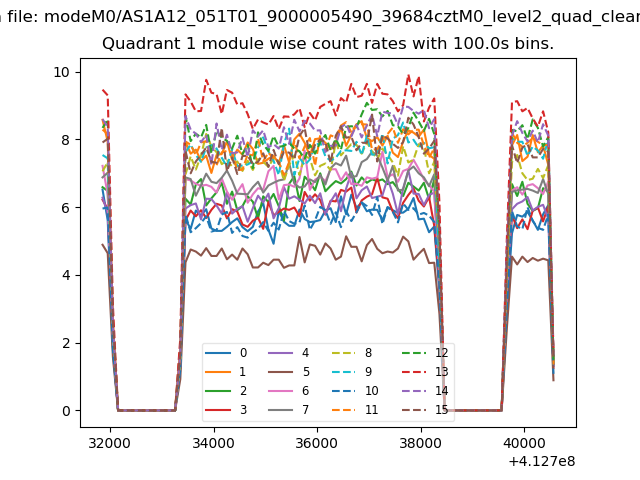
| Module-wise count rates for Quadrant A Data is divided into 100 sec bins |
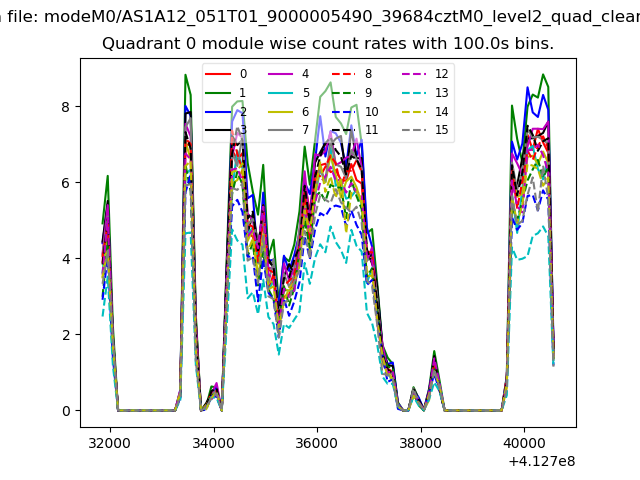 |
 |
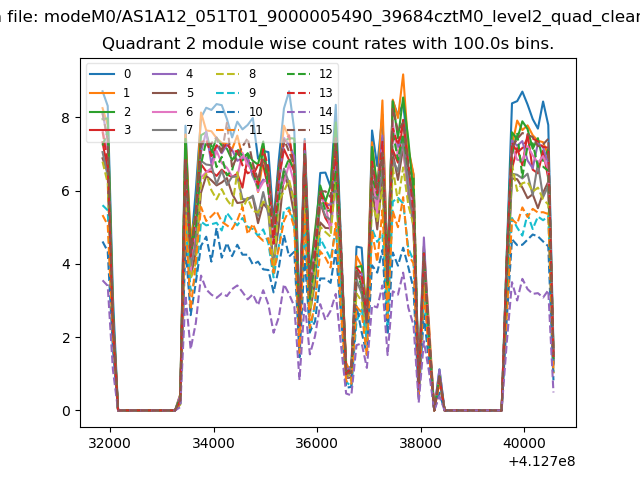
| Module-wise count rates for Quadrant B Data is divided into 100 sec bins |
 |
 |
| Module-wise count rates for Quadrant C Data is divided into 100 sec bins |
 |
 |
| Module-wise count rates for Quadrant D Data is divided into 100 sec bins |
 |
 |
| Parameter | Plot |
|---|---|
| CZT HV Monitor |  |
| D_VDD | 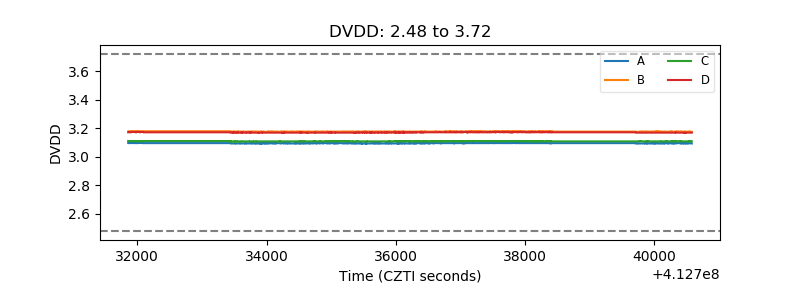 |
| Temperature 1 | 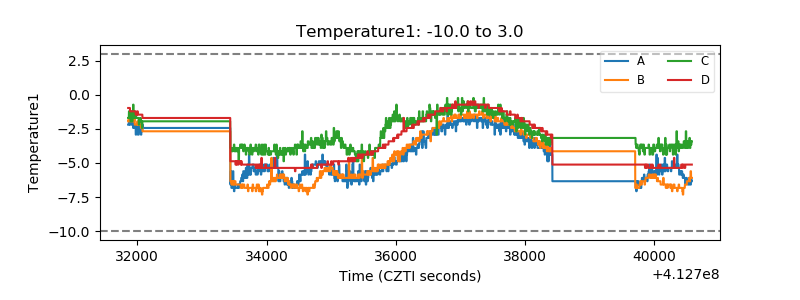 |
| Veto HV Monitor | 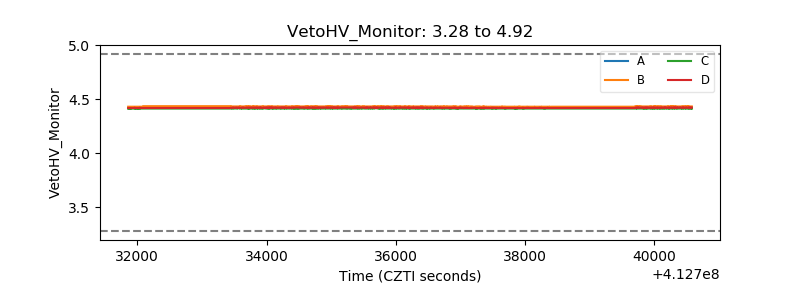 |
| Veto LLD | 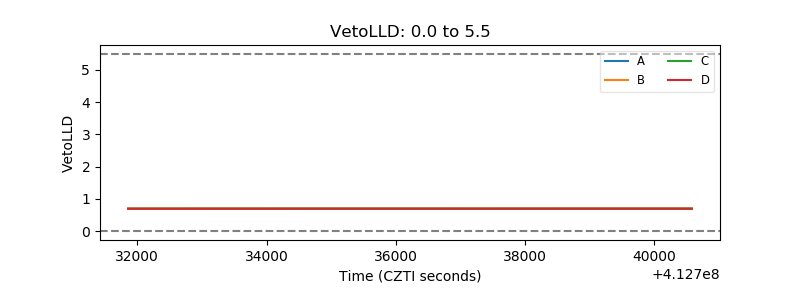 |
| Alpha Counter | 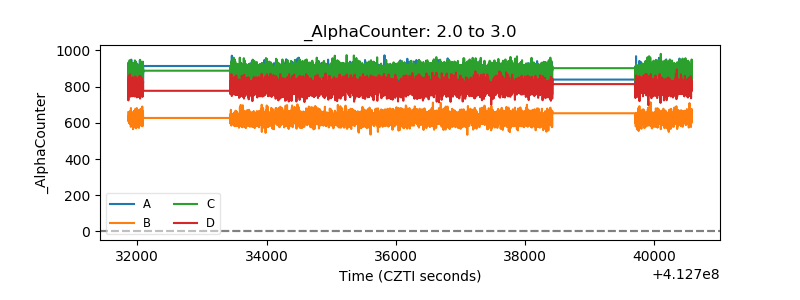 |
| _CPM_Rate | 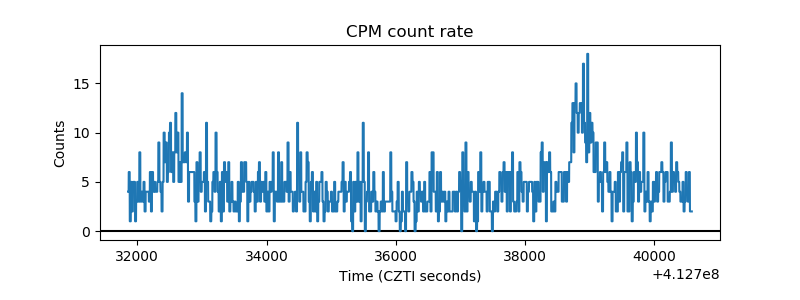 |
| CZT Counter | 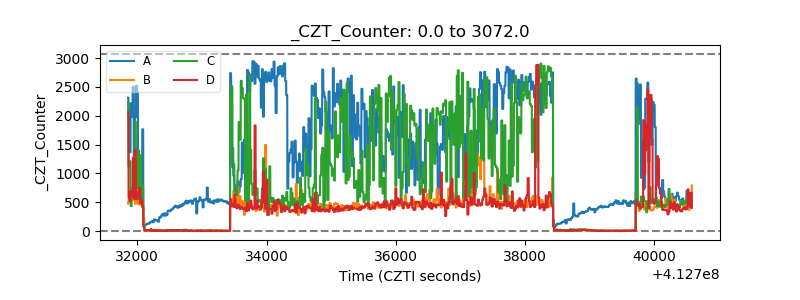 |
| +2.5 Volts monitor | 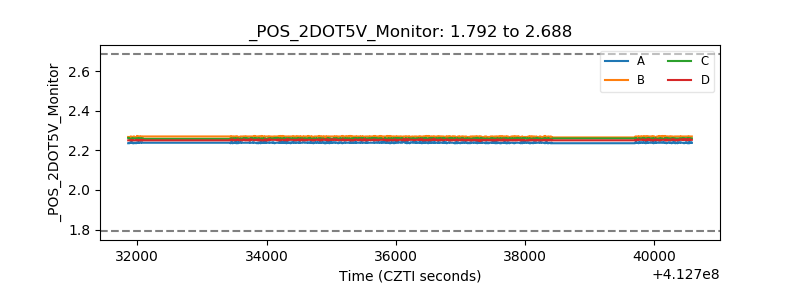 |
| +5 Volts monitor | 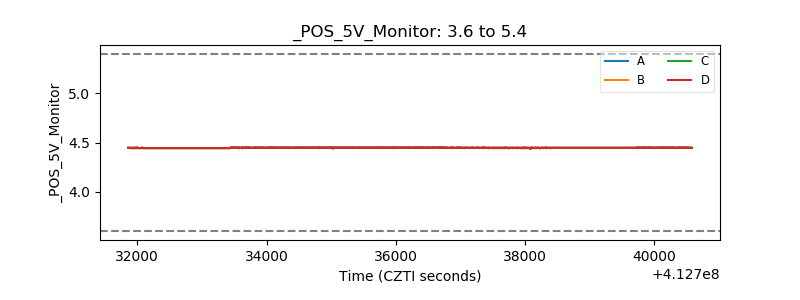 |
| _ROLL_ROT | 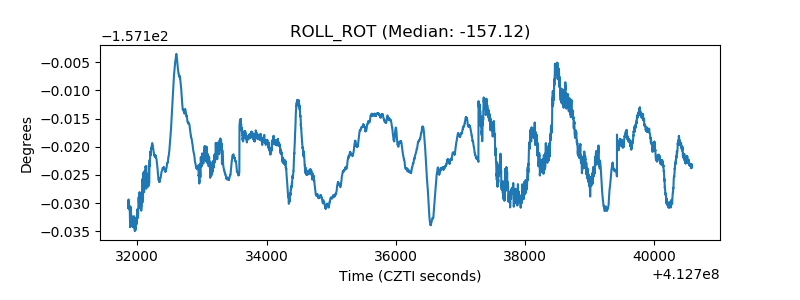 |
| _Roll_DEC | 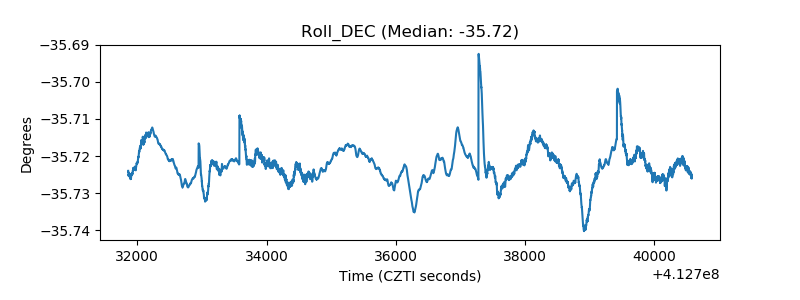 |
| _Roll_RA | 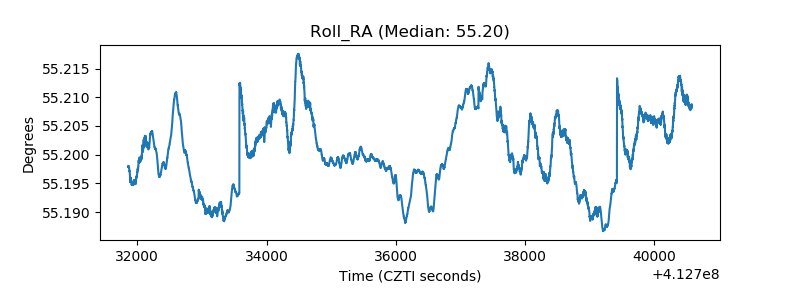 |
| Veto Counter | 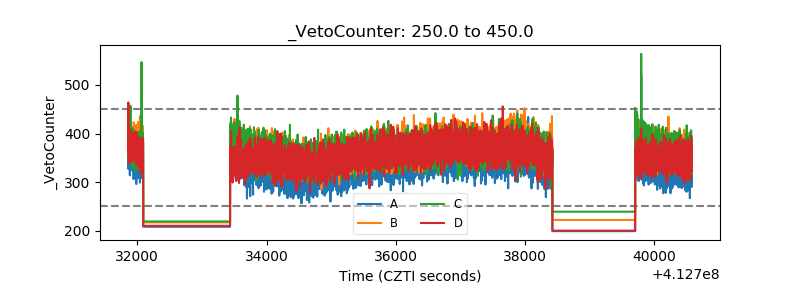 |