| Param | Original file | Final file |
|---|---|---|
| Filename | modeM0/AS1A12_051T01_9000005490_39687cztM0_level2.fits | modeM0/AS1A12_051T01_9000005490_39687cztM0_level2_quad_clean.evt |
| Size (bytes) | 619,009,920 | 88,456,320 |
| Size | 590.3 MB | 84.4 MB |
| Events in quadrant A | 10,245,497 | 413,931 |
| Events in quadrant B | 2,862,181 | 674,106 |
| Events in quadrant C | 6,468,717 | 577,488 |
| Events in quadrant D | 2,873,533 | 594,736 |
| Mode M9 | |||
|---|---|---|---|
| Quadrant | BADHDUFLAG | Total packets | Discarded packets |
| A | 0 | 30 | 0 |
| B | 0 | 30 | 0 |
| C | 0 | 30 | 0 |
| D | 0 | 30 | 0 |
| Mode M0 | |||
|---|---|---|---|
| Quadrant | BADHDUFLAG | Total packets | Discarded packets |
| A | 0 | 34611 | 3 |
| B | 0 | 12495 | 2 |
| C | 0 | 23315 | 2 |
| D | 0 | 12757 | 2 |
| Mode SS | |||
|---|---|---|---|
| Quadrant | BADHDUFLAG | Total packets | Discarded packets |
| A | 0 | 124 | 0 |
| B | 0 | 124 | 0 |
| C | 0 | 124 | 0 |
| D | 0 | 124 | 0 |
| Quadrant | Total seconds | Saturated seconds | Saturation percentage |
|---|---|---|---|
| A | 5977 | 2728 | 45.641626% |
| B | 5977 | 30 | 0.501924% |
| C | 5977 | 857 | 14.338297% |
| D | 5977 | 24 | 0.401539% |
Noise dominated data is calculated using 1-second bins in cleaned event files. If a bin has >2000 counts, and if more than 50% of those come from <1% of pixels, then it is considered to be noise-dominated and hence unusable.
| Quadrant | # 1 sec bins | Bins with >0 counts | Bins with >2000 counts | High rate bins dominated by noise | Noise dominated (total time) | Noise dominated (detector-on time) | Marked lightcurve |
|---|---|---|---|---|---|---|---|
| A | 8960 | 5979 | 2262 | 2262 | 25.25% | 37.83% | 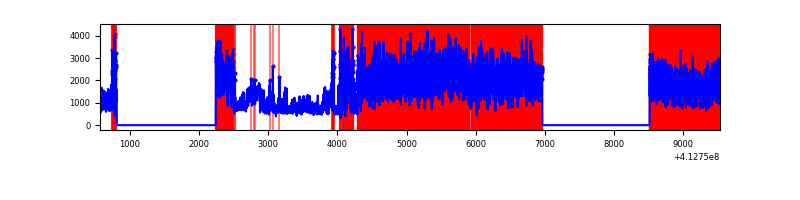 |
| B | 8960 | 5979 | 17 | 17 | 0.19% | 0.28% | 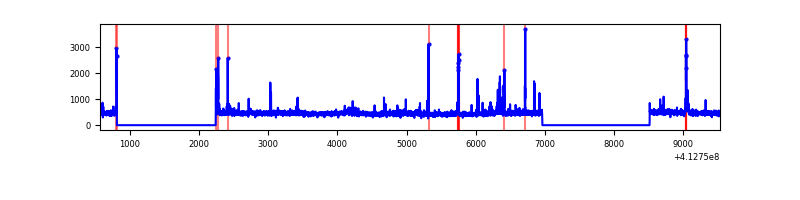 |
| C | 8960 | 5979 | 732 | 732 | 8.17% | 12.24% | 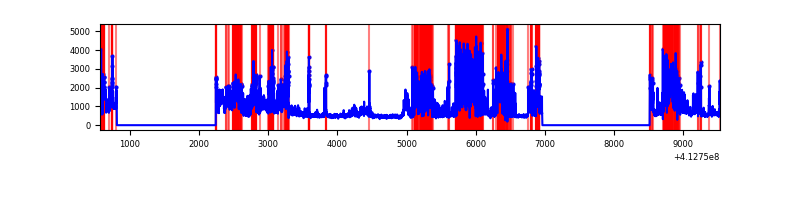 |
| D | 8960 | 5979 | 18 | 18 | 0.20% | 0.30% | 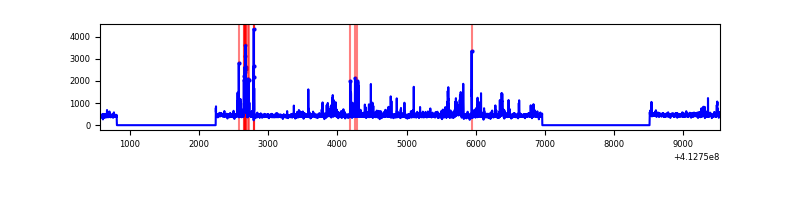 |
Top three noisy pixels from each quadrant. If the there are fewer than three noisy pixels in the level2.evt file, extra rows are filled as -1
| Pixel properties | Quadrant properties | ||||||
|---|---|---|---|---|---|---|---|
| Quadrant | DetID | PixID | Counts | Sigma | Mean | Median | Sigma |
| A | 15 | 222 | 6321680 | 52485.65 | 587 | 575 | 120.4 |
| A | 15 | 174 | 1131149 | 9387.43 | 587 | 575 | 120.4 |
| A | 10 | 83 | 420737 | 3488.71 | 587 | 575 | 120.4 |
| B | 5 | 172 | 85214 | 652.9 | 661 | 641 | 129.5 |
| B | 5 | 255 | 63112 | 482.27 | 661 | 641 | 129.5 |
| B | 4 | 200 | 39617 | 300.89 | 661 | 641 | 129.5 |
| C | 15 | 208 | 2408948 | 16547.04 | 618 | 621 | 145.5 |
| C | 9 | 187 | 1377022 | 9456.92 | 618 | 621 | 145.5 |
| C | 15 | 214 | 237964 | 1630.73 | 618 | 621 | 145.5 |
| D | 12 | 233 | 154485 | 971.71 | 648 | 630 | 158.3 |
| D | 13 | 249 | 88862 | 557.25 | 648 | 630 | 158.3 |
| D | 2 | 250 | 57764 | 360.84 | 648 | 630 | 158.3 |
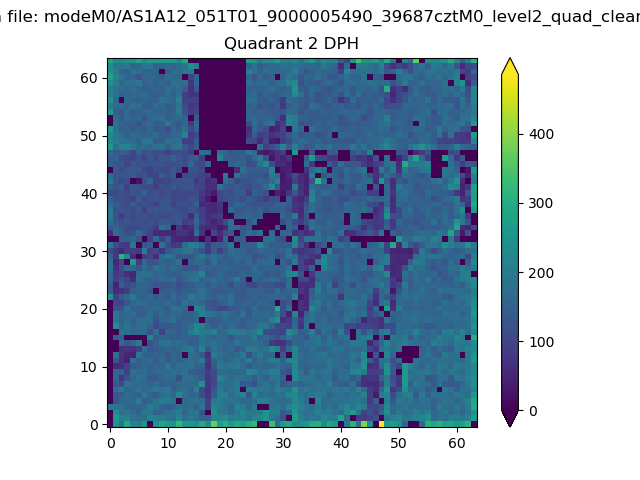
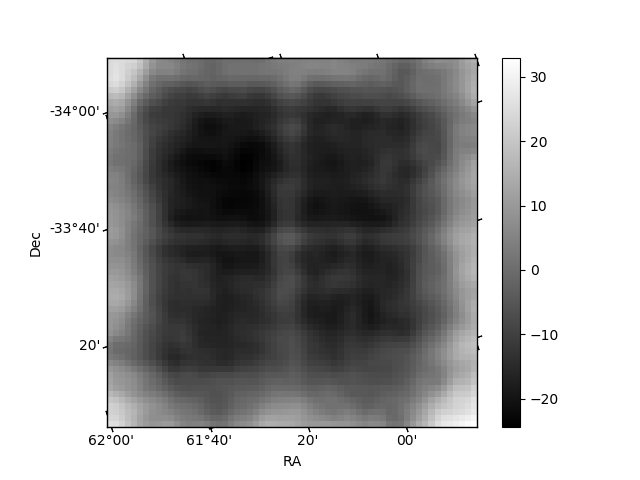
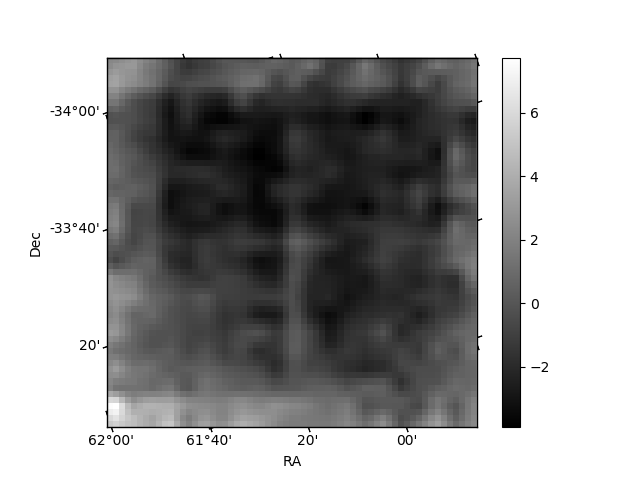
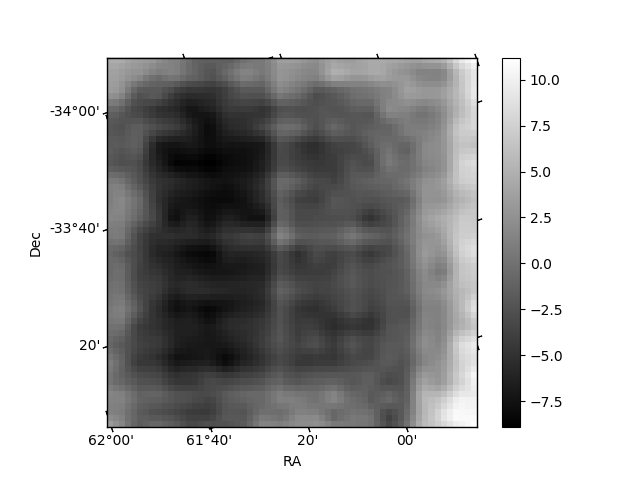
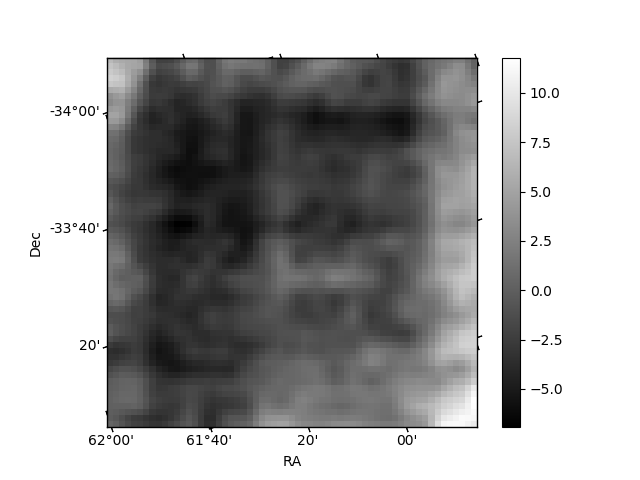
Histogram calculated using DETX and DETY for each event in the final _common_clean file
| Quadrant A | 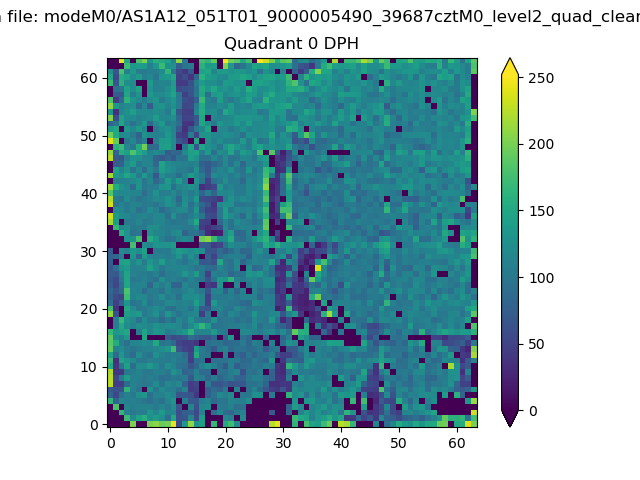 |
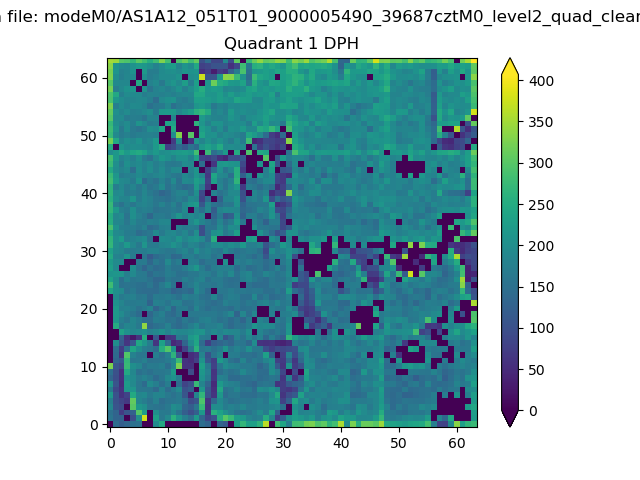 |
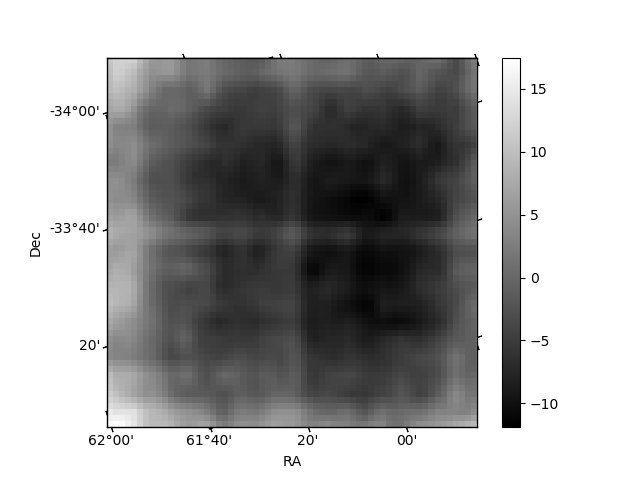
Quadrant B |
|---|---|---|---|
| Quadrant D | 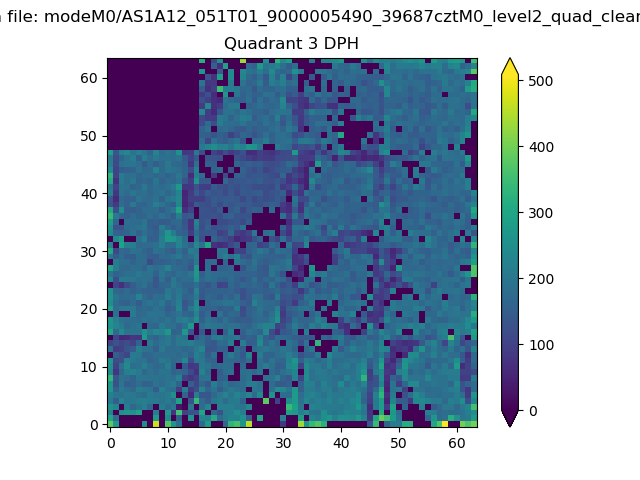 |
 |
Quadrant C |
| Plot type | Count rate plots | Images |
|---|---|---|
| Comparison with Poisson distribution Blue bars denote a histogram of data divided into 1 sec bins. Red curve is a Poisson curve with rate = median count rate of data. |
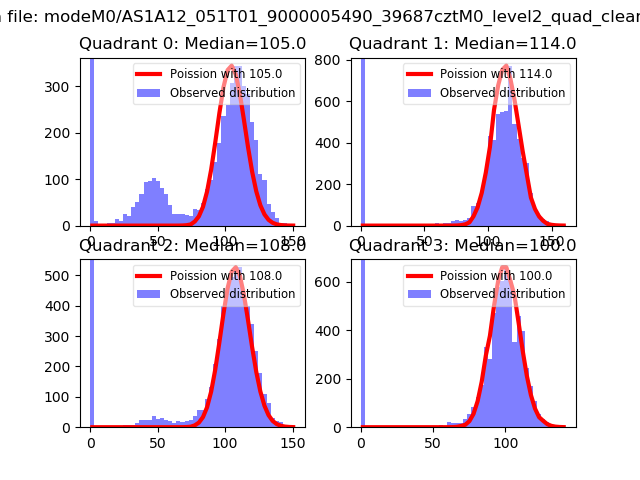 |
 |
| Quadrant-wise count rates Data is divided into 100 sec bins |
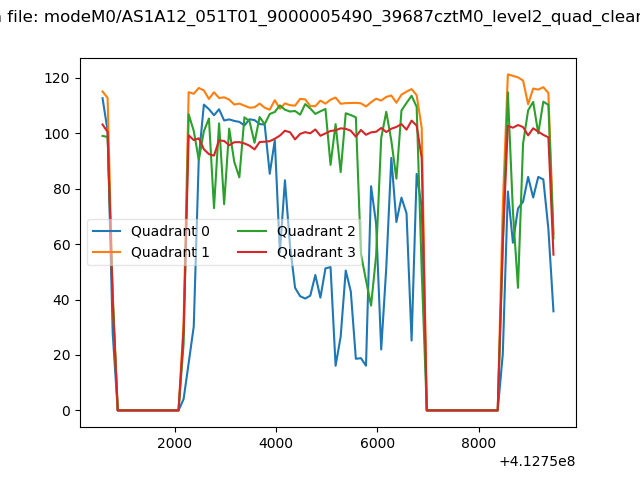 |
|
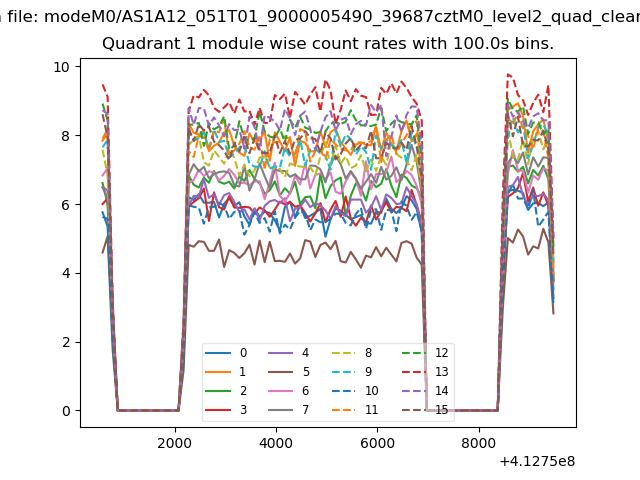
| Module-wise count rates for Quadrant A Data is divided into 100 sec bins |
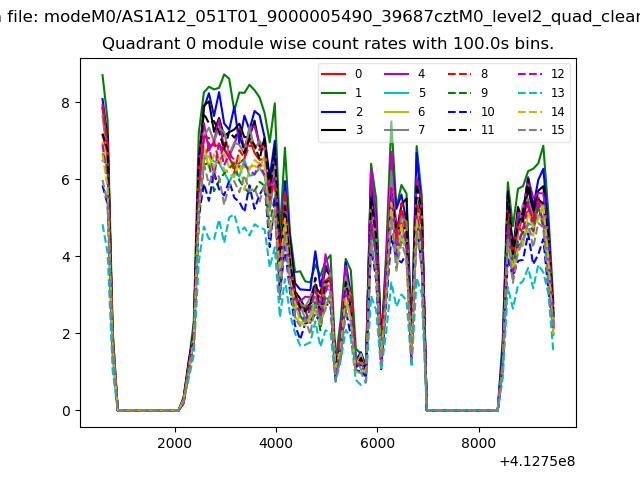 |
 |
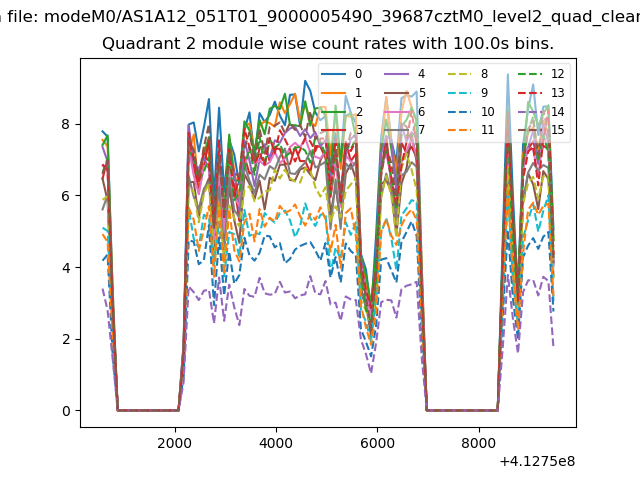
| Module-wise count rates for Quadrant B Data is divided into 100 sec bins |
 |
 |
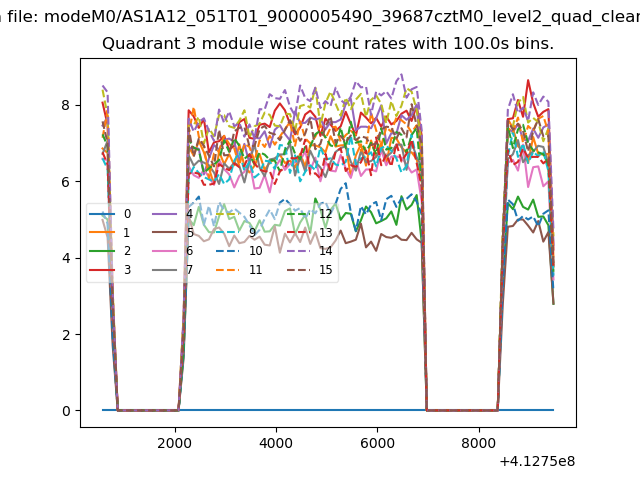
| Module-wise count rates for Quadrant C Data is divided into 100 sec bins |
 |
 |
| Module-wise count rates for Quadrant D Data is divided into 100 sec bins |
 |
 |
| Parameter | Plot |
|---|---|
| CZT HV Monitor | 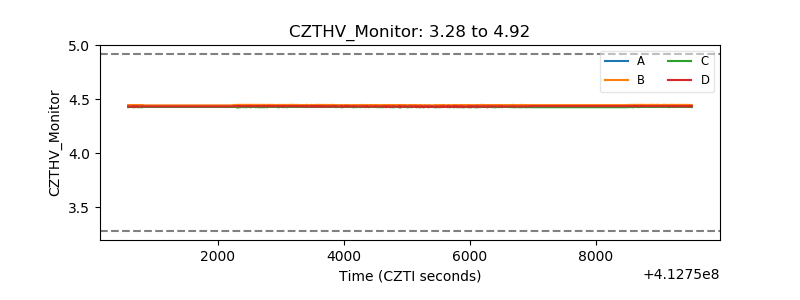 |
| D_VDD | 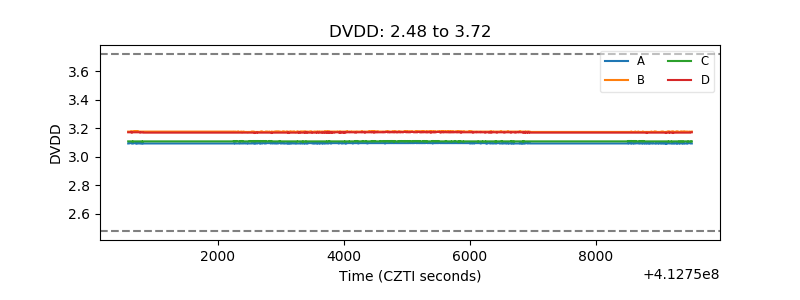 |
| Temperature 1 | 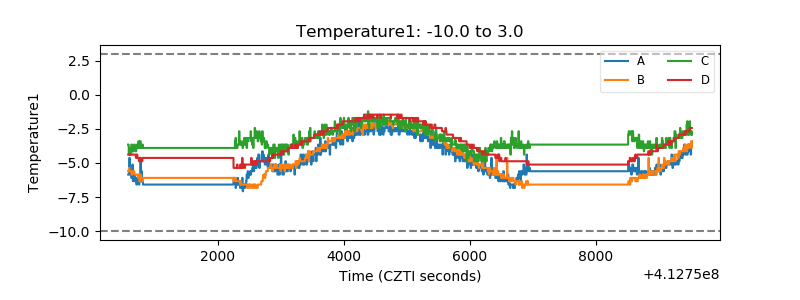 |
| Veto HV Monitor | 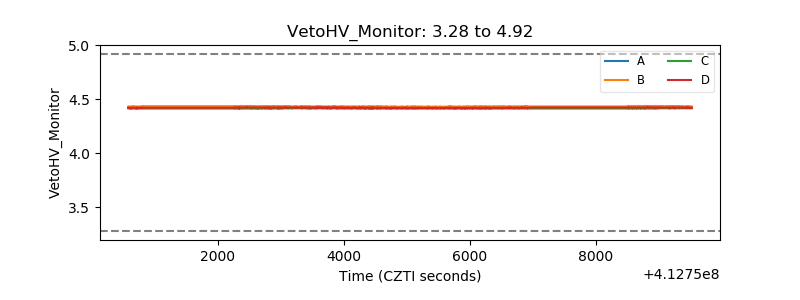 |
| Veto LLD | 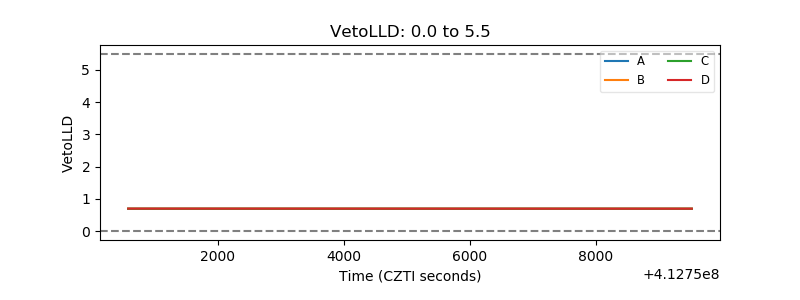 |
| Alpha Counter | 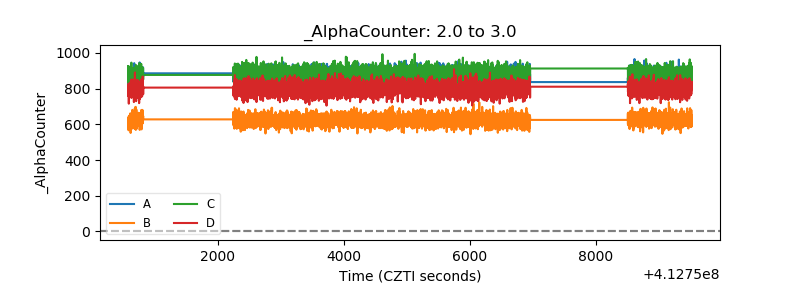 |
| _CPM_Rate | 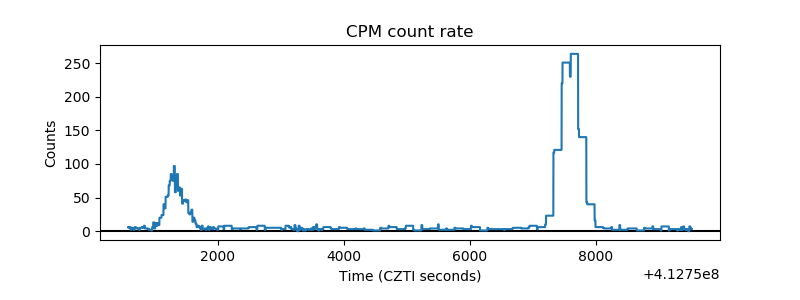 |
| CZT Counter | 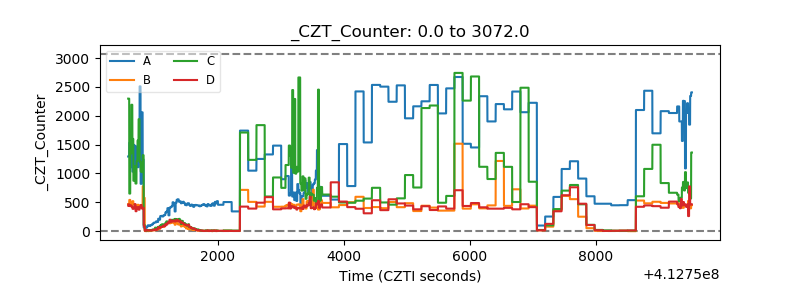 |
| +2.5 Volts monitor | 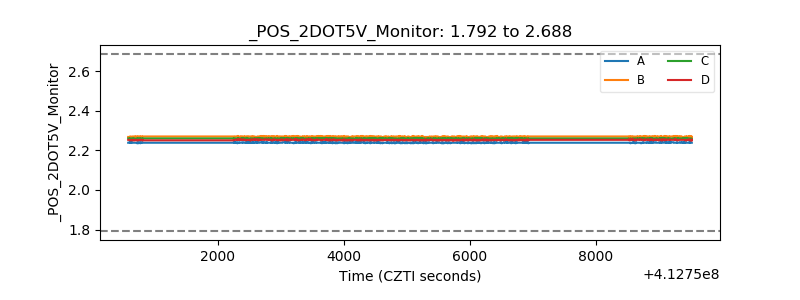 |
| +5 Volts monitor | 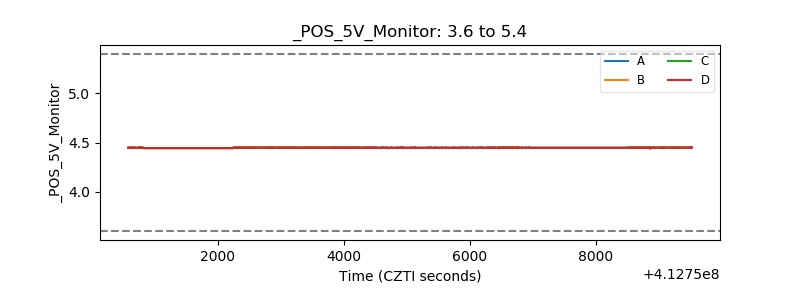 |
| _ROLL_ROT | 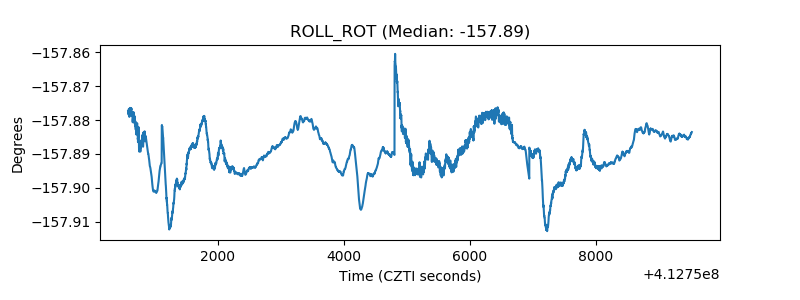 |
| _Roll_DEC |  |
| _Roll_RA | 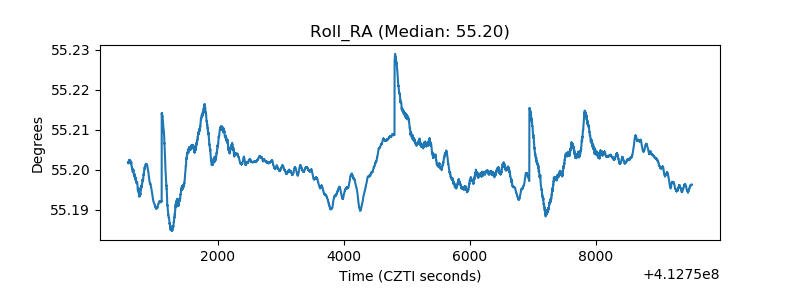 |
| Veto Counter | 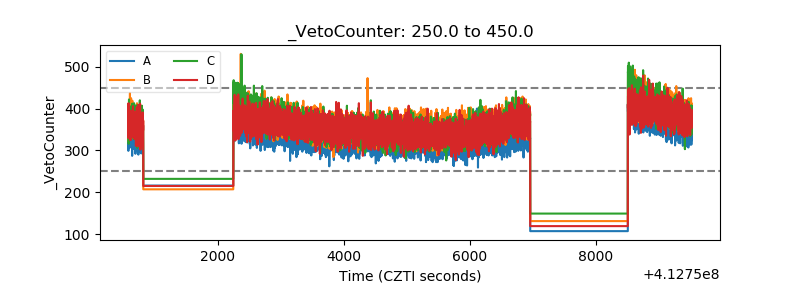 |