| Param | Original file | Final file |
|---|---|---|
| Filename | modeM0/AS1A12_051T01_9000005490_39688cztM0_level2.fits | modeM0/AS1A12_051T01_9000005490_39688cztM0_level2_quad_clean.evt |
| Size (bytes) | 619,727,040 | 80,107,200 |
| Size | 591.0 MB | 76.4 MB |
| Events in quadrant A | 11,514,508 | 282,089 |
| Events in quadrant B | 2,768,951 | 633,013 |
| Events in quadrant C | 5,374,260 | 563,535 |
| Events in quadrant D | 2,854,198 | 560,576 |
| Mode M9 | |||
|---|---|---|---|
| Quadrant | BADHDUFLAG | Total packets | Discarded packets |
| A | 0 | 17 | 0 |
| B | 0 | 17 | 0 |
| C | 0 | 17 | 0 |
| D | 0 | 17 | 0 |
| Mode M0 | |||
|---|---|---|---|
| Quadrant | BADHDUFLAG | Total packets | Discarded packets |
| A | 0 | 37984 | 2 |
| B | 0 | 11905 | 1 |
| C | 0 | 19708 | 1 |
| D | 0 | 12346 | 1 |
| Mode SS | |||
|---|---|---|---|
| Quadrant | BADHDUFLAG | Total packets | Discarded packets |
| A | 0 | 112 | 0 |
| B | 0 | 112 | 0 |
| C | 0 | 112 | 0 |
| D | 0 | 112 | 0 |
| Quadrant | Total seconds | Saturated seconds | Saturation percentage |
|---|---|---|---|
| A | 5514 | 3701 | 67.120058% |
| B | 5514 | 63 | 1.142546% |
| C | 5514 | 591 | 10.718172% |
| D | 5514 | 85 | 1.541531% |
Noise dominated data is calculated using 1-second bins in cleaned event files. If a bin has >2000 counts, and if more than 50% of those come from <1% of pixels, then it is considered to be noise-dominated and hence unusable.
| Quadrant | # 1 sec bins | Bins with >0 counts | Bins with >2000 counts | High rate bins dominated by noise | Noise dominated (total time) | Noise dominated (detector-on time) | Marked lightcurve |
|---|---|---|---|---|---|---|---|
| A | 7187 | 5515 | 3127 | 3127 | 43.51% | 56.70% | 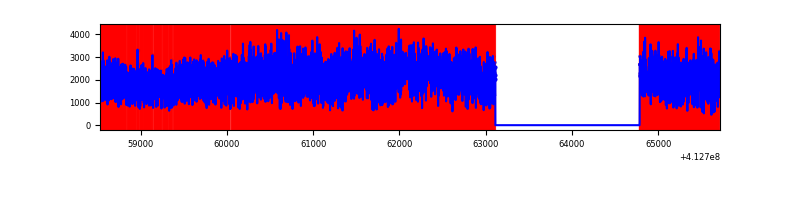 |
| B | 7187 | 5515 | 45 | 45 | 0.63% | 0.82% | 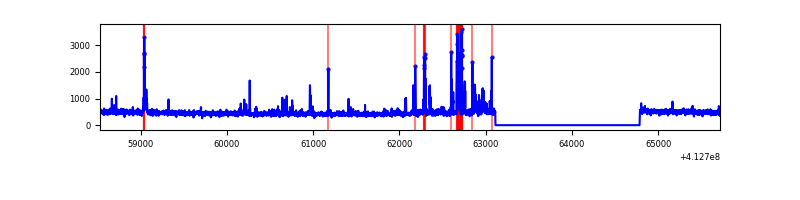 |
| C | 7187 | 5515 | 523 | 523 | 7.28% | 9.48% | 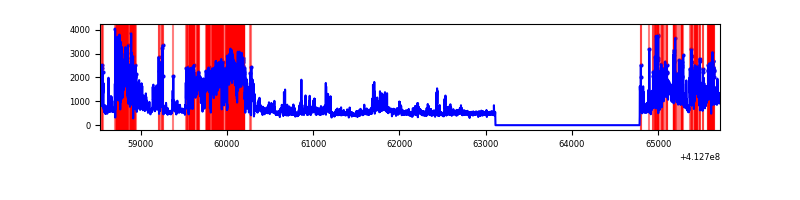 |
| D | 7187 | 5515 | 57 | 57 | 0.79% | 1.03% | 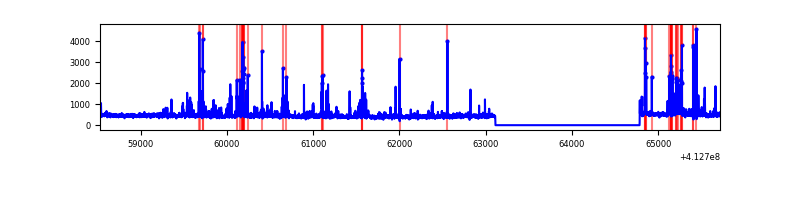 |
Top three noisy pixels from each quadrant. If the there are fewer than three noisy pixels in the level2.evt file, extra rows are filled as -1
| Pixel properties | Quadrant properties | ||||||
|---|---|---|---|---|---|---|---|
| Quadrant | DetID | PixID | Counts | Sigma | Mean | Median | Sigma |
| A | 15 | 222 | 8837211 | 83363.28 | 515 | 502 | 106.0 |
| A | 10 | 83 | 377250 | 3554.15 | 515 | 502 | 106.0 |
| A | 15 | 174 | 277804 | 2616.0 | 515 | 502 | 106.0 |
| B | 5 | 255 | 183879 | 1532.17 | 616 | 599 | 119.6 |
| B | 5 | 172 | 74118 | 614.6 | 616 | 599 | 119.6 |
| B | 10 | 246 | 48740 | 402.45 | 616 | 599 | 119.6 |
| C | 15 | 208 | 1947630 | 14112.84 | 587 | 589 | 138.0 |
| C | 9 | 187 | 860959 | 6236.26 | 587 | 589 | 138.0 |
| C | 15 | 214 | 226628 | 1638.41 | 587 | 589 | 138.0 |
| D | 13 | 249 | 243247 | 1667.36 | 603 | 587 | 145.5 |
| D | 12 | 233 | 103648 | 708.15 | 603 | 587 | 145.5 |
| D | 2 | 250 | 68416 | 466.06 | 603 | 587 | 145.5 |
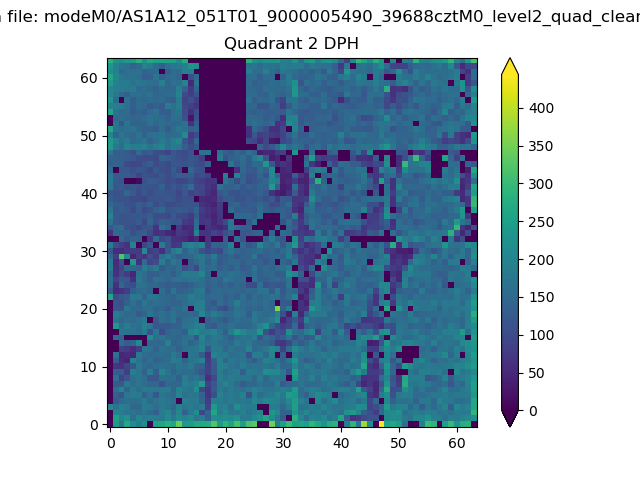
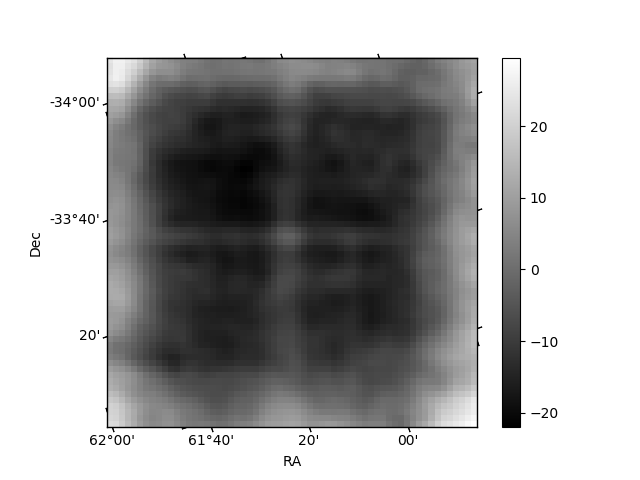
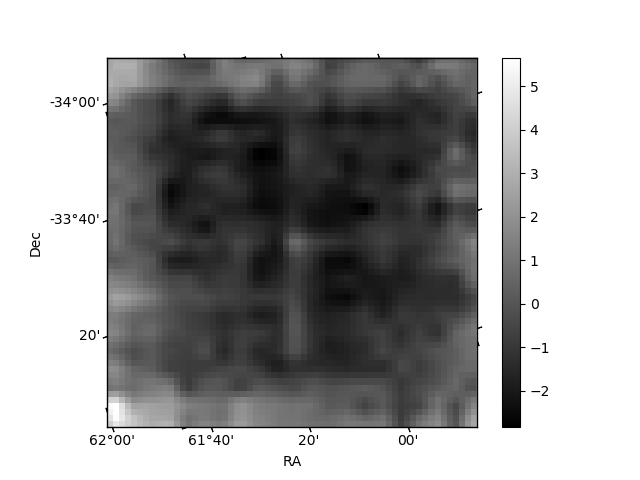
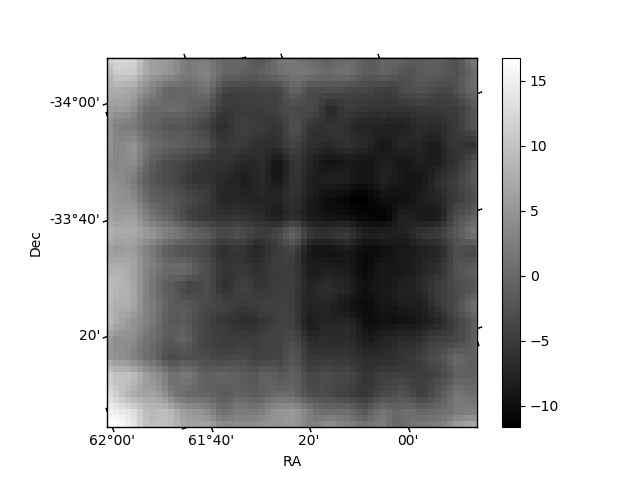
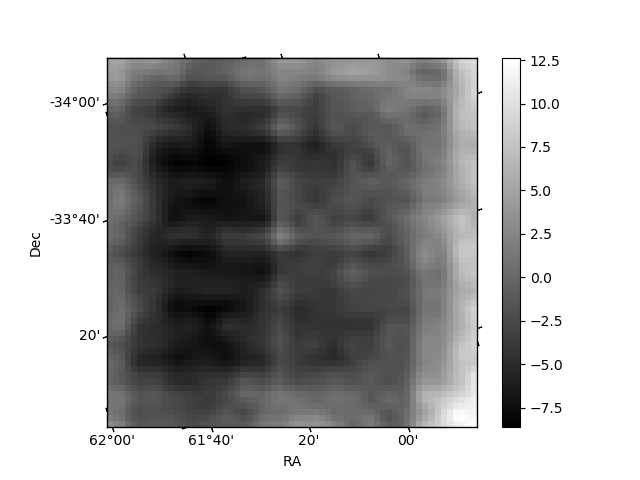
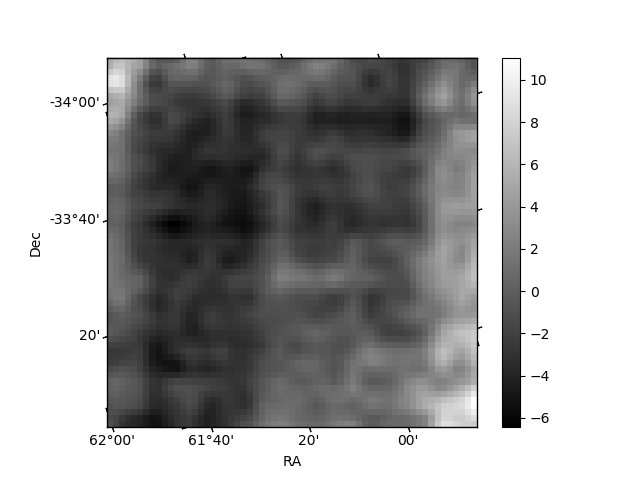
Histogram calculated using DETX and DETY for each event in the final _common_clean file
| Quadrant A | 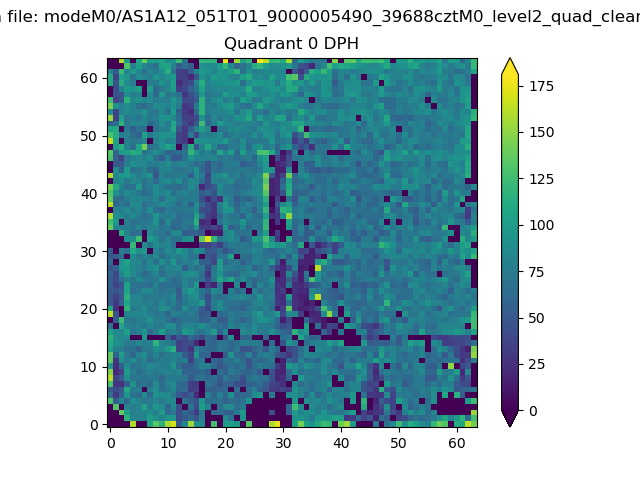 |
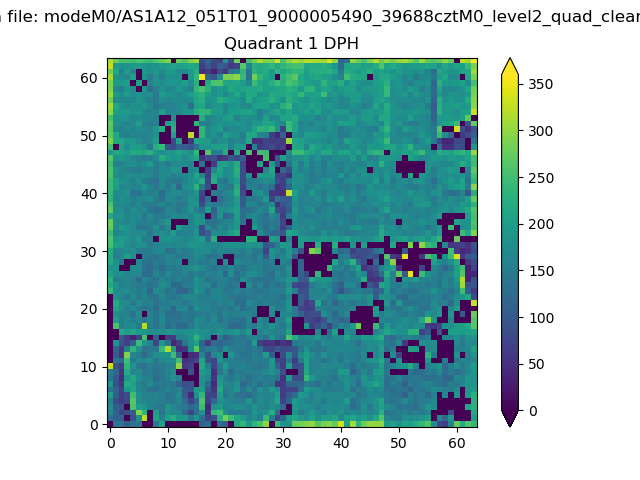 |
Quadrant B |
|---|---|---|---|
| Quadrant D | 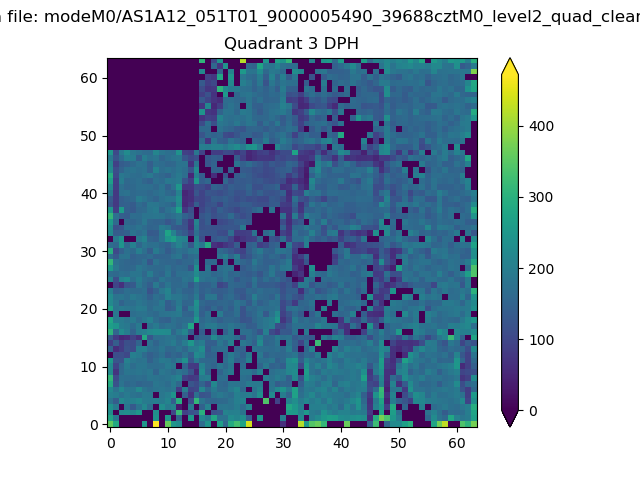 |
 |
Quadrant C |
| Plot type | Count rate plots | Images |
|---|---|---|
| Comparison with Poisson distribution Blue bars denote a histogram of data divided into 1 sec bins. Red curve is a Poisson curve with rate = median count rate of data. |
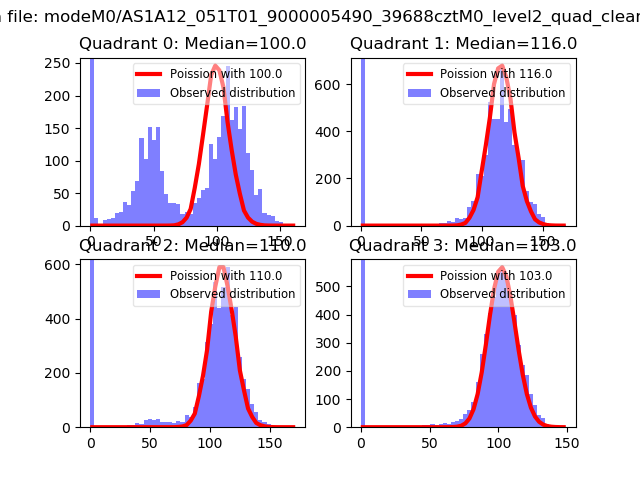 |
 |
| Quadrant-wise count rates Data is divided into 100 sec bins |
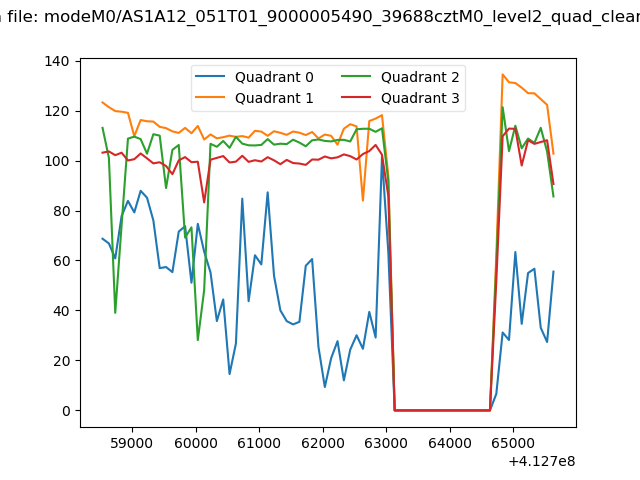 |
|
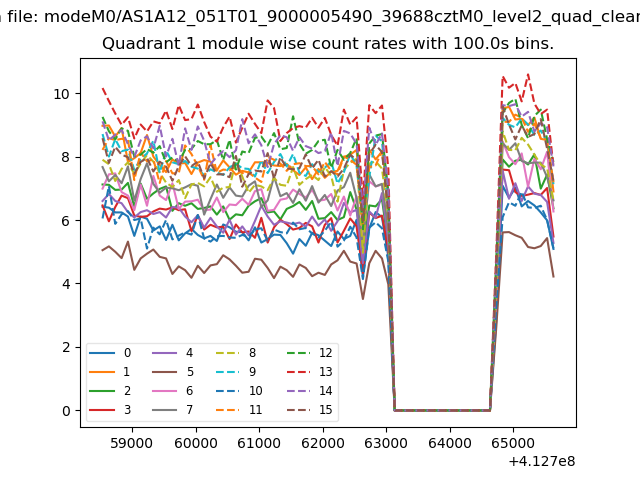
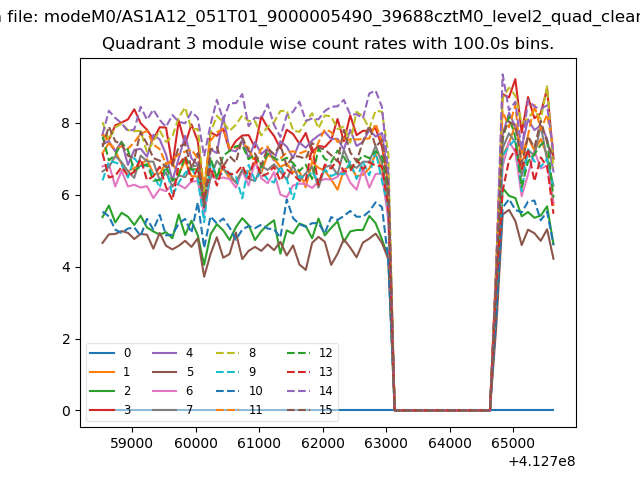
| Module-wise count rates for Quadrant A Data is divided into 100 sec bins |
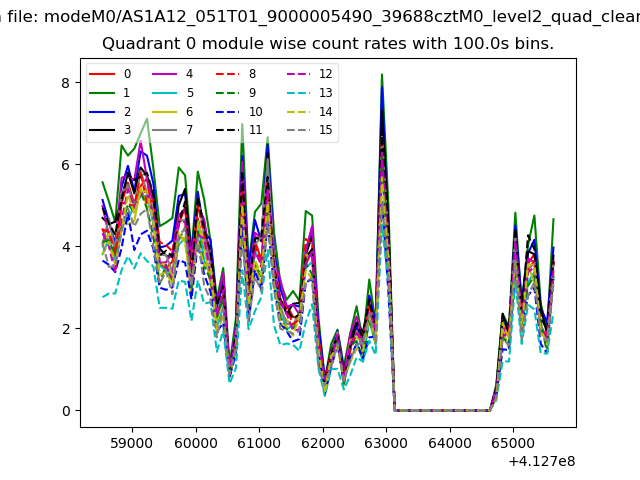 |
 |
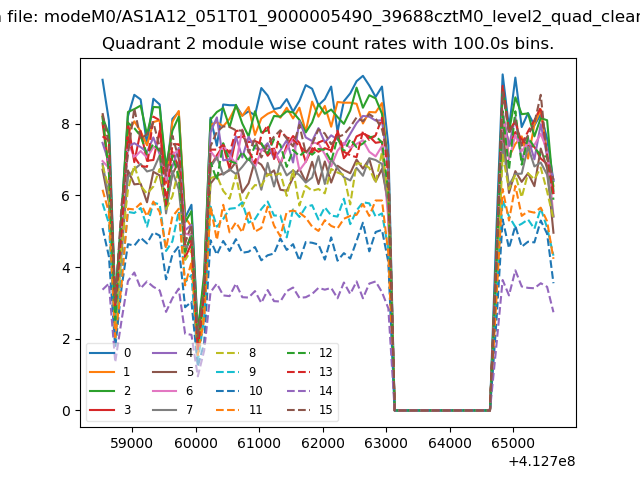
| Module-wise count rates for Quadrant B Data is divided into 100 sec bins |
 |
 |
| Module-wise count rates for Quadrant C Data is divided into 100 sec bins |
 |
 |
| Module-wise count rates for Quadrant D Data is divided into 100 sec bins |
 |
 |
| Parameter | Plot |
|---|---|
| CZT HV Monitor |  |
| D_VDD | 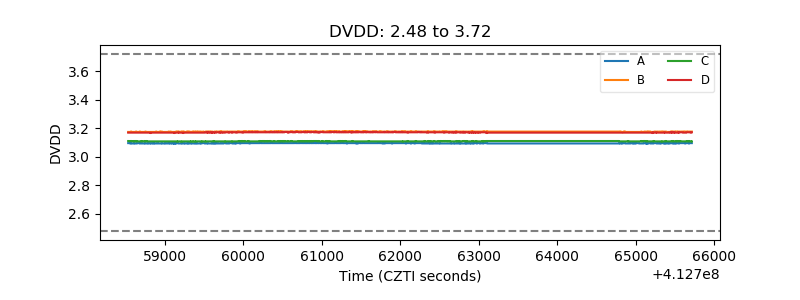 |
| Temperature 1 | 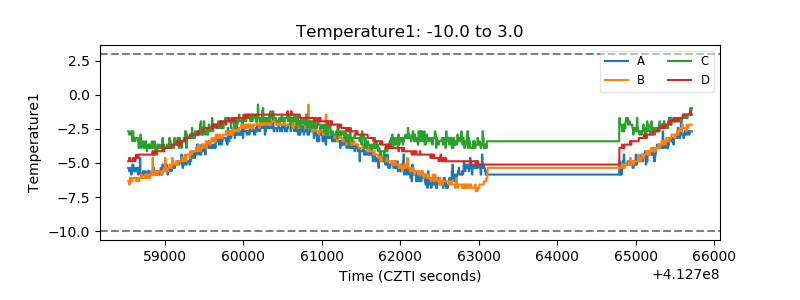 |
| Veto HV Monitor | 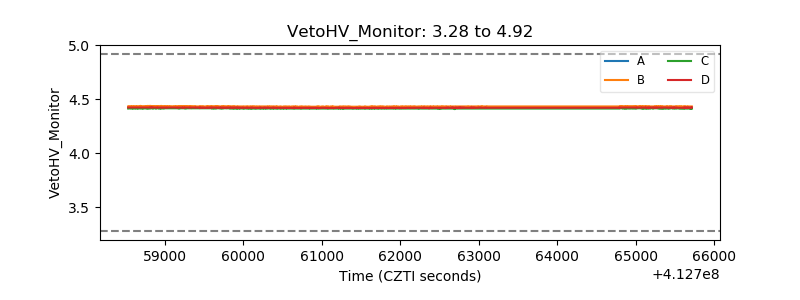 |
| Veto LLD | 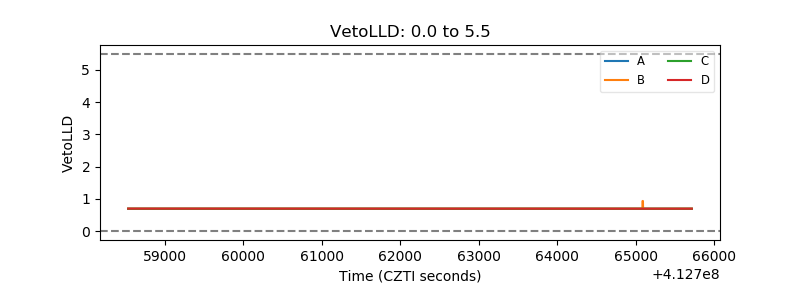 |
| Alpha Counter | 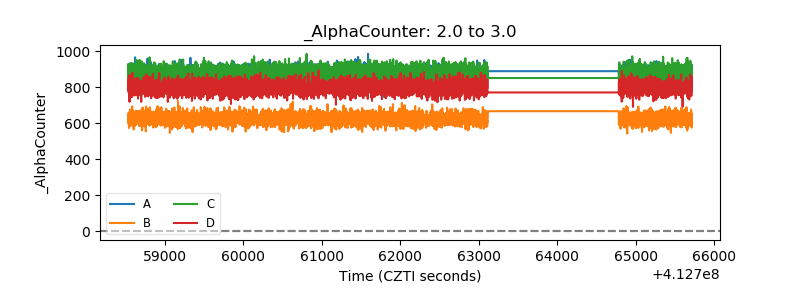 |
| _CPM_Rate | 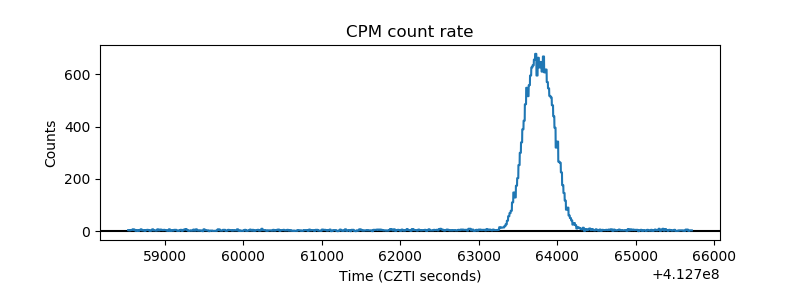 |
| CZT Counter | 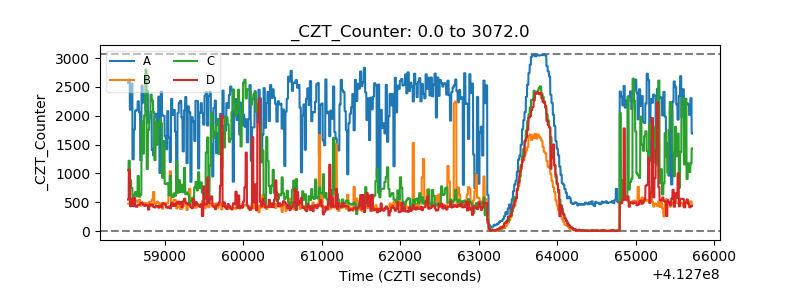 |
| +2.5 Volts monitor | 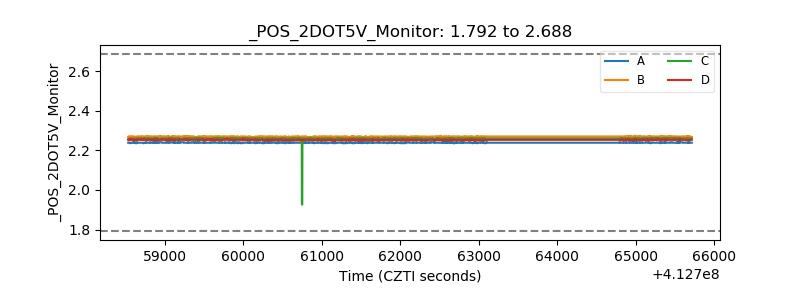 |
| +5 Volts monitor | 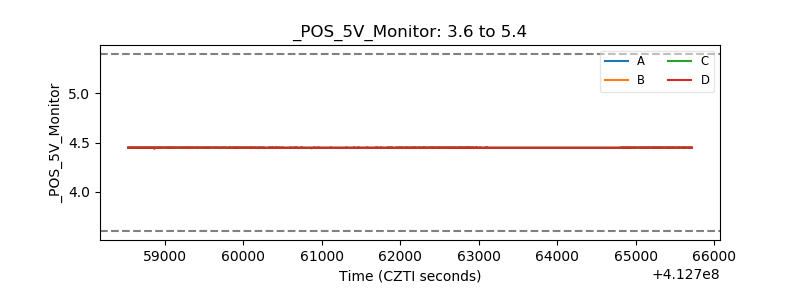 |
| _ROLL_ROT | 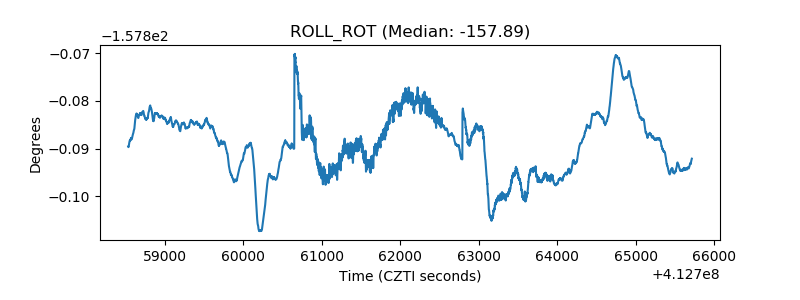 |
| _Roll_DEC | 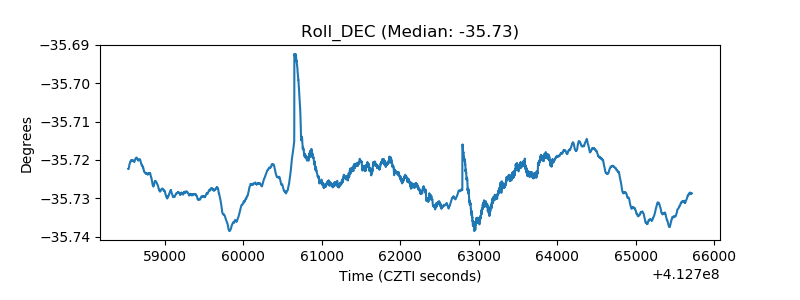 |
| _Roll_RA | 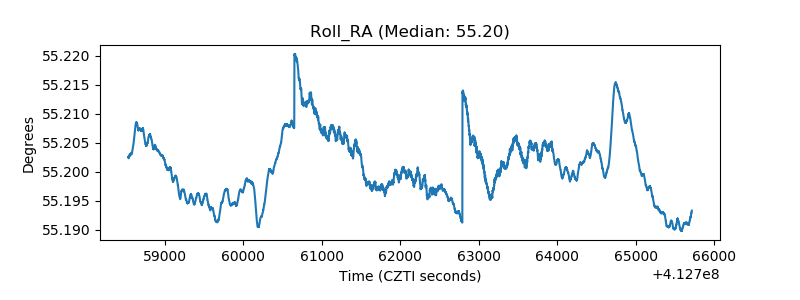 |
| Veto Counter | 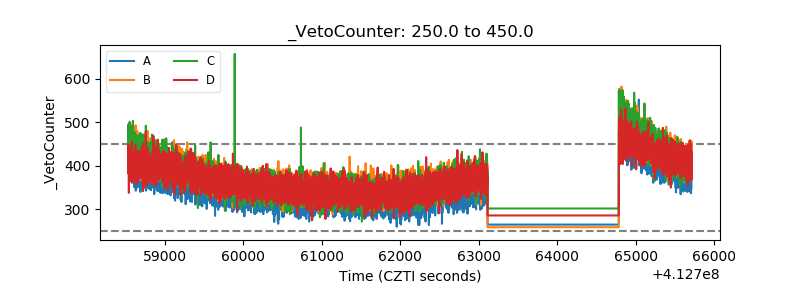 |