| Param | Original file | Final file |
|---|---|---|
| Filename | modeM0/AS1A12_051T01_9000005490_39690cztM0_level2.fits | modeM0/AS1A12_051T01_9000005490_39690cztM0_level2_quad_clean.evt |
| Size (bytes) | 629,706,240 | 82,653,120 |
| Size | 600.5 MB | 78.8 MB |
| Events in quadrant A | 10,656,026 | 342,487 |
| Events in quadrant B | 2,913,953 | 648,750 |
| Events in quadrant C | 6,127,133 | 562,710 |
| Events in quadrant D | 3,197,607 | 573,535 |
| Mode M9 | |||
|---|---|---|---|
| Quadrant | BADHDUFLAG | Total packets | Discarded packets |
| A | 0 | 18 | 0 |
| B | 0 | 18 | 0 |
| C | 0 | 18 | 0 |
| D | 0 | 18 | 0 |
| Mode M0 | |||
|---|---|---|---|
| Quadrant | BADHDUFLAG | Total packets | Discarded packets |
| A | 0 | 35330 | 3 |
| B | 0 | 12057 | 2 |
| C | 0 | 21952 | 2 |
| D | 0 | 13100 | 2 |
| Mode SS | |||
|---|---|---|---|
| Quadrant | BADHDUFLAG | Total packets | Discarded packets |
| A | 0 | 110 | 0 |
| B | 0 | 110 | 0 |
| C | 0 | 110 | 0 |
| D | 0 | 110 | 0 |
| Quadrant | Total seconds | Saturated seconds | Saturation percentage |
|---|---|---|---|
| A | 5353 | 3111 | 58.116944% |
| B | 5353 | 49 | 0.915375% |
| C | 5353 | 694 | 12.964693% |
| D | 5353 | 90 | 1.681300% |
Noise dominated data is calculated using 1-second bins in cleaned event files. If a bin has >2000 counts, and if more than 50% of those come from <1% of pixels, then it is considered to be noise-dominated and hence unusable.
| Quadrant | # 1 sec bins | Bins with >0 counts | Bins with >2000 counts | High rate bins dominated by noise | Noise dominated (total time) | Noise dominated (detector-on time) | Marked lightcurve |
|---|---|---|---|---|---|---|---|
| A | 7145 | 5354 | 2568 | 2568 | 35.94% | 47.96% |  |
| B | 7145 | 5354 | 38 | 38 | 0.53% | 0.71% |  |
| C | 7145 | 5354 | 662 | 662 | 9.27% | 12.36% | 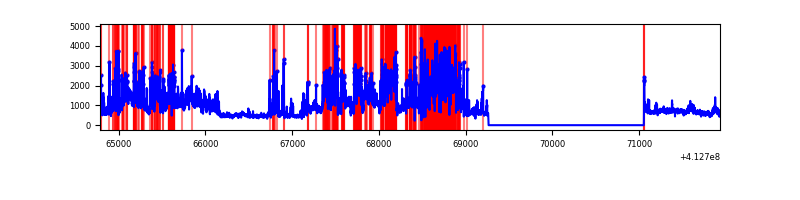 |
| D | 7145 | 5354 | 78 | 78 | 1.09% | 1.46% | 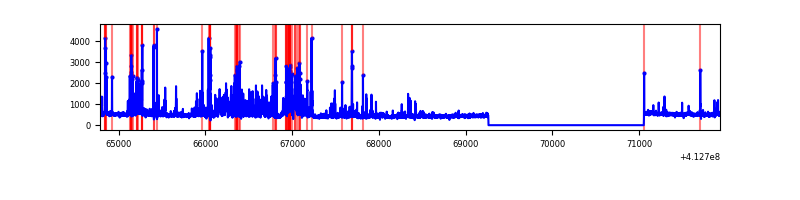 |
Top three noisy pixels from each quadrant. If the there are fewer than three noisy pixels in the level2.evt file, extra rows are filled as -1
| Pixel properties | Quadrant properties | ||||||
|---|---|---|---|---|---|---|---|
| Quadrant | DetID | PixID | Counts | Sigma | Mean | Median | Sigma |
| A | 15 | 222 | 7649056 | 71647.97 | 521 | 514 | 106.8 |
| A | 15 | 174 | 544189 | 5092.89 | 521 | 514 | 106.8 |
| A | 10 | 83 | 390598 | 3654.12 | 521 | 514 | 106.8 |
| B | 5 | 172 | 276249 | 2326.15 | 613 | 597 | 118.5 |
| B | 0 | 229 | 112247 | 942.18 | 613 | 597 | 118.5 |
| B | 10 | 246 | 84733 | 710.0 | 613 | 597 | 118.5 |
| C | 15 | 208 | 2672051 | 19867.67 | 573 | 578 | 134.5 |
| C | 9 | 187 | 975789 | 7252.62 | 573 | 578 | 134.5 |
| C | 15 | 214 | 217064 | 1610.0 | 573 | 578 | 134.5 |
| D | 12 | 233 | 483081 | 3289.43 | 599 | 582 | 146.7 |
| D | 13 | 249 | 191428 | 1301.09 | 599 | 582 | 146.7 |
| D | 2 | 250 | 67841 | 458.54 | 599 | 582 | 146.7 |
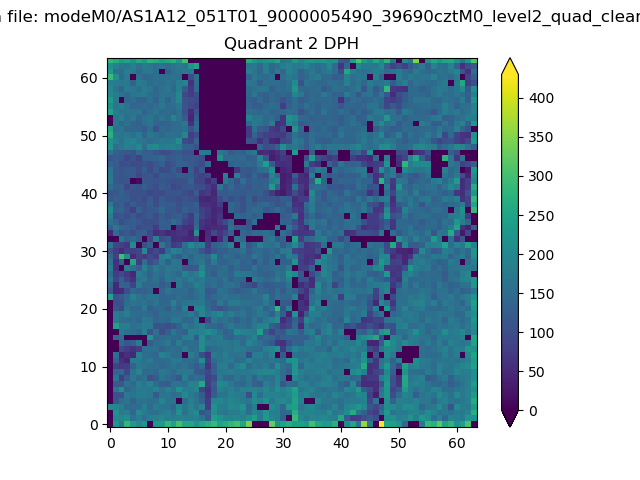
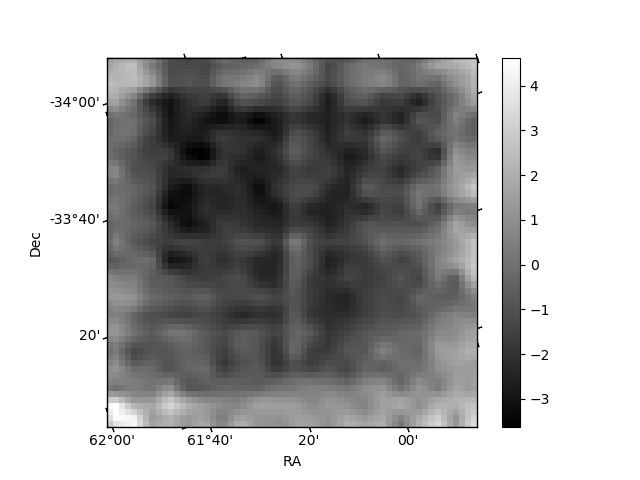
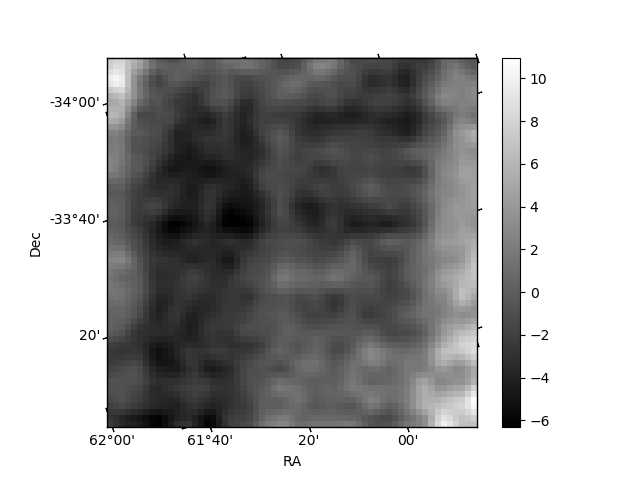
Histogram calculated using DETX and DETY for each event in the final _common_clean file
| Quadrant A | 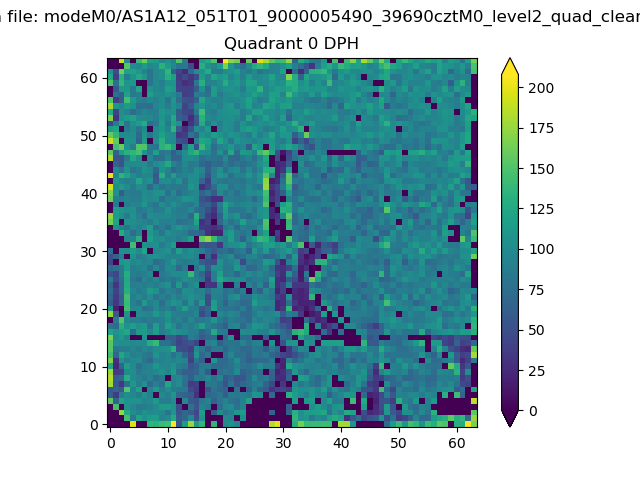 |
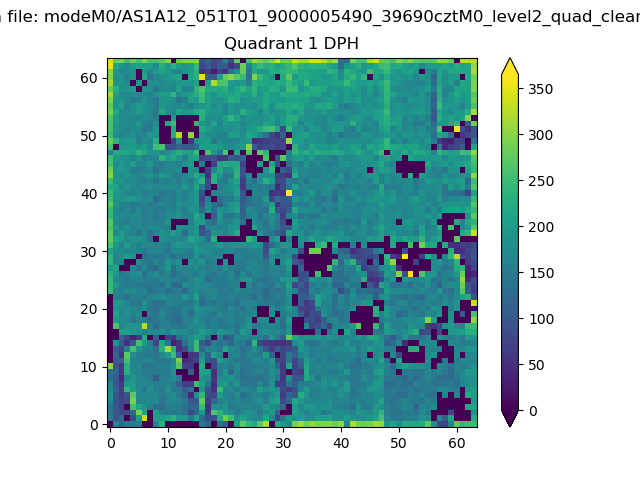 |
Quadrant B |
|---|---|---|---|
| Quadrant D | 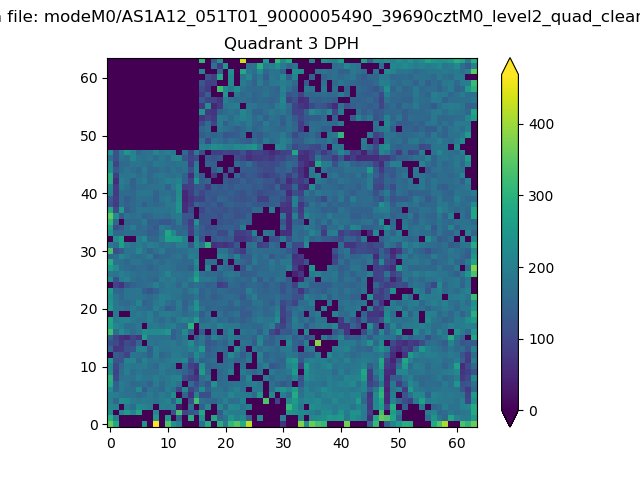 |
 |
Quadrant C |
| Plot type | Count rate plots | Images |
|---|---|---|
| Comparison with Poisson distribution Blue bars denote a histogram of data divided into 1 sec bins. Red curve is a Poisson curve with rate = median count rate of data. |
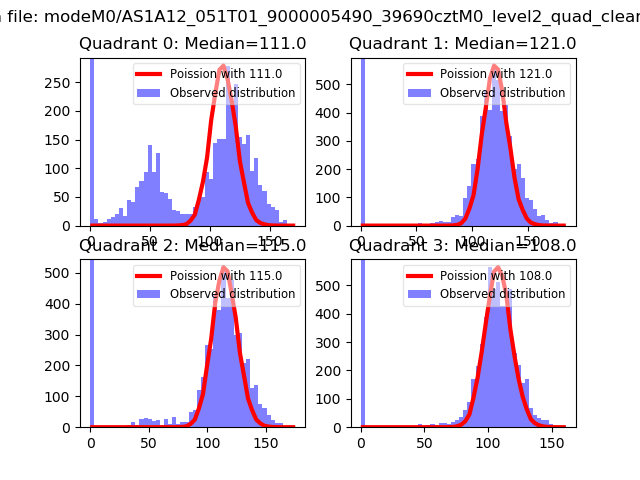 |
 |
| Quadrant-wise count rates Data is divided into 100 sec bins |
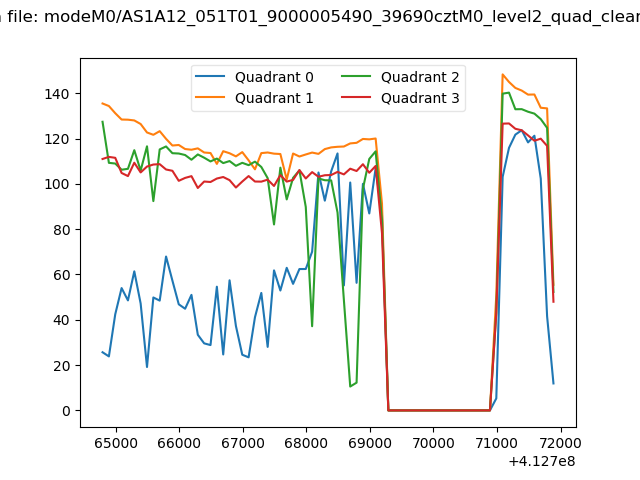 |
|
| Module-wise count rates for Quadrant A Data is divided into 100 sec bins |
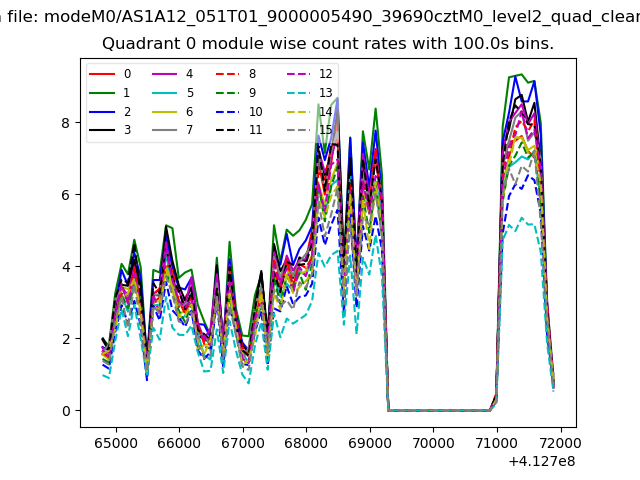 |
 |
| Module-wise count rates for Quadrant B Data is divided into 100 sec bins |
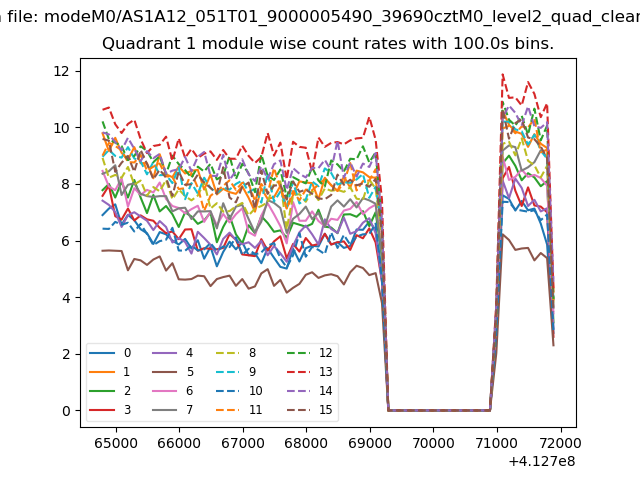 |
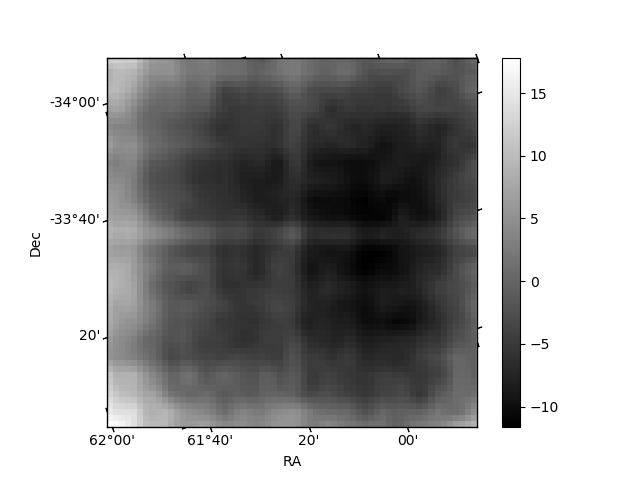 |
| Module-wise count rates for Quadrant C Data is divided into 100 sec bins |
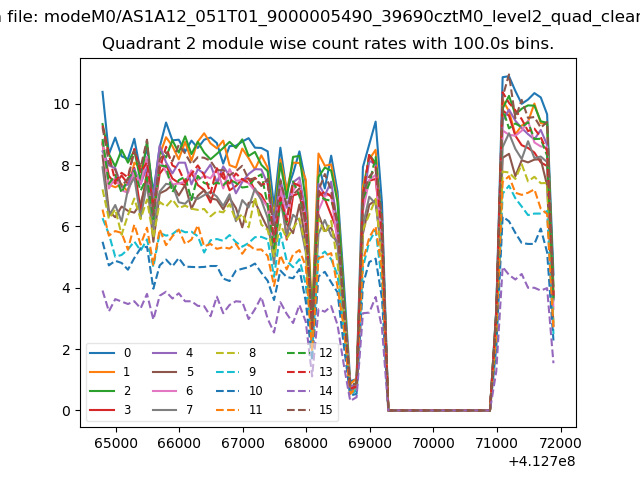 |
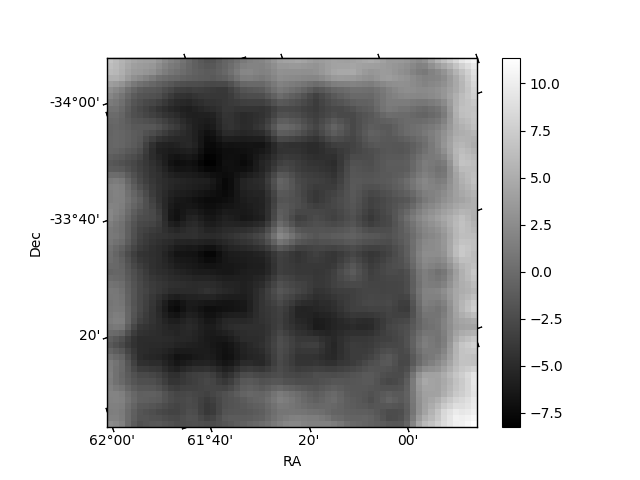 |
| Module-wise count rates for Quadrant D Data is divided into 100 sec bins |
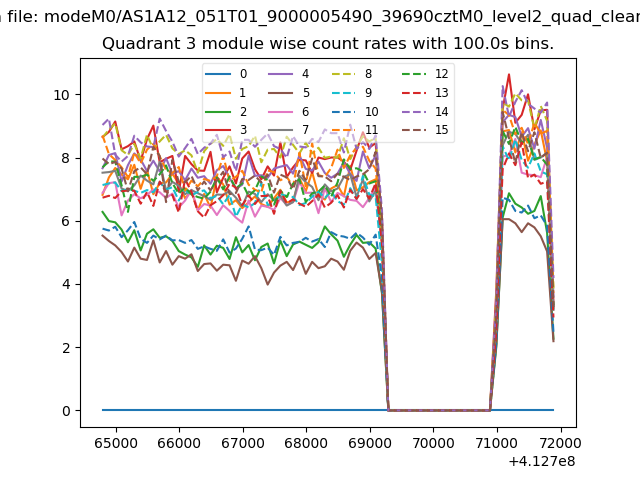 |
 |
| Parameter | Plot |
|---|---|
| CZT HV Monitor | 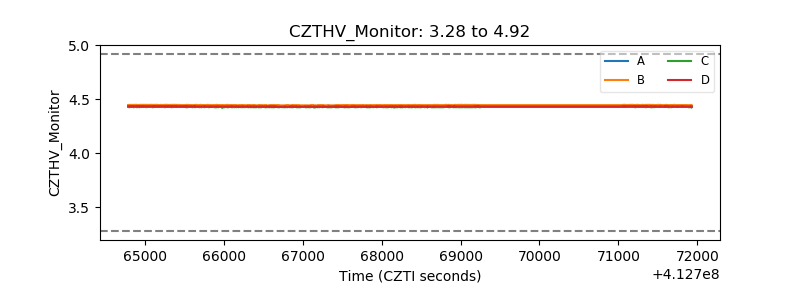 |
| D_VDD | 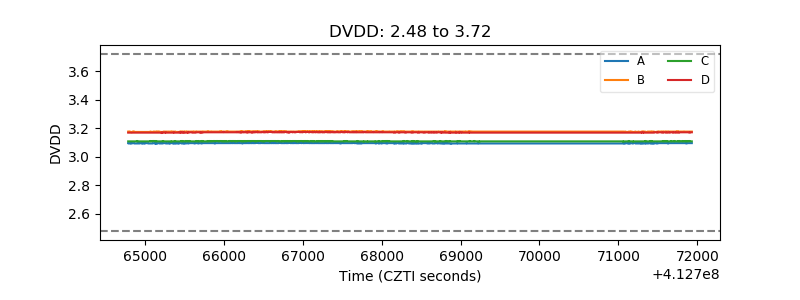 |
| Temperature 1 | 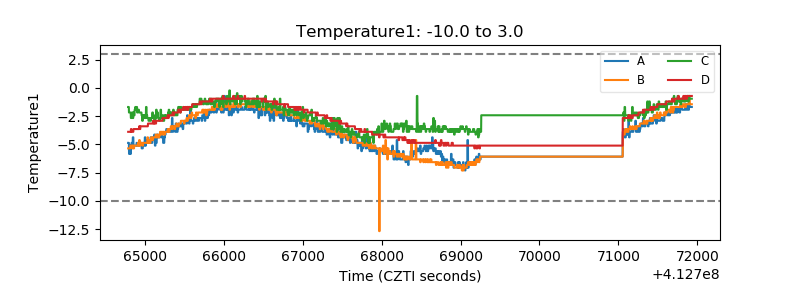 |
| Veto HV Monitor |  |
| Veto LLD | 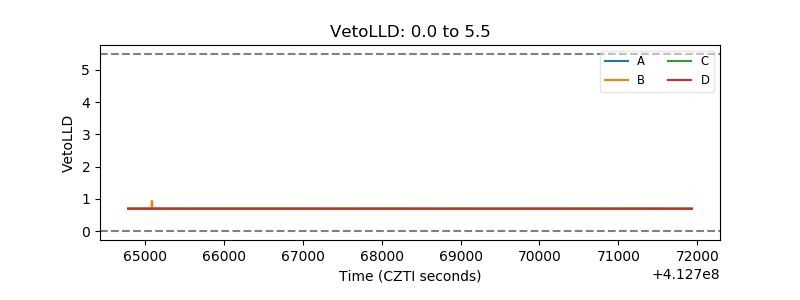 |
| Alpha Counter | 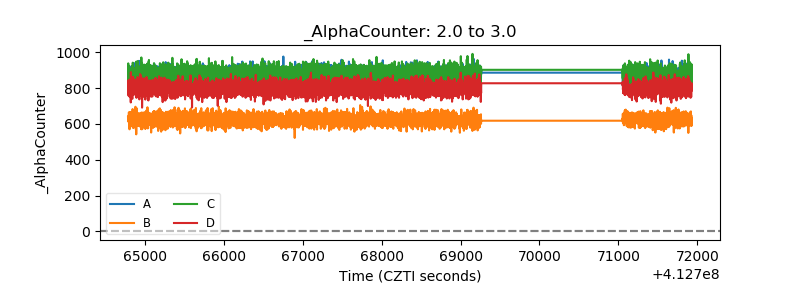 |
| _CPM_Rate | 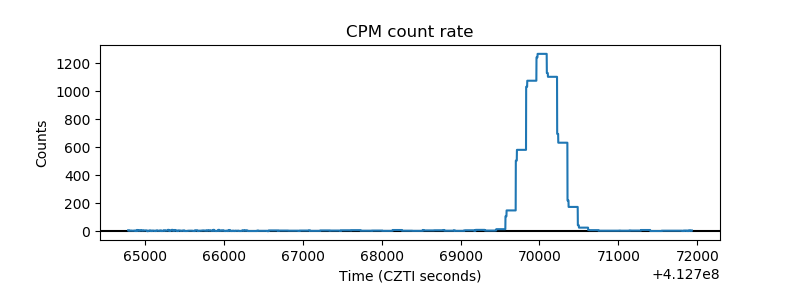 |
| CZT Counter | 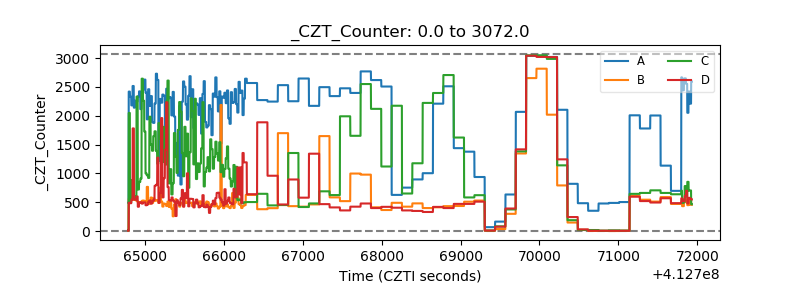 |
| +2.5 Volts monitor | 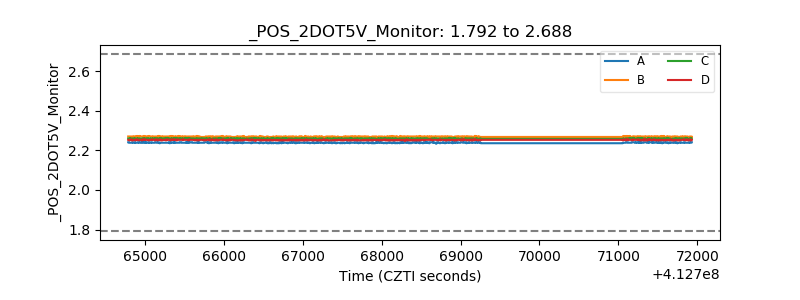 |
| +5 Volts monitor | 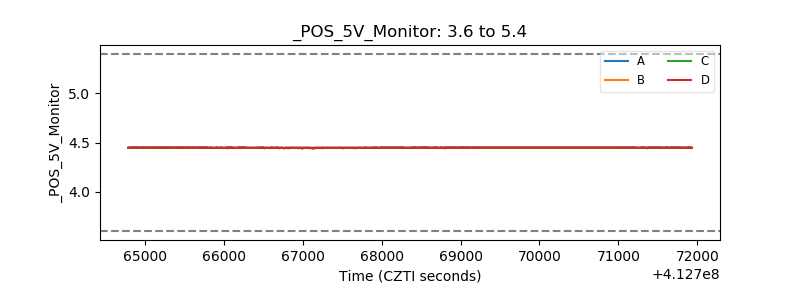 |
| _ROLL_ROT | 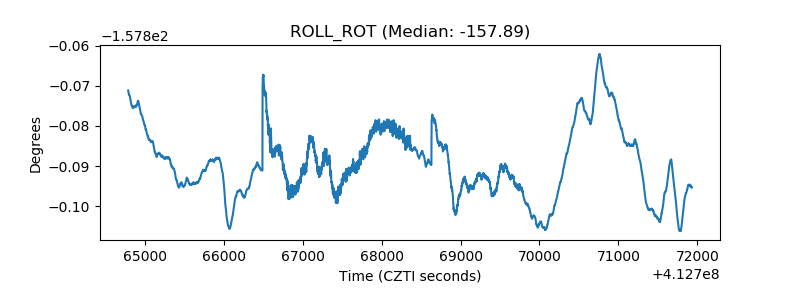 |
| _Roll_DEC | 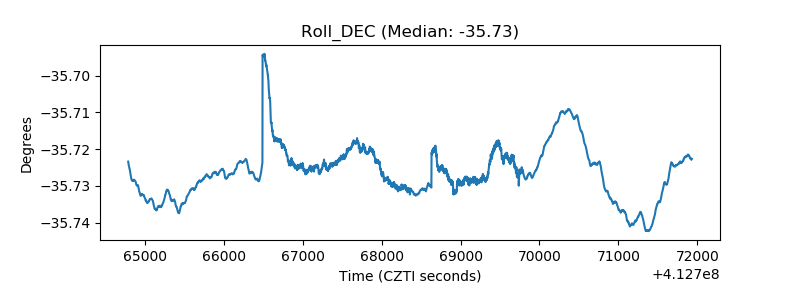 |
| _Roll_RA | 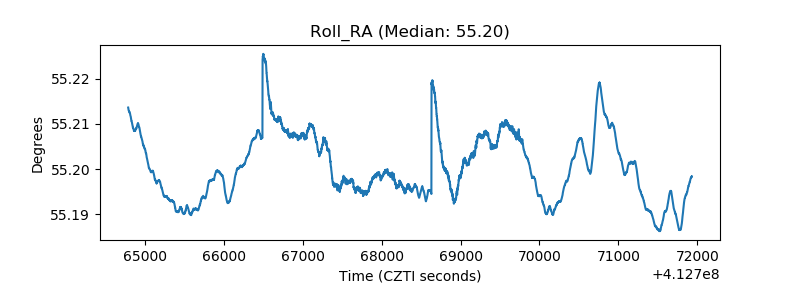 |
| Veto Counter | 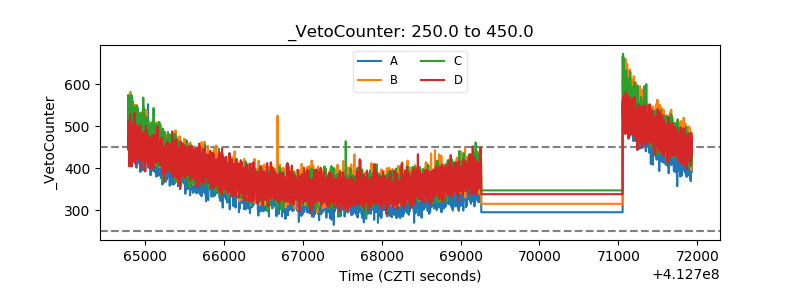 |