| Param | Original file | Final file |
|---|---|---|
| Filename | modeM0/AS1A12_051T01_9000005490_39691cztM0_level2.fits | modeM0/AS1A12_051T01_9000005490_39691cztM0_level2_quad_clean.evt |
| Size (bytes) | 596,689,920 | 83,459,520 |
| Size | 569.0 MB | 79.6 MB |
| Events in quadrant A | 11,057,832 | 277,224 |
| Events in quadrant B | 2,779,712 | 671,495 |
| Events in quadrant C | 4,437,121 | 632,294 |
| Events in quadrant D | 3,407,875 | 580,483 |
| Mode M9 | |||
|---|---|---|---|
| Quadrant | BADHDUFLAG | Total packets | Discarded packets |
| A | 0 | 19 | 0 |
| B | 0 | 19 | 0 |
| C | 0 | 19 | 0 |
| D | 0 | 20 | 0 |
| Mode M0 | |||
|---|---|---|---|
| Quadrant | BADHDUFLAG | Total packets | Discarded packets |
| A | 0 | 36437 | 3 |
| B | 0 | 11578 | 2 |
| C | 0 | 16745 | 2 |
| D | 0 | 13637 | 2 |
| Mode SS | |||
|---|---|---|---|
| Quadrant | BADHDUFLAG | Total packets | Discarded packets |
| A | 0 | 106 | 0 |
| B | 0 | 106 | 0 |
| C | 0 | 106 | 0 |
| D | 0 | 106 | 0 |
| Quadrant | Total seconds | Saturated seconds | Saturation percentage |
|---|---|---|---|
| A | 5217 | 3516 | 67.395055% |
| B | 5217 | 36 | 0.690052% |
| C | 5217 | 102 | 1.955147% |
| D | 5217 | 146 | 2.798543% |
Noise dominated data is calculated using 1-second bins in cleaned event files. If a bin has >2000 counts, and if more than 50% of those come from <1% of pixels, then it is considered to be noise-dominated and hence unusable.
| Quadrant | # 1 sec bins | Bins with >0 counts | Bins with >2000 counts | High rate bins dominated by noise | Noise dominated (total time) | Noise dominated (detector-on time) | Marked lightcurve |
|---|---|---|---|---|---|---|---|
| A | 7131 | 5218 | 2894 | 2894 | 40.58% | 55.46% |  |
| B | 7131 | 5218 | 17 | 17 | 0.24% | 0.33% |  |
| C | 7131 | 5218 | 148 | 148 | 2.08% | 2.84% | 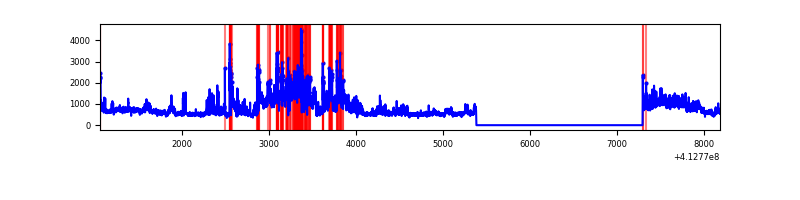 |
| D | 7131 | 5218 | 119 | 119 | 1.67% | 2.28% |  |
Top three noisy pixels from each quadrant. If the there are fewer than three noisy pixels in the level2.evt file, extra rows are filled as -1
| Pixel properties | Quadrant properties | ||||||
|---|---|---|---|---|---|---|---|
| Quadrant | DetID | PixID | Counts | Sigma | Mean | Median | Sigma |
| A | 15 | 222 | 8074356 | 84061.99 | 469 | 463 | 96.0 |
| A | 0 | 8 | 648618 | 6748.32 | 469 | 463 | 96.0 |
| A | 10 | 83 | 350557 | 3645.03 | 469 | 463 | 96.0 |
| B | 5 | 172 | 135021 | 1133.06 | 617 | 600 | 118.6 |
| B | 5 | 255 | 68960 | 576.22 | 617 | 600 | 118.6 |
| B | 10 | 246 | 43948 | 365.39 | 617 | 600 | 118.6 |
| C | 15 | 208 | 1377973 | 9958.77 | 593 | 598 | 138.3 |
| C | 9 | 187 | 508751 | 3674.07 | 593 | 598 | 138.3 |
| C | 15 | 214 | 217970 | 1571.65 | 593 | 598 | 138.3 |
| D | 12 | 233 | 559337 | 3799.18 | 598 | 582 | 147.1 |
| D | 12 | 227 | 263239 | 1785.9 | 598 | 582 | 147.1 |
| D | 2 | 250 | 122891 | 831.62 | 598 | 582 | 147.1 |
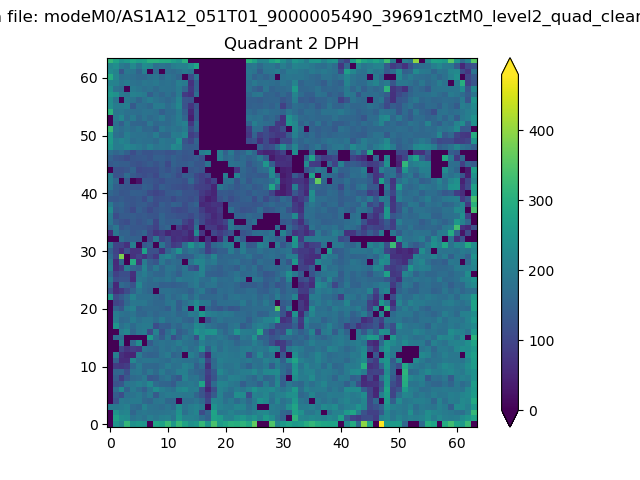
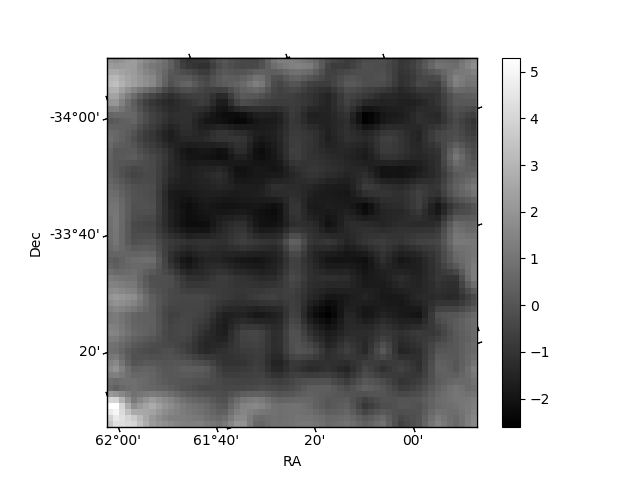
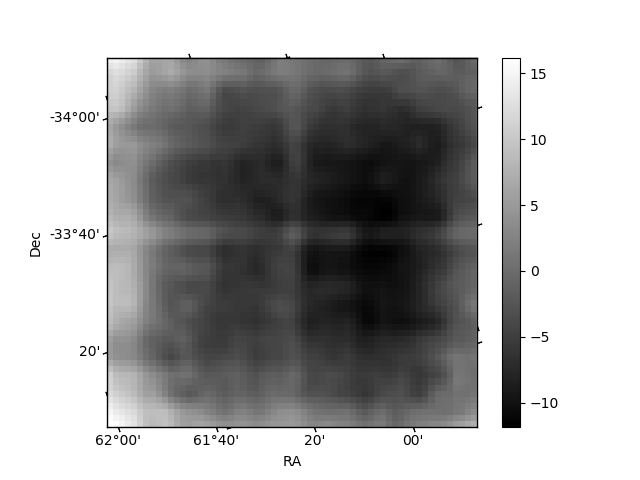
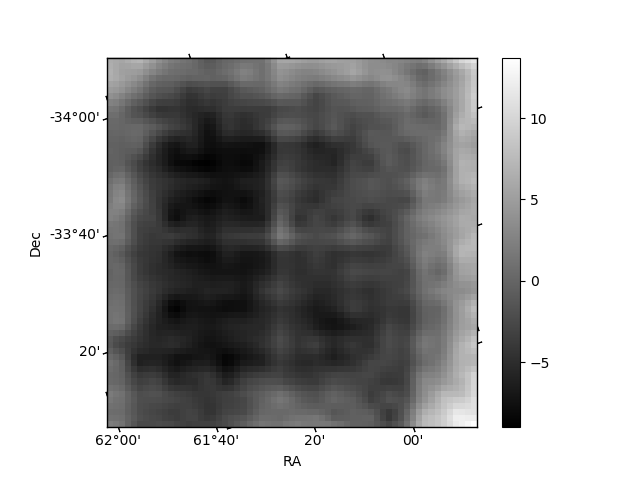
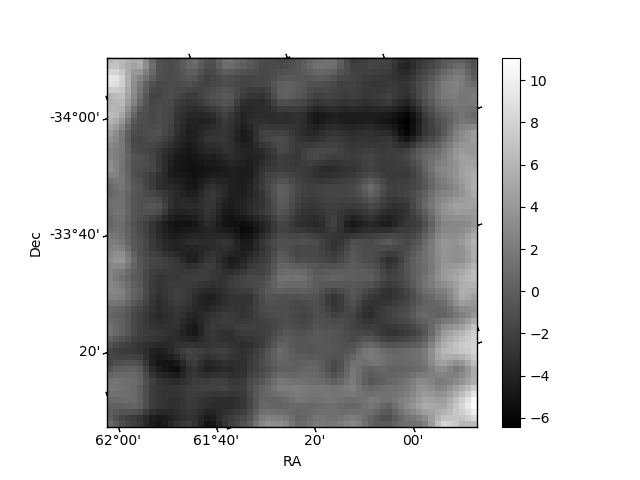
Histogram calculated using DETX and DETY for each event in the final _common_clean file
| Quadrant A | 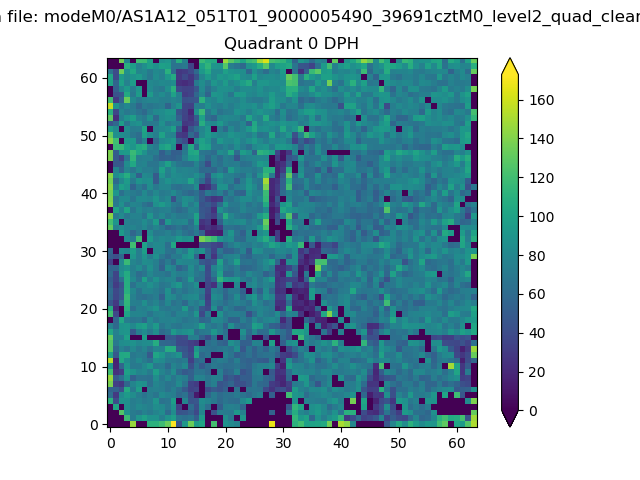 |
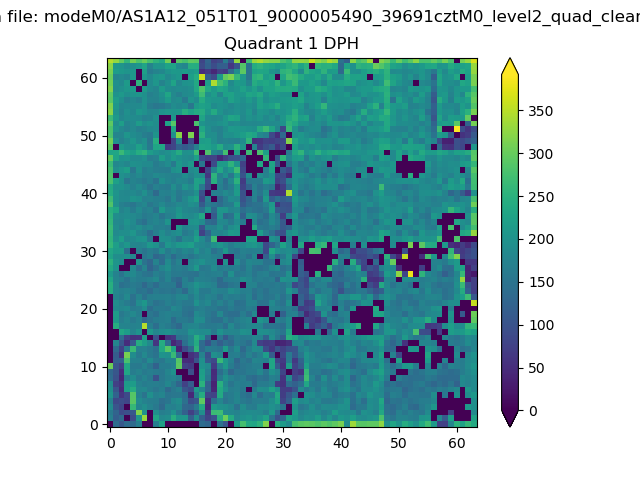 |
Quadrant B |
|---|---|---|---|
| Quadrant D | 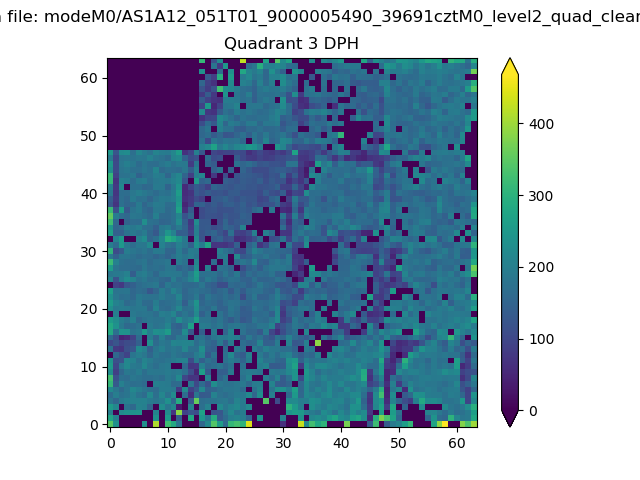 |
 |
Quadrant C |
| Plot type | Count rate plots | Images |
|---|---|---|
| Comparison with Poisson distribution Blue bars denote a histogram of data divided into 1 sec bins. Red curve is a Poisson curve with rate = median count rate of data. |
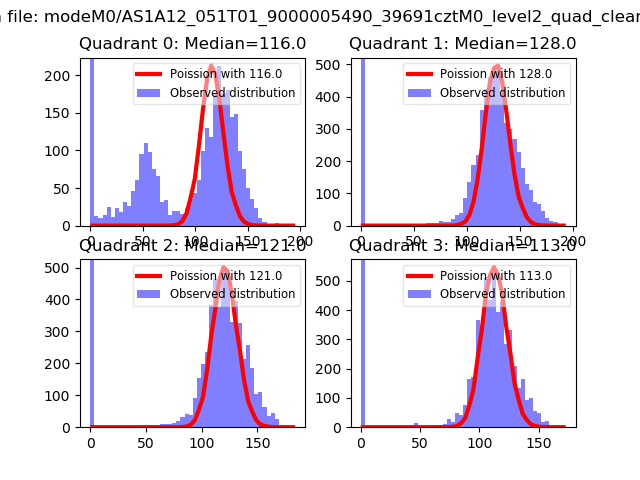 |
 |
| Quadrant-wise count rates Data is divided into 100 sec bins |
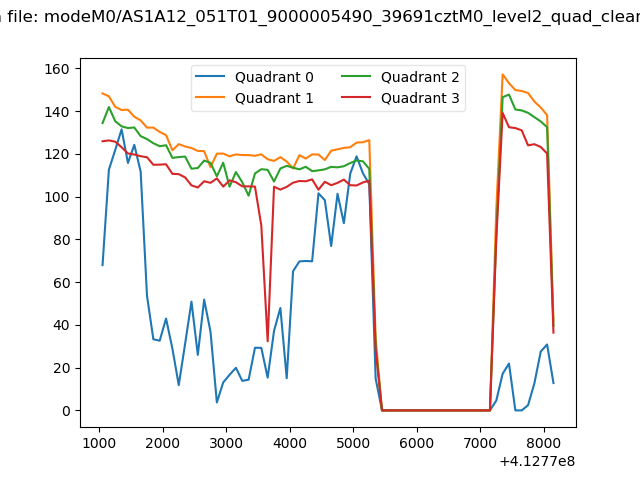 |
|
| Module-wise count rates for Quadrant A Data is divided into 100 sec bins |
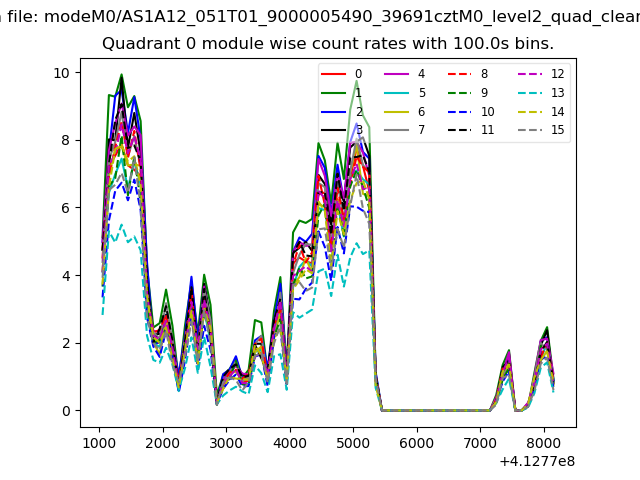 |
 |
| Module-wise count rates for Quadrant B Data is divided into 100 sec bins |
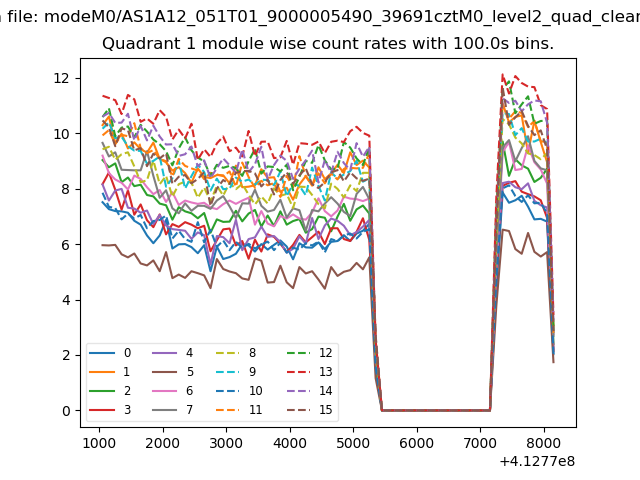 |
 |
| Module-wise count rates for Quadrant C Data is divided into 100 sec bins |
 |
 |
| Module-wise count rates for Quadrant D Data is divided into 100 sec bins |
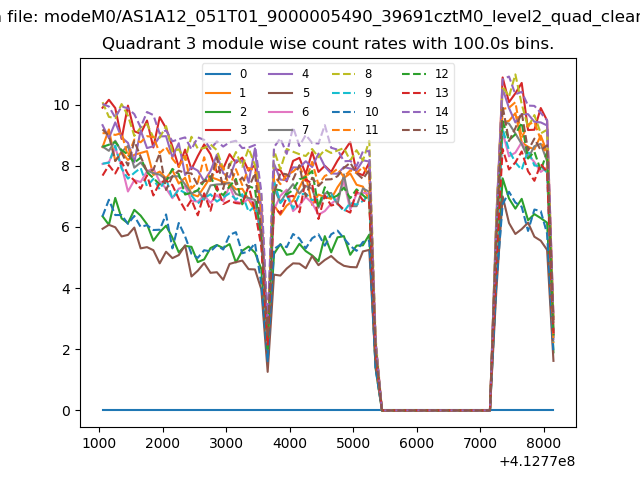 |
 |
| Parameter | Plot |
|---|---|
| CZT HV Monitor |  |
| D_VDD | 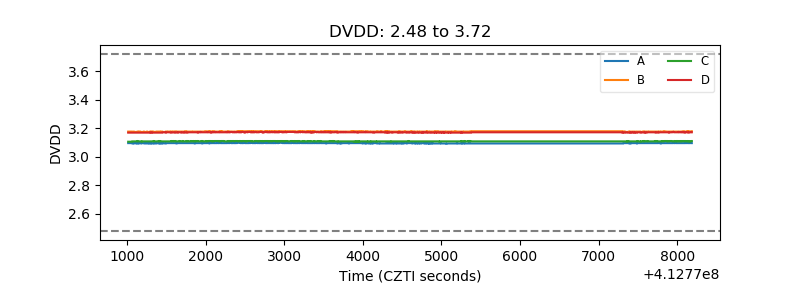 |
| Temperature 1 | 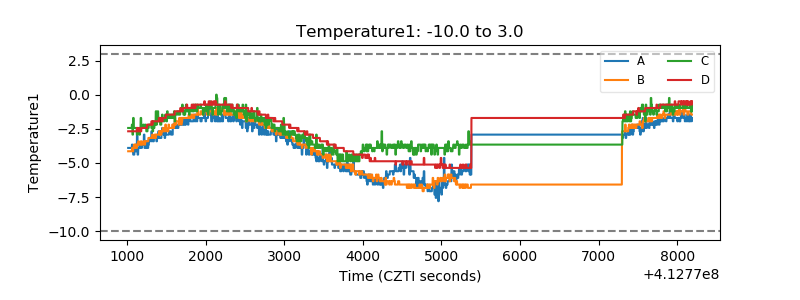 |
| Veto HV Monitor | 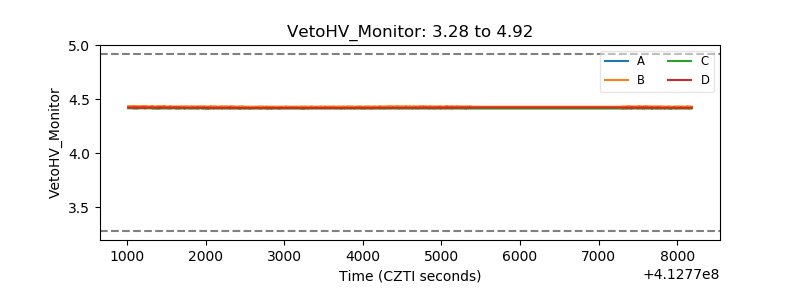 |
| Veto LLD | 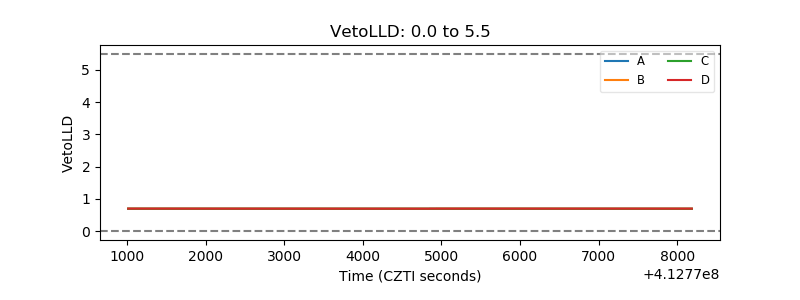 |
| Alpha Counter | 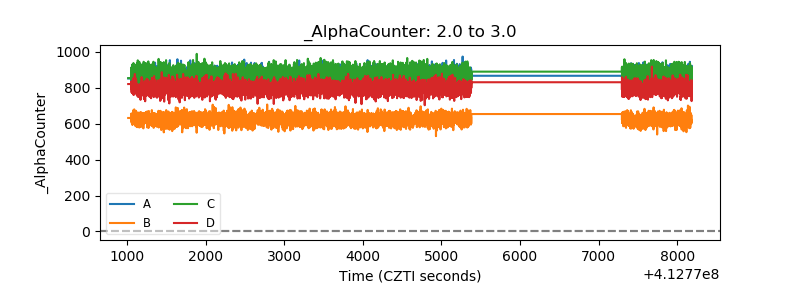 |
| _CPM_Rate | 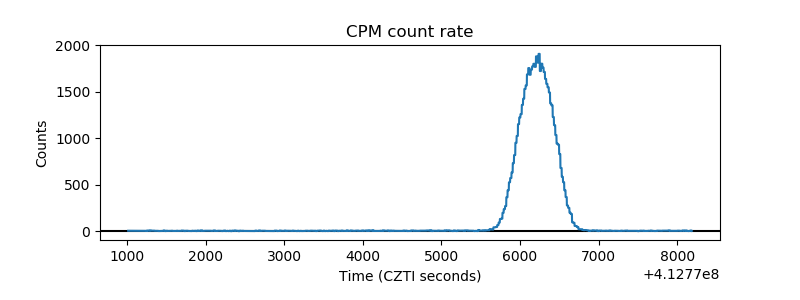 |
| CZT Counter | 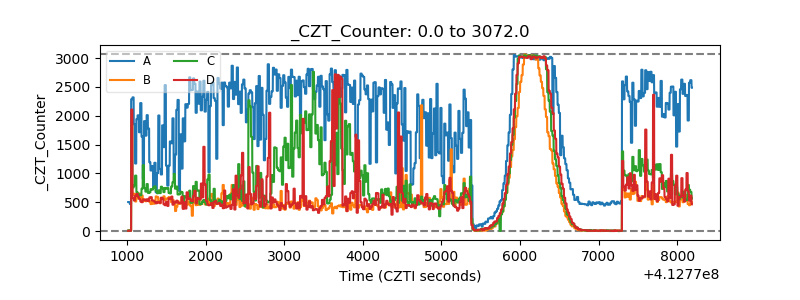 |
| +2.5 Volts monitor | 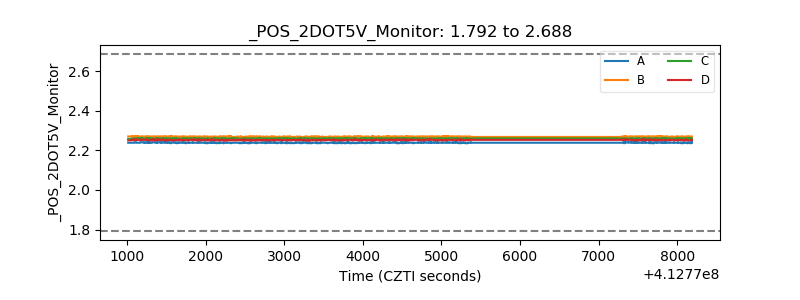 |
| +5 Volts monitor | 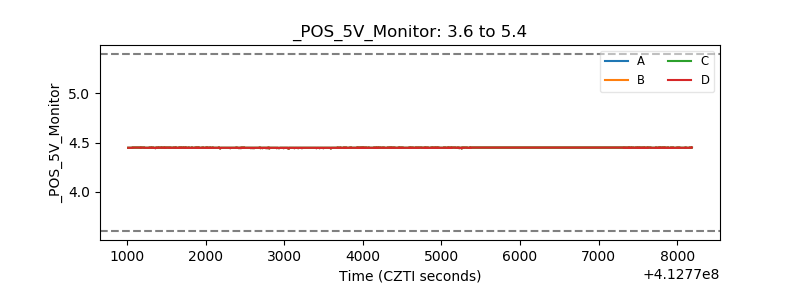 |
| _ROLL_ROT | 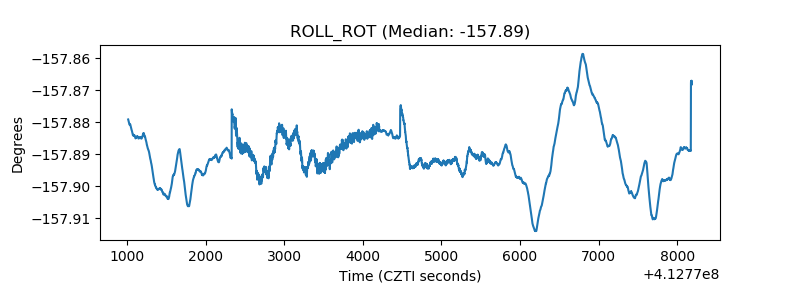 |
| _Roll_DEC | 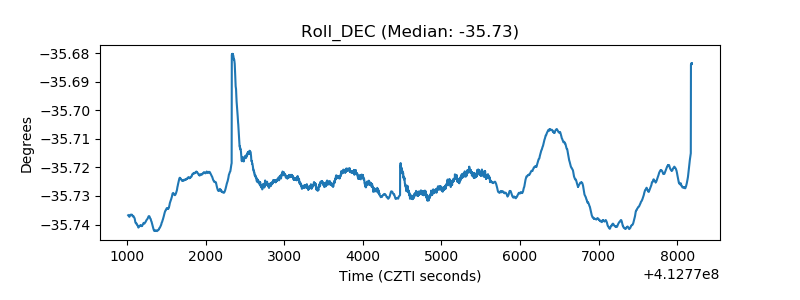 |
| _Roll_RA | 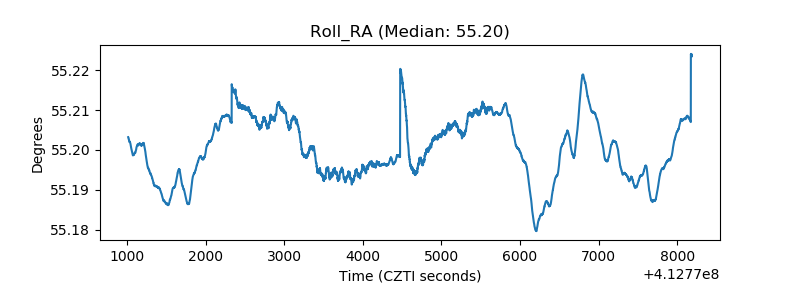 |
| Veto Counter | 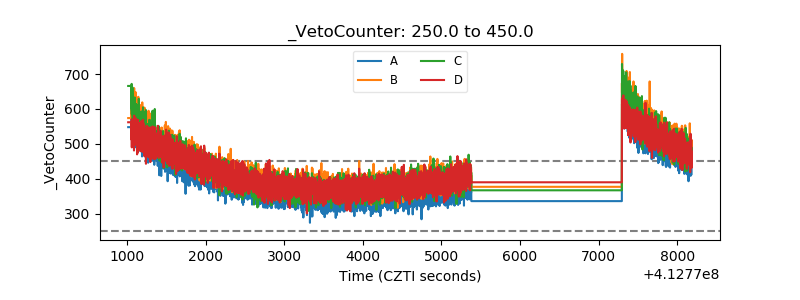 |