| Param | Original file | Final file |
|---|---|---|
| Filename | modeM0/AS1A12_051T01_9000005490_39692cztM0_level2.fits | modeM0/AS1A12_051T01_9000005490_39692cztM0_level2_quad_clean.evt |
| Size (bytes) | 566,570,880 | 89,856,000 |
| Size | 540.3 MB | 85.7 MB |
| Events in quadrant A | 9,390,313 | 381,970 |
| Events in quadrant B | 3,004,753 | 707,649 |
| Events in quadrant C | 5,000,486 | 638,158 |
| Events in quadrant D | 3,163,241 | 619,550 |
| Mode M9 | |||
|---|---|---|---|
| Quadrant | BADHDUFLAG | Total packets | Discarded packets |
| A | 0 | 21 | 0 |
| B | 0 | 21 | 0 |
| C | 0 | 21 | 0 |
| D | 0 | 22 | 0 |
| Mode M0 | |||
|---|---|---|---|
| Quadrant | BADHDUFLAG | Total packets | Discarded packets |
| A | 0 | 31587 | 3 |
| B | 0 | 12327 | 2 |
| C | 0 | 18539 | 2 |
| D | 0 | 13002 | 2 |
| Mode SS | |||
|---|---|---|---|
| Quadrant | BADHDUFLAG | Total packets | Discarded packets |
| A | 0 | 110 | 0 |
| B | 0 | 110 | 0 |
| C | 0 | 110 | 0 |
| D | 0 | 110 | 0 |
| Quadrant | Total seconds | Saturated seconds | Saturation percentage |
|---|---|---|---|
| A | 5329 | 2734 | 51.304185% |
| B | 5329 | 83 | 1.557515% |
| C | 5329 | 332 | 6.230062% |
| D | 5329 | 81 | 1.519985% |
Noise dominated data is calculated using 1-second bins in cleaned event files. If a bin has >2000 counts, and if more than 50% of those come from <1% of pixels, then it is considered to be noise-dominated and hence unusable.
| Quadrant | # 1 sec bins | Bins with >0 counts | Bins with >2000 counts | High rate bins dominated by noise | Noise dominated (total time) | Noise dominated (detector-on time) | Marked lightcurve |
|---|---|---|---|---|---|---|---|
| A | 7362 | 5330 | 2241 | 2241 | 30.44% | 42.05% | 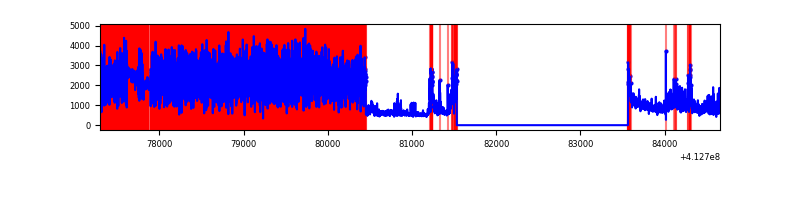 |
| B | 7362 | 5330 | 58 | 58 | 0.79% | 1.09% | 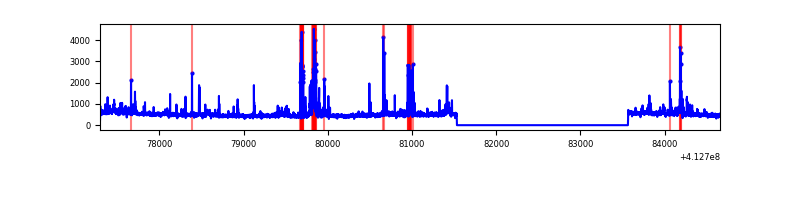 |
| C | 7362 | 5330 | 294 | 294 | 3.99% | 5.52% | 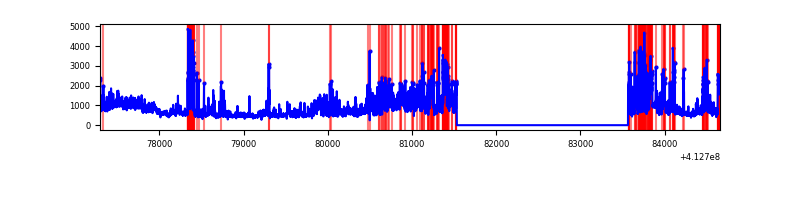 |
| D | 7362 | 5330 | 68 | 68 | 0.92% | 1.28% | 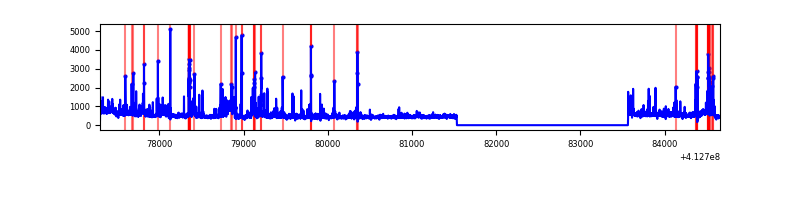 |
Top three noisy pixels from each quadrant. If the there are fewer than three noisy pixels in the level2.evt file, extra rows are filled as -1
| Pixel properties | Quadrant properties | ||||||
|---|---|---|---|---|---|---|---|
| Quadrant | DetID | PixID | Counts | Sigma | Mean | Median | Sigma |
| A | 15 | 222 | 5830668 | 55957.03 | 516 | 508 | 104.2 |
| A | 0 | 8 | 648681 | 6221.07 | 516 | 508 | 104.2 |
| A | 15 | 174 | 494109 | 4737.51 | 516 | 508 | 104.2 |
| B | 5 | 172 | 262310 | 2165.28 | 636 | 621 | 120.9 |
| B | 5 | 255 | 129788 | 1068.76 | 636 | 621 | 120.9 |
| B | 10 | 246 | 64351 | 527.32 | 636 | 621 | 120.9 |
| C | 15 | 208 | 1833646 | 13296.11 | 598 | 601 | 137.9 |
| C | 9 | 187 | 548775 | 3976.21 | 598 | 601 | 137.9 |
| C | 15 | 214 | 217267 | 1571.6 | 598 | 601 | 137.9 |
| D | 13 | 249 | 189777 | 1244.9 | 618 | 600 | 152.0 |
| D | 12 | 227 | 168027 | 1101.77 | 618 | 600 | 152.0 |
| D | 12 | 233 | 119792 | 784.35 | 618 | 600 | 152.0 |
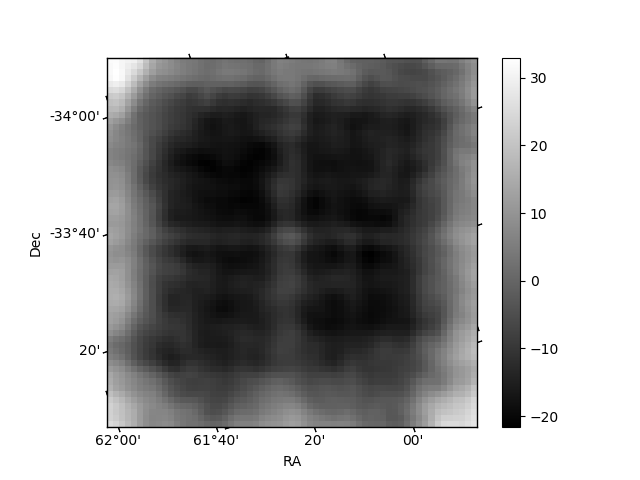
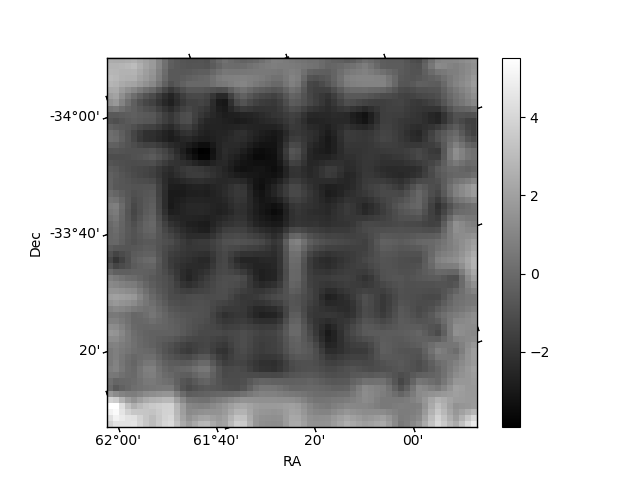
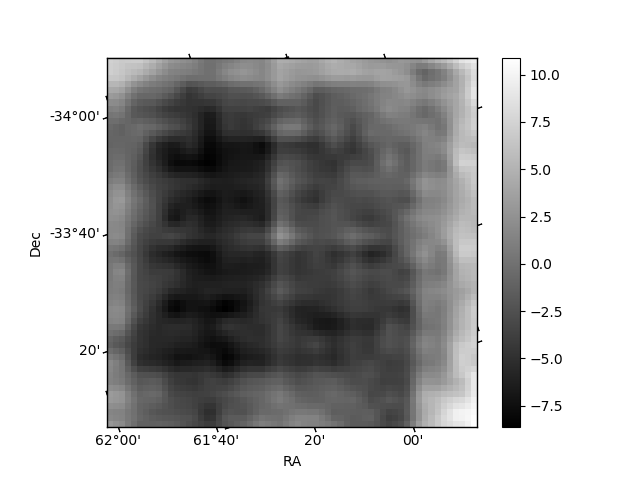
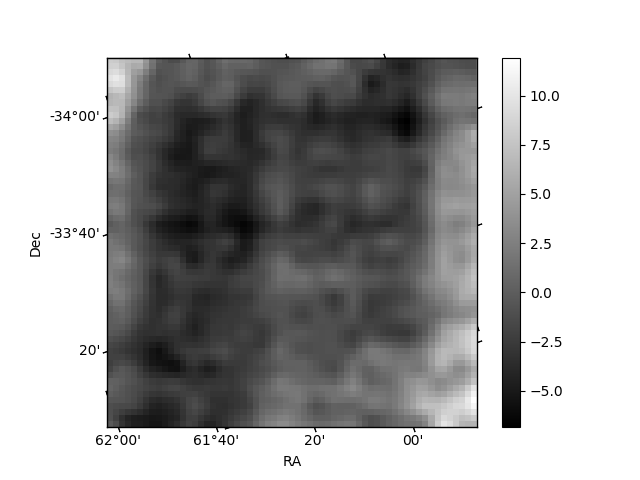
Histogram calculated using DETX and DETY for each event in the final _common_clean file
| Quadrant A | 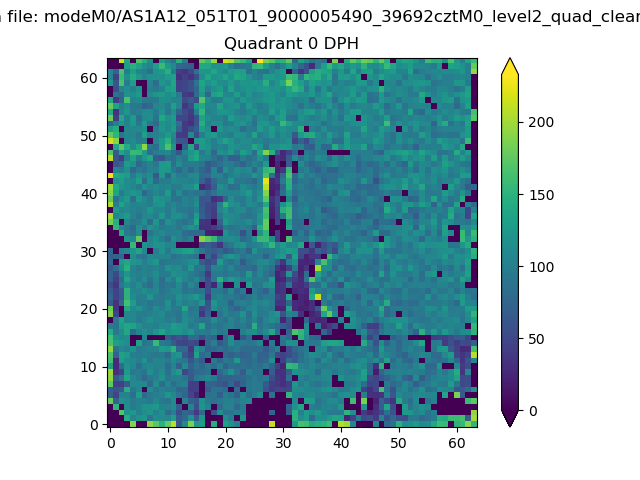 |
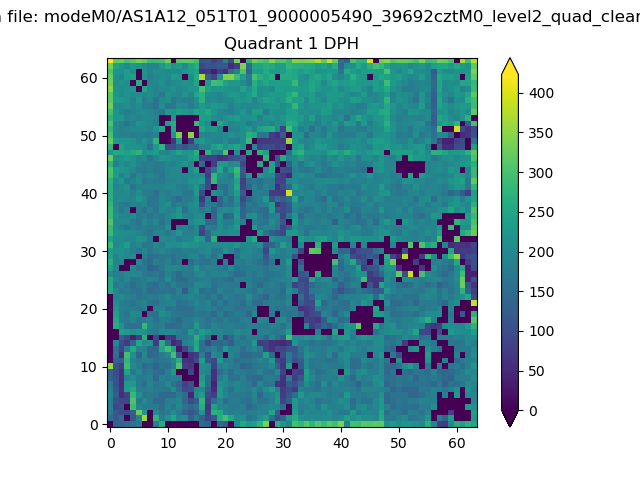 |
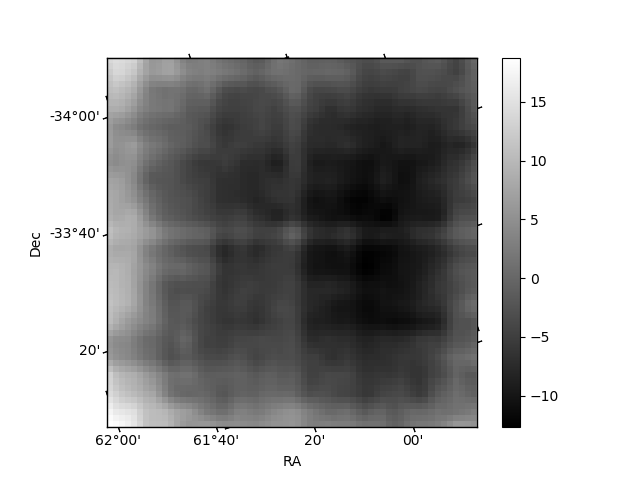
Quadrant B |
|---|---|---|---|
| Quadrant D | 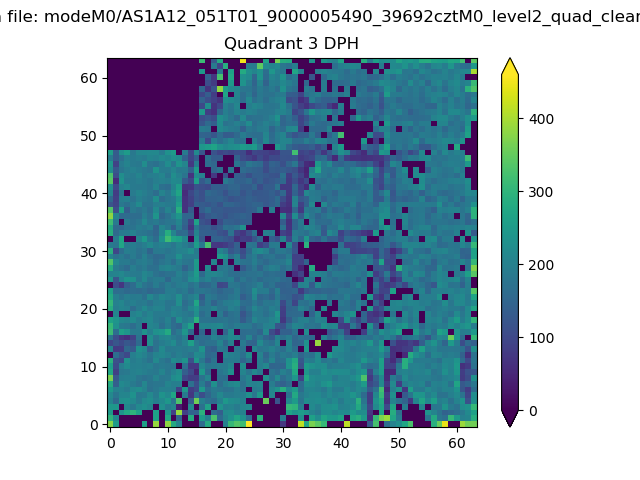 |
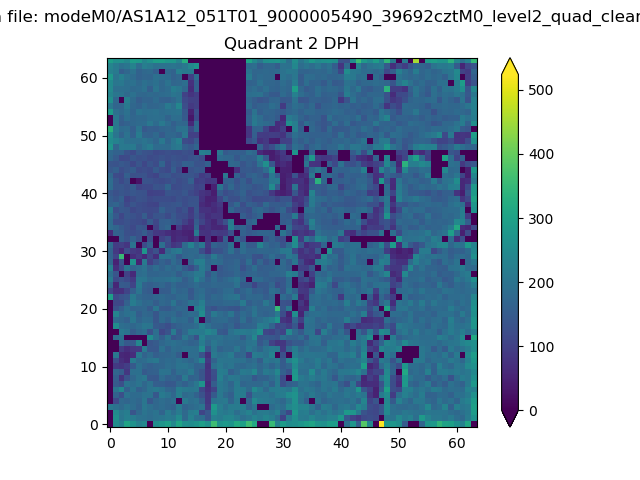 |
Quadrant C |
| Plot type | Count rate plots | Images |
|---|---|---|
| Comparison with Poisson distribution Blue bars denote a histogram of data divided into 1 sec bins. Red curve is a Poisson curve with rate = median count rate of data. |
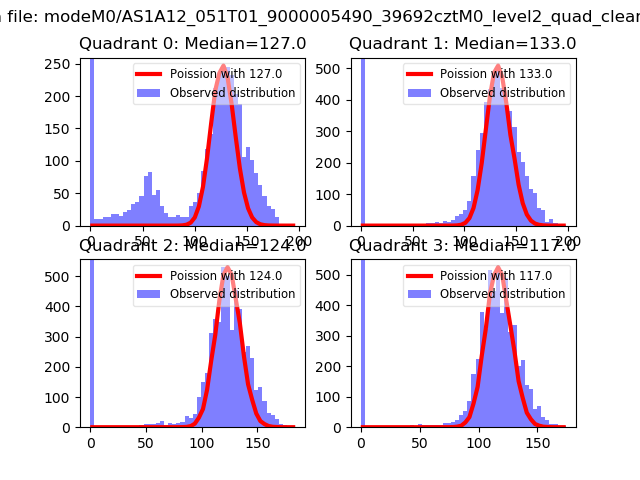 |
 |
| Quadrant-wise count rates Data is divided into 100 sec bins |
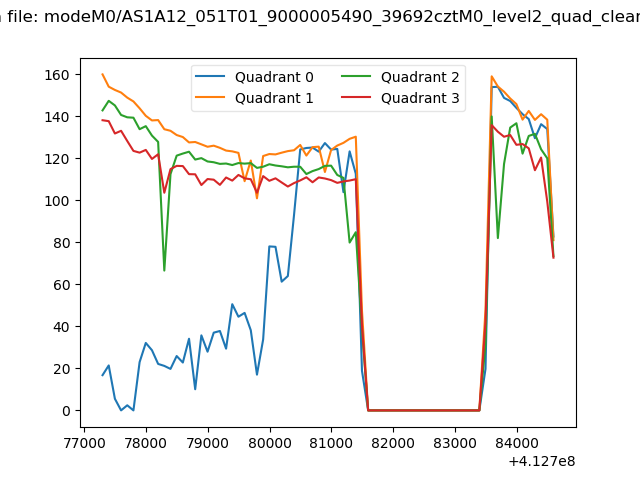 |
|
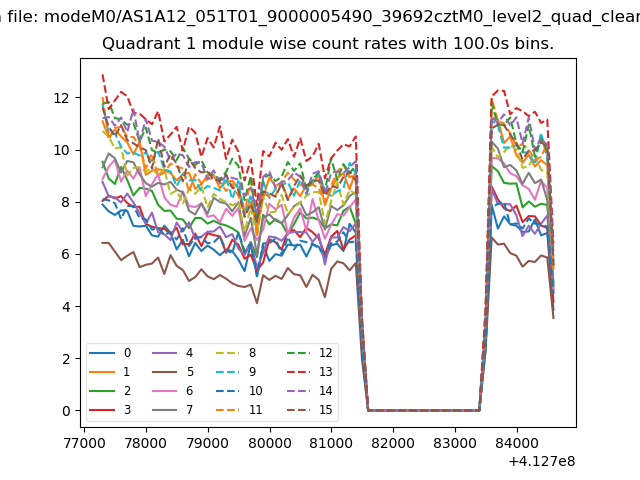
| Module-wise count rates for Quadrant A Data is divided into 100 sec bins |
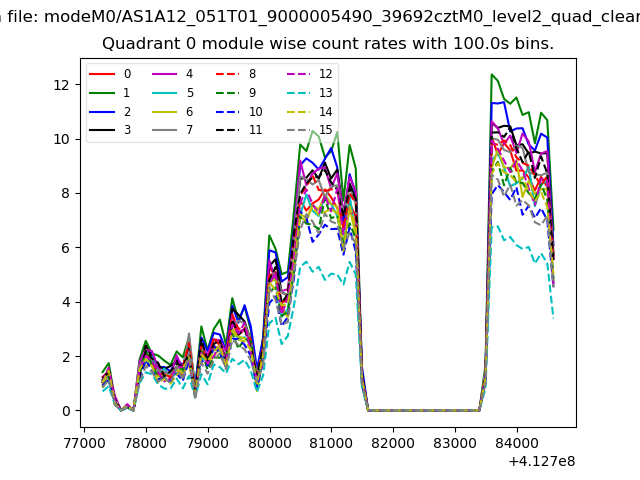 |
 |
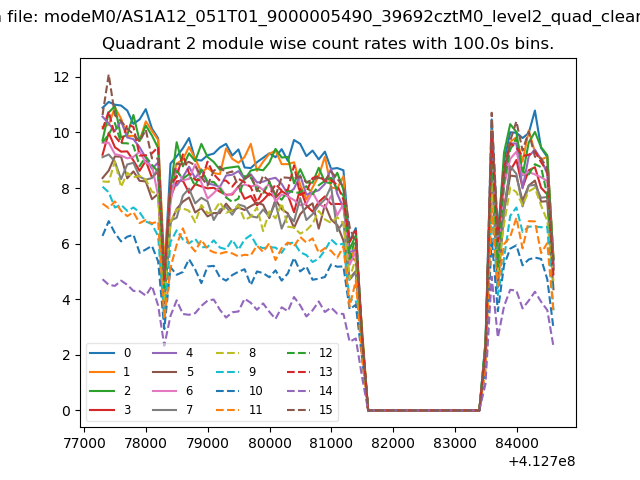
| Module-wise count rates for Quadrant B Data is divided into 100 sec bins |
 |
 |
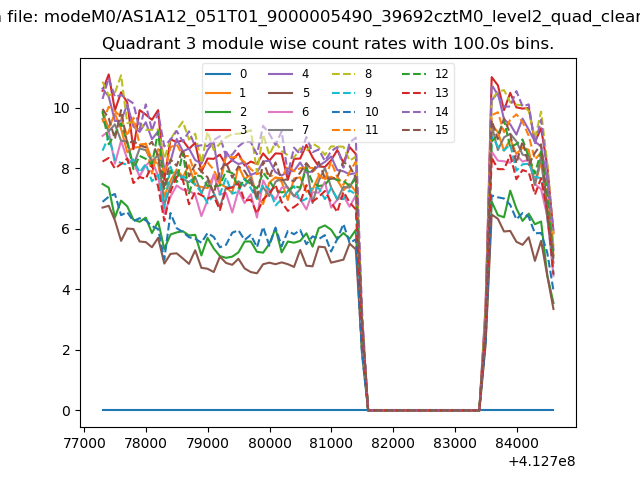
| Module-wise count rates for Quadrant C Data is divided into 100 sec bins |
 |
 |
| Module-wise count rates for Quadrant D Data is divided into 100 sec bins |
 |
 |
| Parameter | Plot |
|---|---|
| CZT HV Monitor | 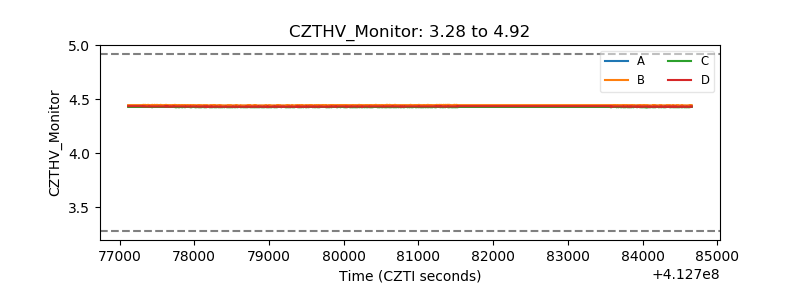 |
| D_VDD | 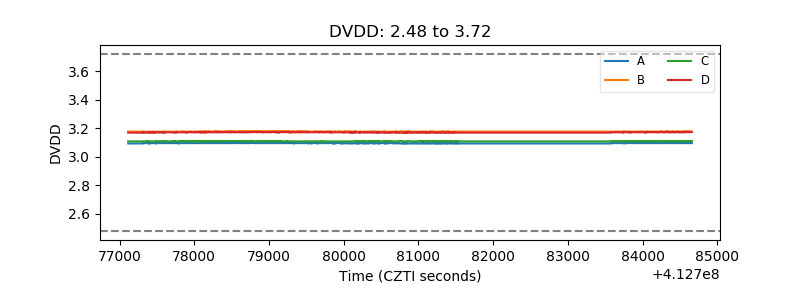 |
| Temperature 1 | 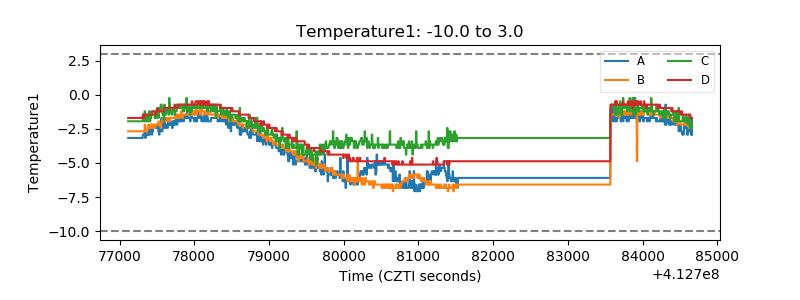 |
| Veto HV Monitor | 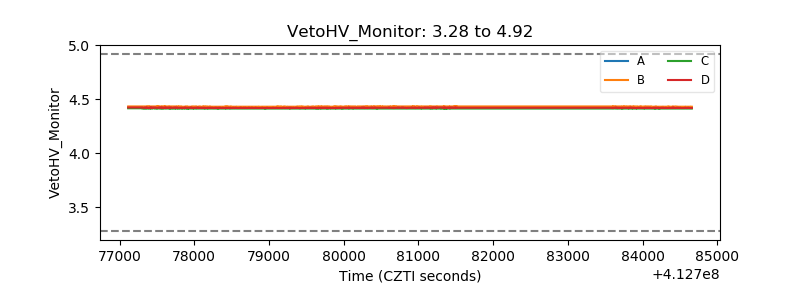 |
| Veto LLD | 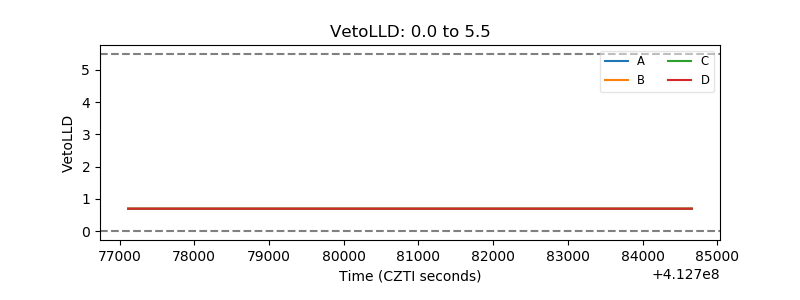 |
| Alpha Counter | 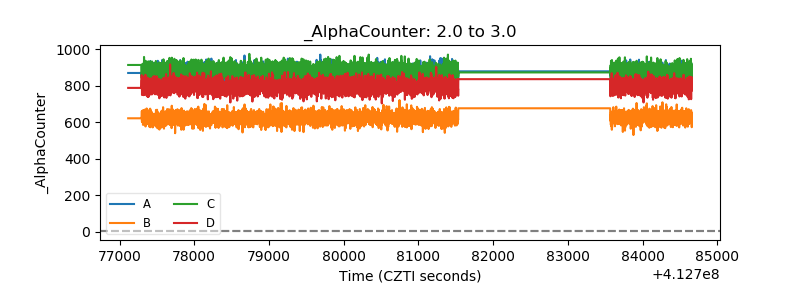 |
| _CPM_Rate | 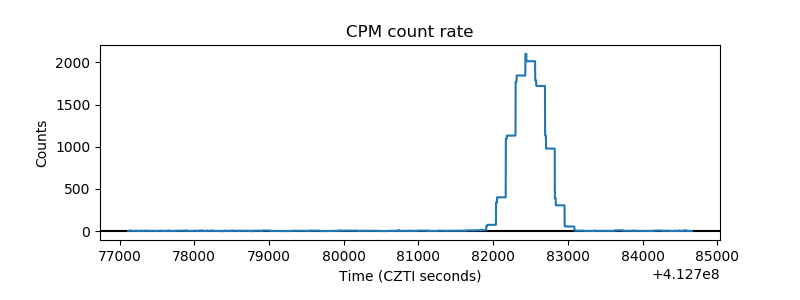 |
| CZT Counter | 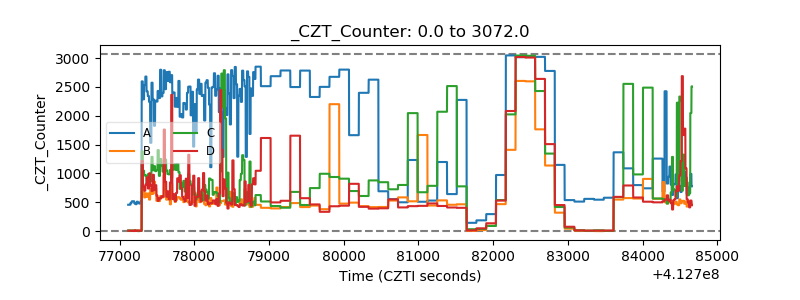 |
| +2.5 Volts monitor | 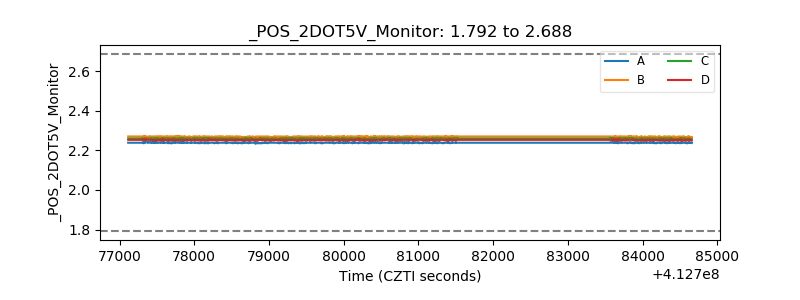 |
| +5 Volts monitor | 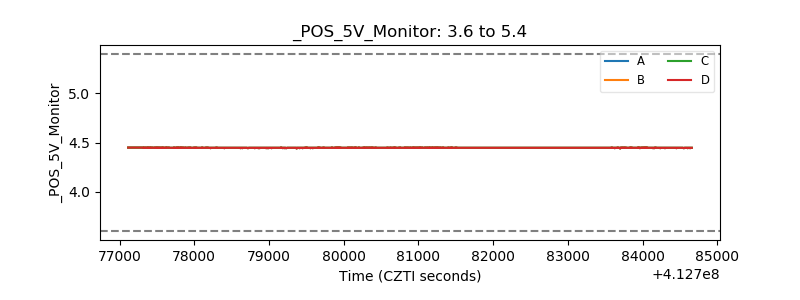 |
| _ROLL_ROT | 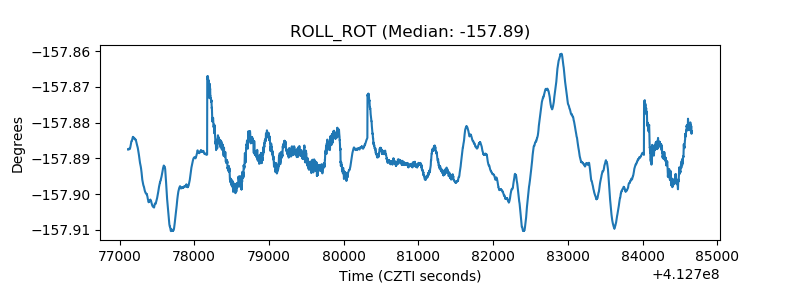 |
| _Roll_DEC | 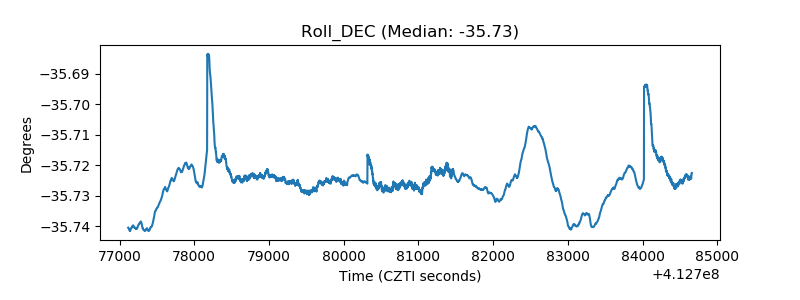 |
| _Roll_RA | 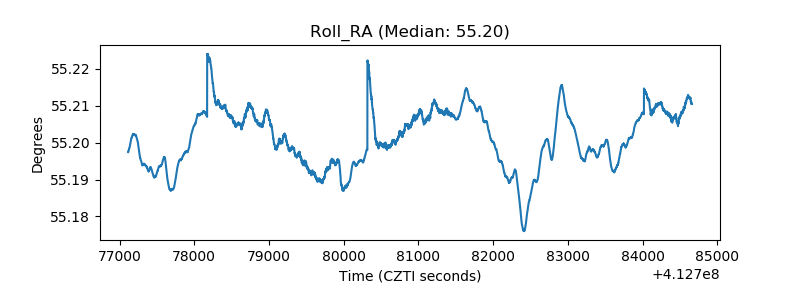 |
| Veto Counter | 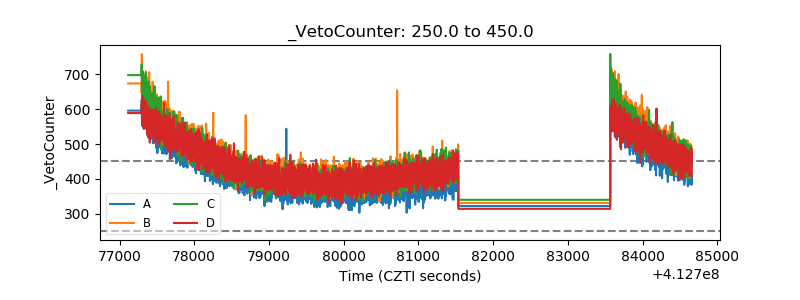 |