| Param | Original file | Final file |
|---|---|---|
| Filename | modeM0/AS1A12_051T01_9000005490_39693cztM0_level2.fits | modeM0/AS1A12_051T01_9000005490_39693cztM0_level2_quad_clean.evt |
| Size (bytes) | 502,963,200 | 92,836,800 |
| Size | 479.7 MB | 88.5 MB |
| Events in quadrant A | 7,683,453 | 560,036 |
| Events in quadrant B | 2,712,508 | 687,227 |
| Events in quadrant C | 5,024,914 | 606,250 |
| Events in quadrant D | 2,796,913 | 595,687 |
| Mode M9 | |||
|---|---|---|---|
| Quadrant | BADHDUFLAG | Total packets | Discarded packets |
| A | 0 | 23 | 0 |
| B | 0 | 23 | 0 |
| C | 0 | 23 | 0 |
| D | 0 | 24 | 0 |
| Mode M0 | |||
|---|---|---|---|
| Quadrant | BADHDUFLAG | Total packets | Discarded packets |
| A | 0 | 26420 | 3 |
| B | 0 | 11267 | 2 |
| C | 0 | 18583 | 2 |
| D | 0 | 11750 | 2 |
| Mode SS | |||
|---|---|---|---|
| Quadrant | BADHDUFLAG | Total packets | Discarded packets |
| A | 0 | 106 | 0 |
| B | 0 | 106 | 0 |
| C | 0 | 106 | 0 |
| D | 0 | 106 | 0 |
| Quadrant | Total seconds | Saturated seconds | Saturation percentage |
|---|---|---|---|
| A | 5162 | 1314 | 25.455250% |
| B | 5162 | 24 | 0.464936% |
| C | 5162 | 381 | 7.380860% |
| D | 5162 | 36 | 0.697404% |
Noise dominated data is calculated using 1-second bins in cleaned event files. If a bin has >2000 counts, and if more than 50% of those come from <1% of pixels, then it is considered to be noise-dominated and hence unusable.
| Quadrant | # 1 sec bins | Bins with >0 counts | Bins with >2000 counts | High rate bins dominated by noise | Noise dominated (total time) | Noise dominated (detector-on time) | Marked lightcurve |
|---|---|---|---|---|---|---|---|
| A | 7254 | 5163 | 1235 | 1235 | 17.03% | 23.92% | 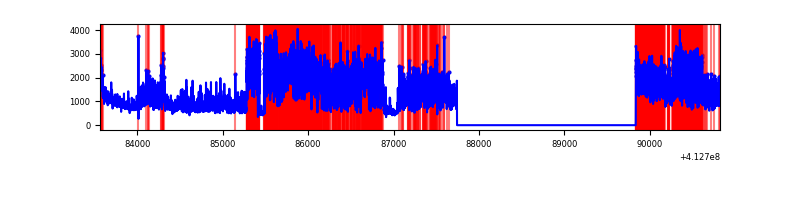 |
| B | 7254 | 5163 | 13 | 13 | 0.18% | 0.25% | 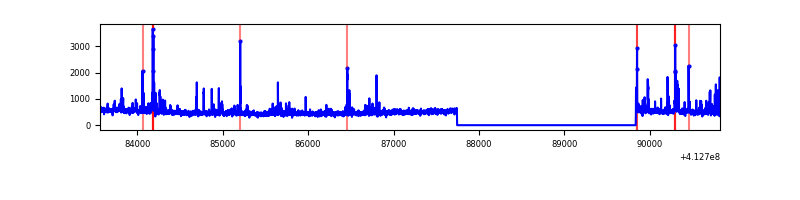 |
| C | 7254 | 5163 | 359 | 359 | 4.95% | 6.95% | 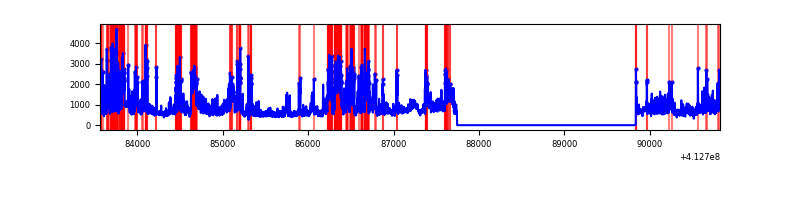 |
| D | 7254 | 5163 | 31 | 31 | 0.43% | 0.60% | 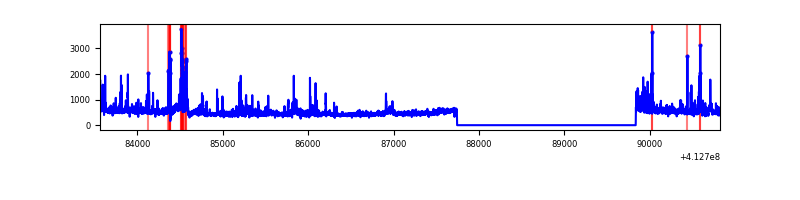 |
Top three noisy pixels from each quadrant. If the there are fewer than three noisy pixels in the level2.evt file, extra rows are filled as -1
| Pixel properties | Quadrant properties | ||||||
|---|---|---|---|---|---|---|---|
| Quadrant | DetID | PixID | Counts | Sigma | Mean | Median | Sigma |
| A | 15 | 222 | 4861384 | 41062.77 | 584 | 575 | 118.4 |
| A | 10 | 83 | 453057 | 3822.44 | 584 | 575 | 118.4 |
| A | 15 | 174 | 72486 | 607.48 | 584 | 575 | 118.4 |
| B | 5 | 172 | 157526 | 1352.8 | 612 | 598 | 116.0 |
| B | 5 | 32 | 51552 | 439.25 | 612 | 598 | 116.0 |
| B | 10 | 246 | 21978 | 184.31 | 612 | 598 | 116.0 |
| C | 15 | 208 | 1531941 | 11562.29 | 573 | 579 | 132.4 |
| C | 9 | 187 | 949553 | 7165.07 | 573 | 579 | 132.4 |
| C | 15 | 214 | 210845 | 1587.58 | 573 | 579 | 132.4 |
| D | 12 | 227 | 150820 | 1048.87 | 587 | 570 | 143.2 |
| D | 13 | 249 | 83577 | 579.46 | 587 | 570 | 143.2 |
| D | 2 | 250 | 70467 | 487.94 | 587 | 570 | 143.2 |
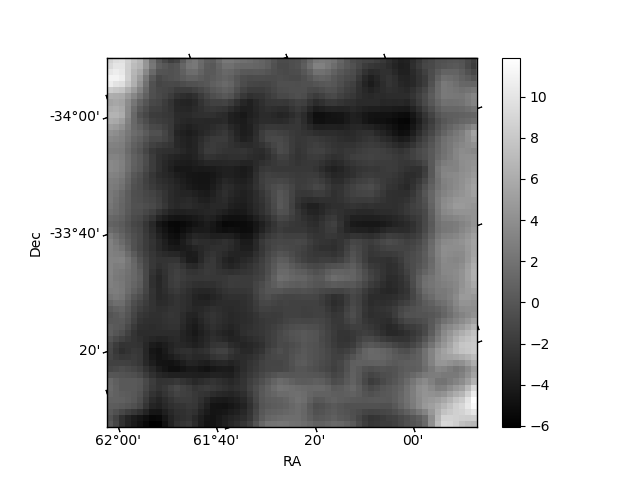
Histogram calculated using DETX and DETY for each event in the final _common_clean file
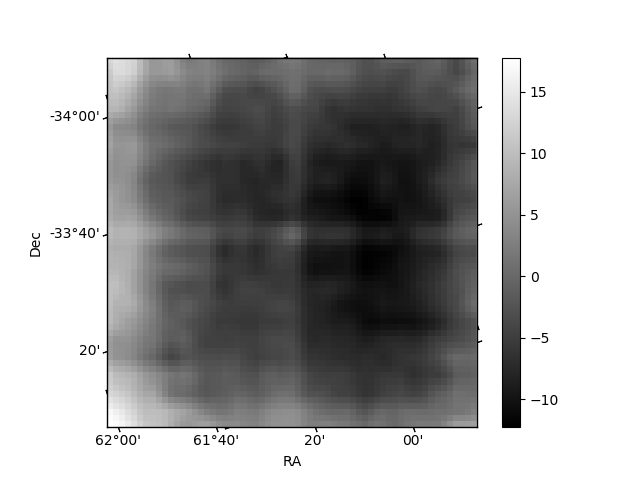
| Quadrant A | 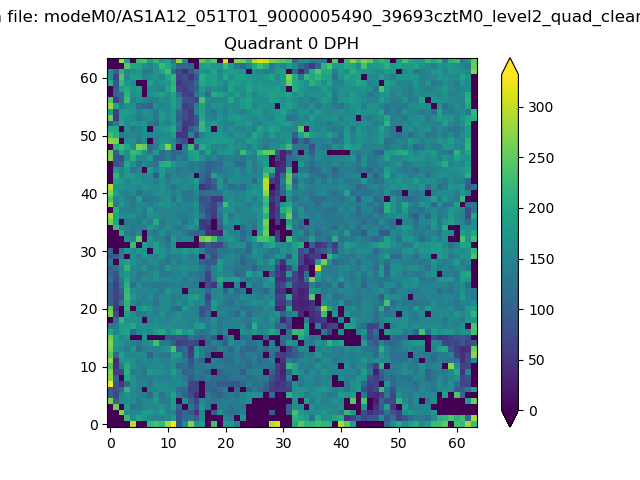 |
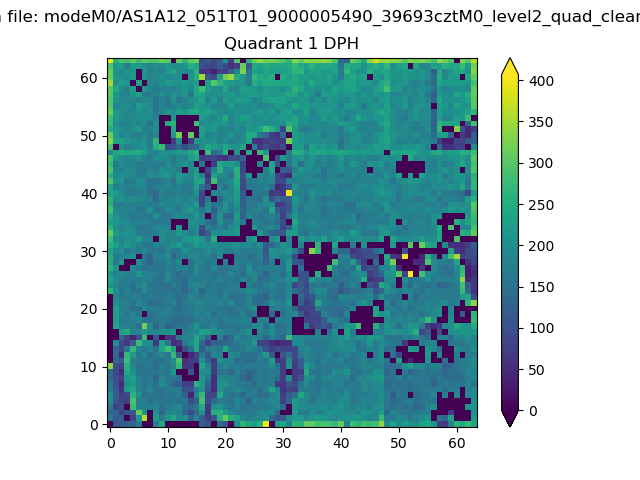 |
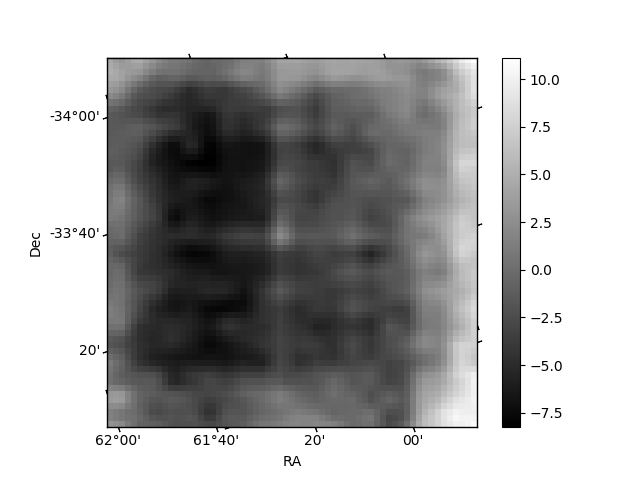
Quadrant B |
|---|---|---|---|
| Quadrant D | 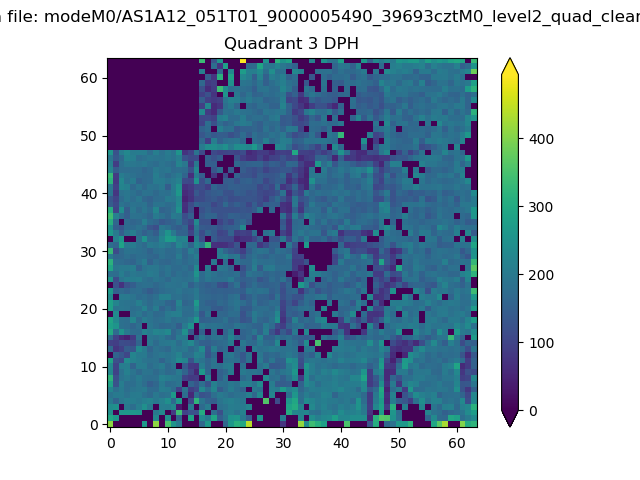 |
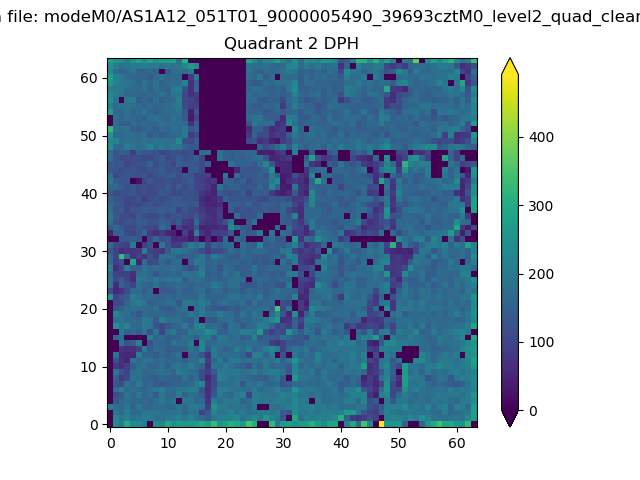 |
Quadrant C |
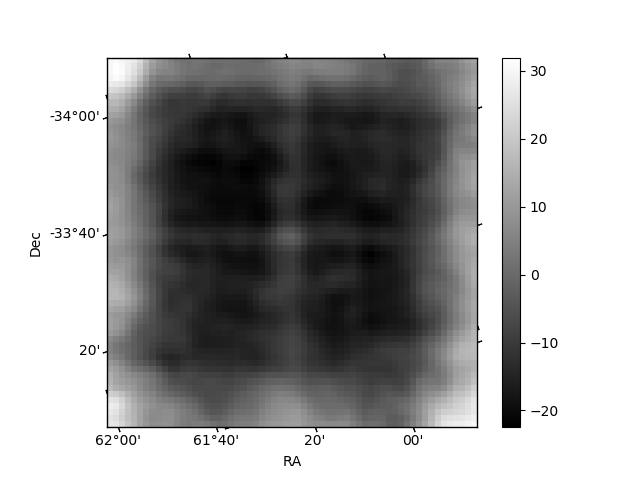
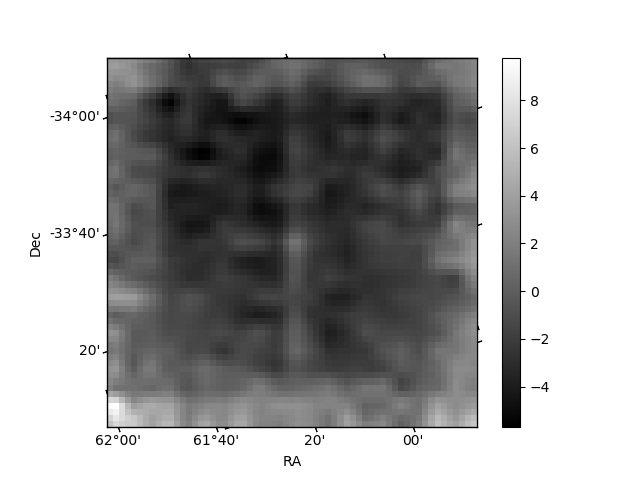
| Plot type | Count rate plots | Images |
|---|---|---|
| Comparison with Poisson distribution Blue bars denote a histogram of data divided into 1 sec bins. Red curve is a Poisson curve with rate = median count rate of data. |
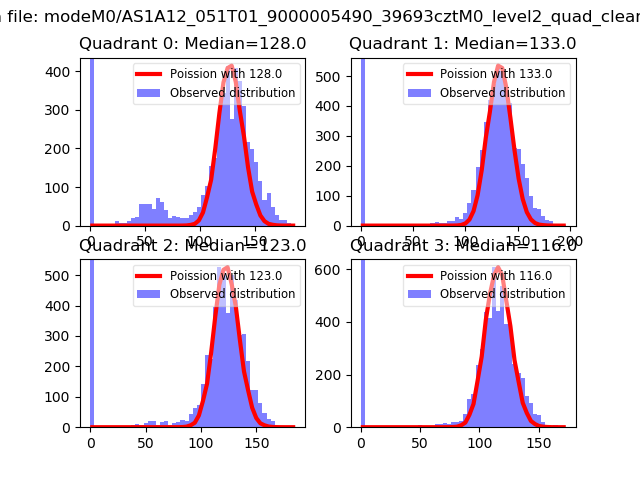 |
 |
| Quadrant-wise count rates Data is divided into 100 sec bins |
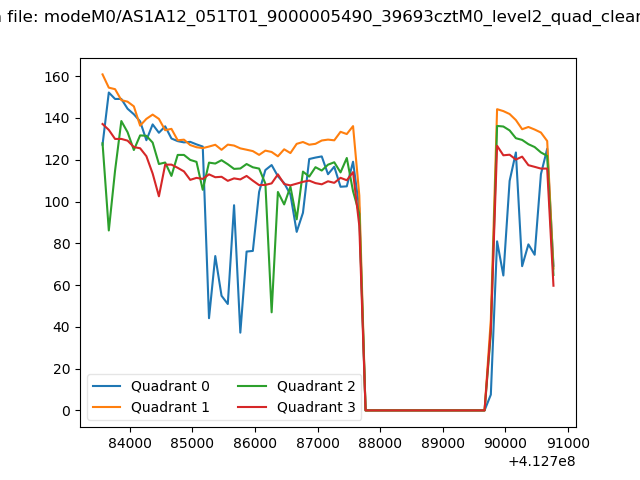 |
|
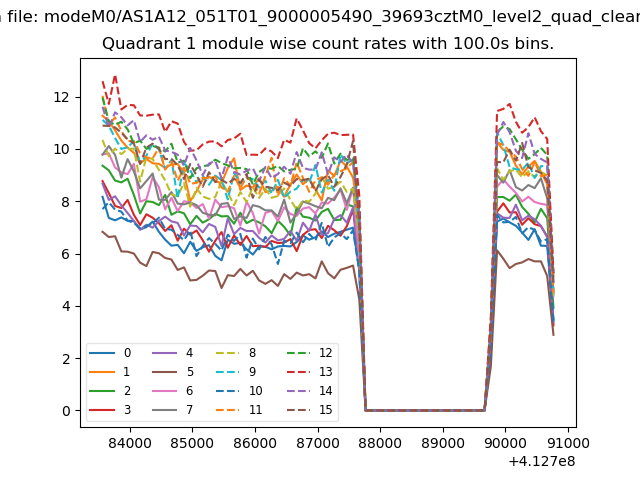
| Module-wise count rates for Quadrant A Data is divided into 100 sec bins |
 |
 |
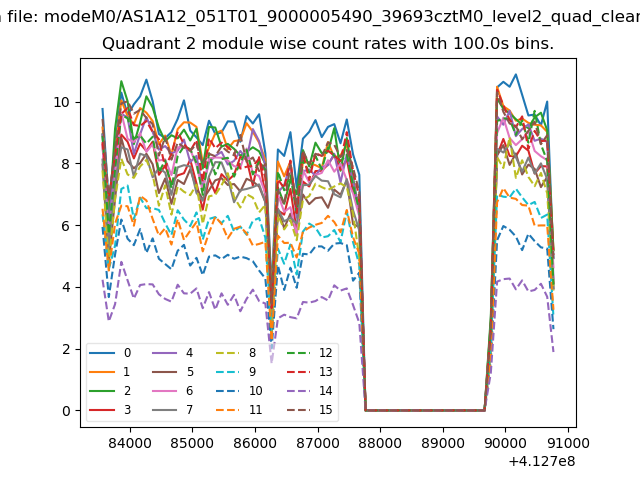
| Module-wise count rates for Quadrant B Data is divided into 100 sec bins |
 |
 |
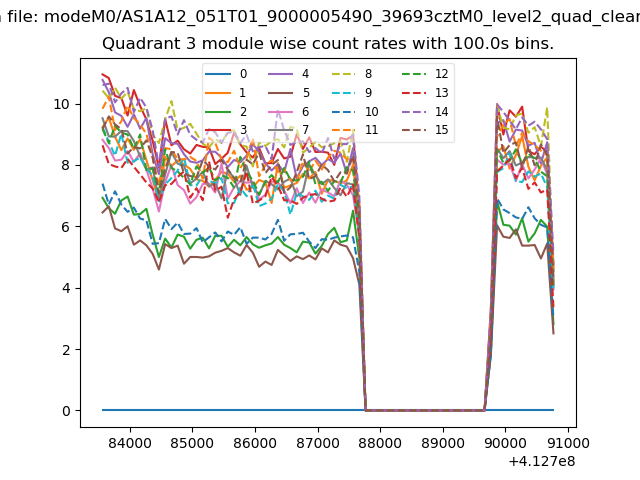
| Module-wise count rates for Quadrant C Data is divided into 100 sec bins |
 |
 |
| Module-wise count rates for Quadrant D Data is divided into 100 sec bins |
 |
 |
| Parameter | Plot |
|---|---|
| CZT HV Monitor | 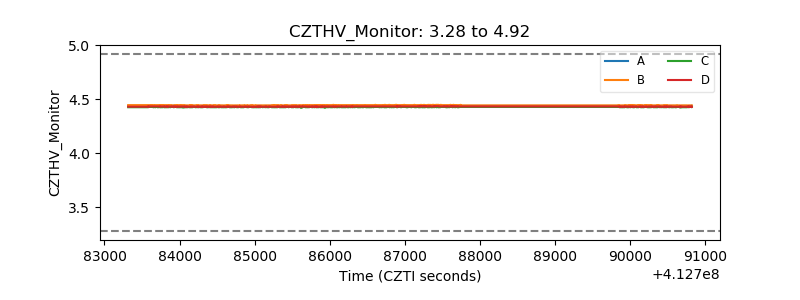 |
| D_VDD | 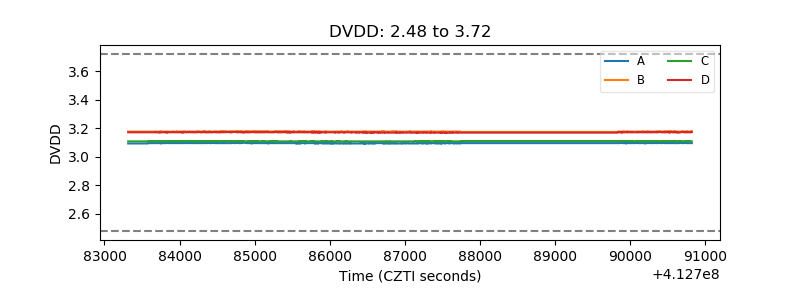 |
| Temperature 1 | 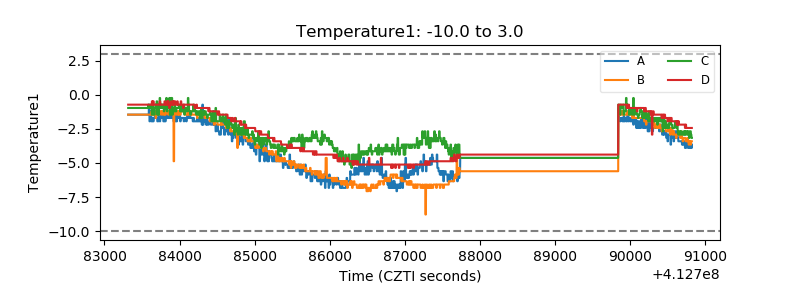 |
| Veto HV Monitor | 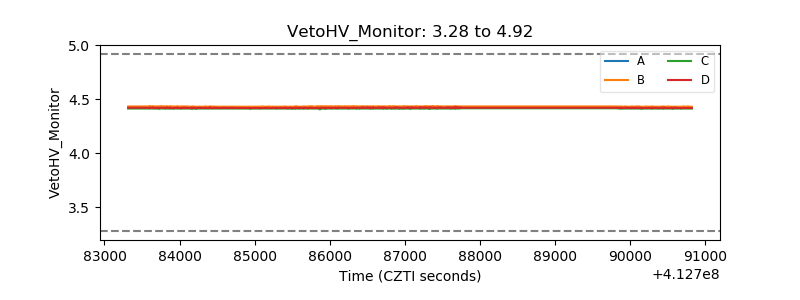 |
| Veto LLD | 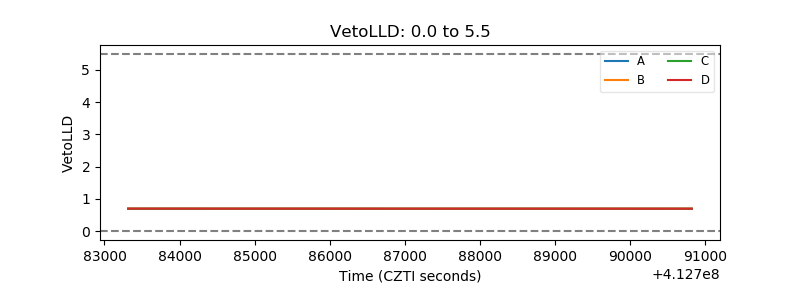 |
| Alpha Counter | 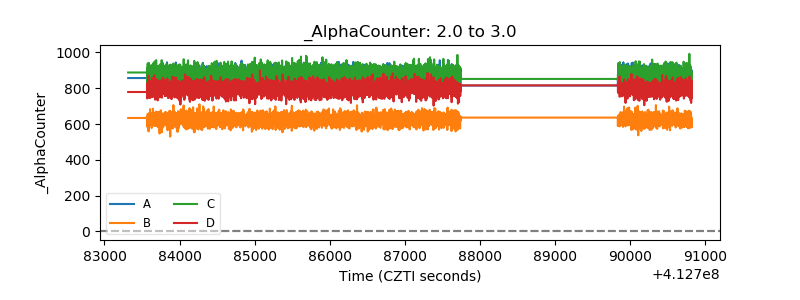 |
| _CPM_Rate | 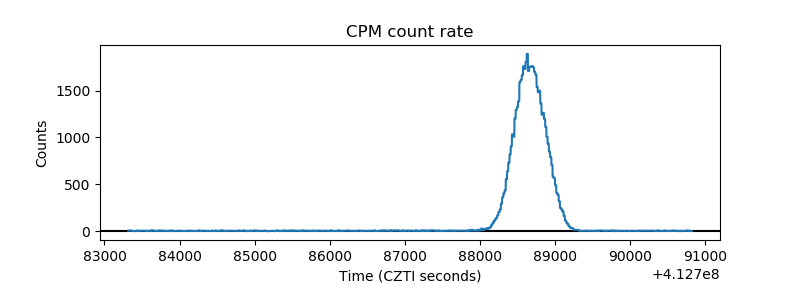 |
| CZT Counter | 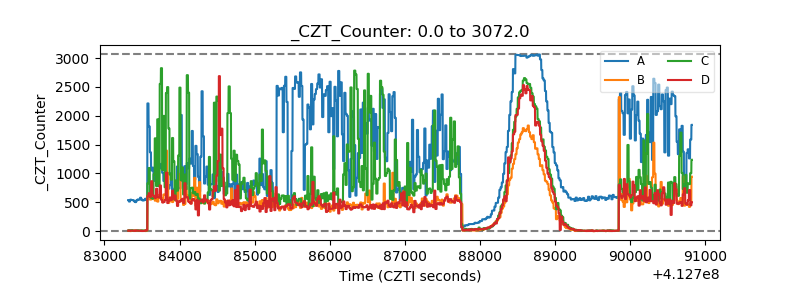 |
| +2.5 Volts monitor | 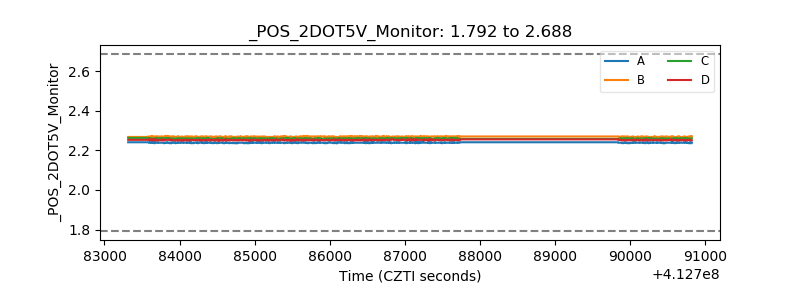 |
| +5 Volts monitor | 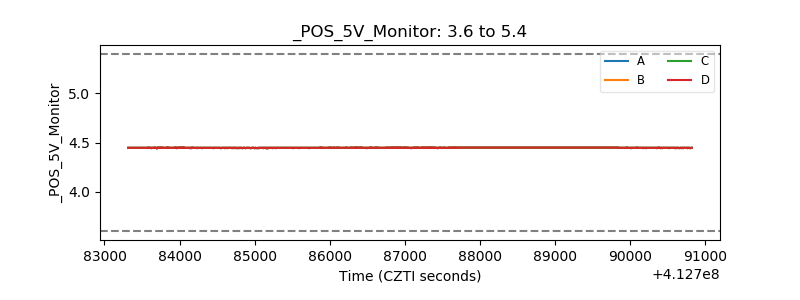 |
| _ROLL_ROT | 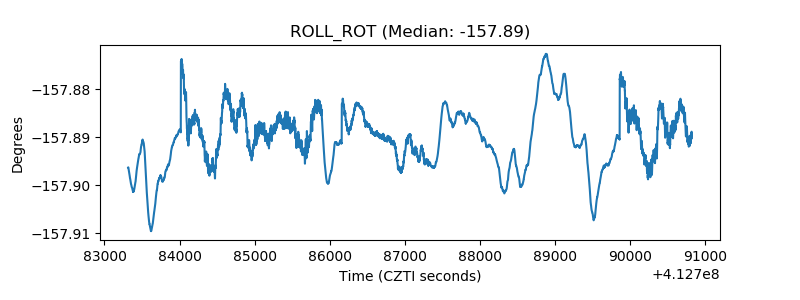 |
| _Roll_DEC | 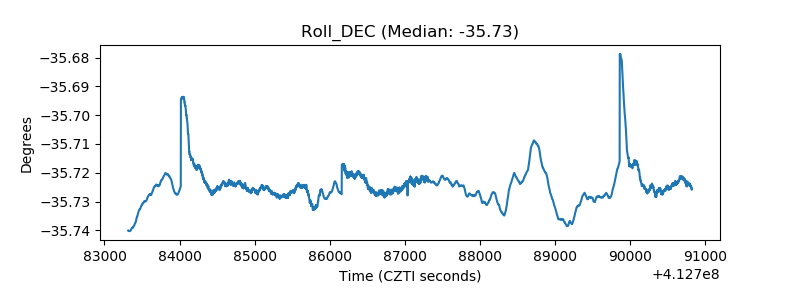 |
| _Roll_RA | 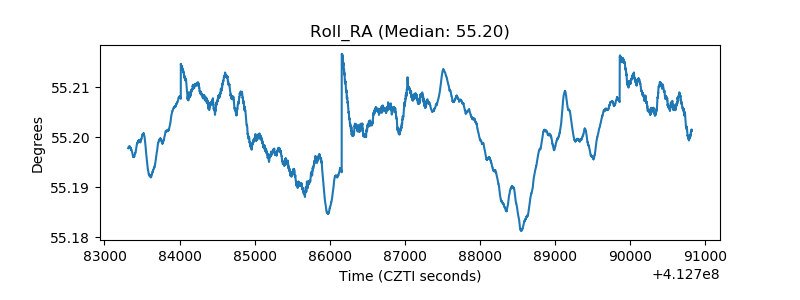 |
| Veto Counter | 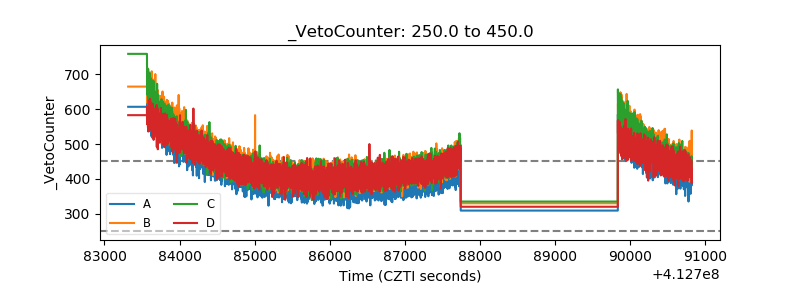 |