| Param | Original file | Final file |
|---|---|---|
| Filename | modeM0/AS1A12_051T01_9000005490_39694cztM0_level2.fits | modeM0/AS1A12_051T01_9000005490_39694cztM0_level2_quad_clean.evt |
| Size (bytes) | 479,479,680 | 86,158,080 |
| Size | 457.3 MB | 82.2 MB |
| Events in quadrant A | 7,343,401 | 510,343 |
| Events in quadrant B | 2,557,543 | 634,439 |
| Events in quadrant C | 4,583,529 | 569,180 |
| Events in quadrant D | 2,878,818 | 546,019 |
| Mode M9 | |||
|---|---|---|---|
| Quadrant | BADHDUFLAG | Total packets | Discarded packets |
| A | 0 | 21 | 0 |
| B | 0 | 21 | 0 |
| C | 0 | 21 | 0 |
| D | 0 | 22 | 0 |
| Mode M0 | |||
|---|---|---|---|
| Quadrant | BADHDUFLAG | Total packets | Discarded packets |
| A | 0 | 25272 | 3 |
| B | 0 | 10820 | 2 |
| C | 0 | 17049 | 2 |
| D | 0 | 12055 | 2 |
| Mode SS | |||
|---|---|---|---|
| Quadrant | BADHDUFLAG | Total packets | Discarded packets |
| A | 0 | 102 | 0 |
| B | 0 | 102 | 0 |
| C | 0 | 102 | 0 |
| D | 0 | 102 | 0 |
| Quadrant | Total seconds | Saturated seconds | Saturation percentage |
|---|---|---|---|
| A | 4973 | 1200 | 24.130304% |
| B | 4973 | 23 | 0.462497% |
| C | 4973 | 284 | 5.710839% |
| D | 4973 | 64 | 1.286950% |
Noise dominated data is calculated using 1-second bins in cleaned event files. If a bin has >2000 counts, and if more than 50% of those come from <1% of pixels, then it is considered to be noise-dominated and hence unusable.
| Quadrant | # 1 sec bins | Bins with >0 counts | Bins with >2000 counts | High rate bins dominated by noise | Noise dominated (total time) | Noise dominated (detector-on time) | Marked lightcurve |
|---|---|---|---|---|---|---|---|
| A | 7095 | 4974 | 1032 | 1032 | 14.55% | 20.75% | 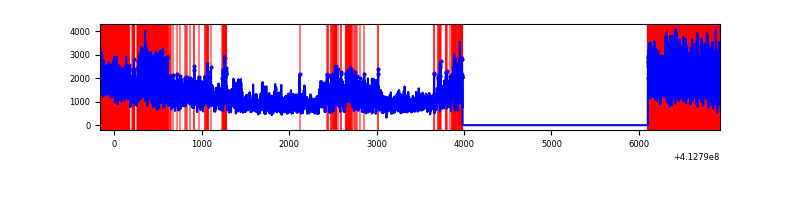 |
| B | 7095 | 4974 | 12 | 12 | 0.17% | 0.24% | 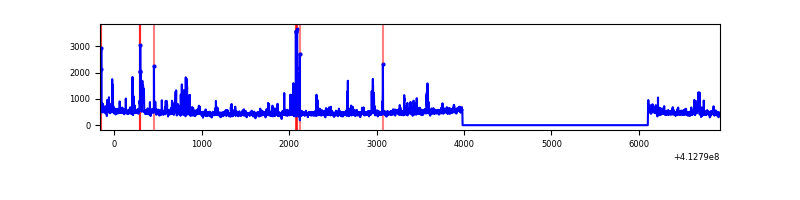 |
| C | 7095 | 4974 | 321 | 321 | 4.52% | 6.45% | 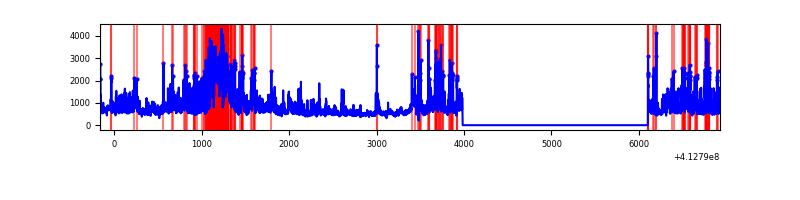 |
| D | 7095 | 4974 | 58 | 58 | 0.82% | 1.17% | 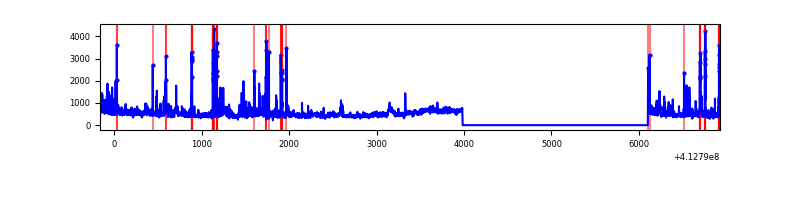 |
Top three noisy pixels from each quadrant. If the there are fewer than three noisy pixels in the level2.evt file, extra rows are filled as -1
| Pixel properties | Quadrant properties | ||||||
|---|---|---|---|---|---|---|---|
| Quadrant | DetID | PixID | Counts | Sigma | Mean | Median | Sigma |
| A | 15 | 222 | 4789145 | 43943.28 | 535 | 526 | 109.0 |
| A | 10 | 83 | 413715 | 3791.67 | 535 | 526 | 109.0 |
| A | 15 | 174 | 55523 | 504.69 | 535 | 526 | 109.0 |
| B | 5 | 172 | 149836 | 1369.67 | 571 | 556 | 109.0 |
| B | 5 | 32 | 59425 | 540.13 | 571 | 556 | 109.0 |
| B | 5 | 255 | 56247 | 510.97 | 571 | 556 | 109.0 |
| C | 9 | 187 | 1382566 | 10959.64 | 538 | 543 | 126.1 |
| C | 15 | 208 | 799198 | 6333.45 | 538 | 543 | 126.1 |
| C | 15 | 214 | 202319 | 1600.11 | 538 | 543 | 126.1 |
| D | 13 | 249 | 168664 | 1280.42 | 544 | 530 | 131.3 |
| D | 12 | 218 | 134211 | 1018.04 | 544 | 530 | 131.3 |
| D | 2 | 153 | 116436 | 882.68 | 544 | 530 | 131.3 |
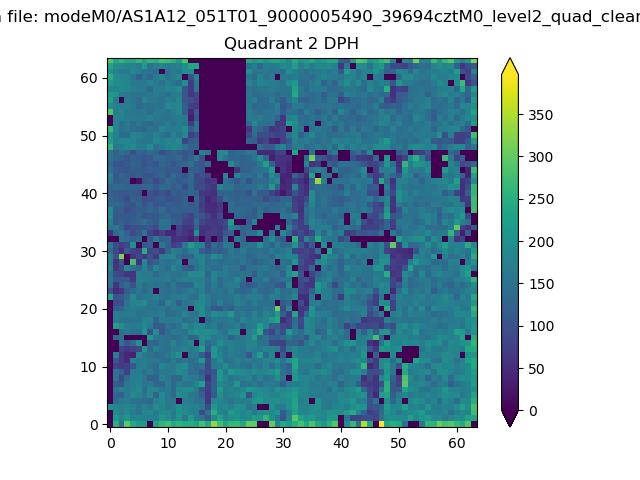
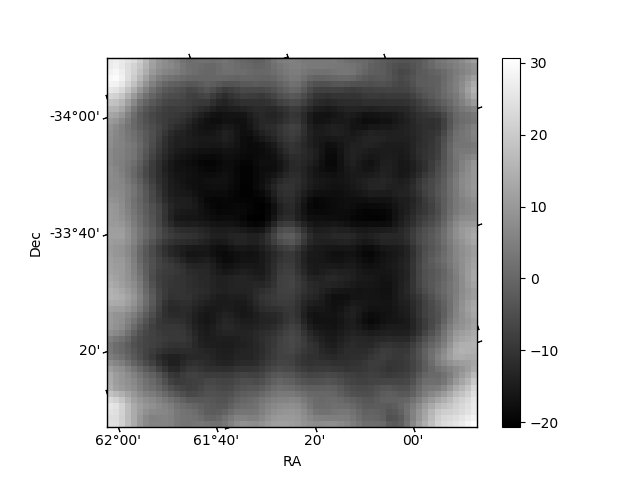
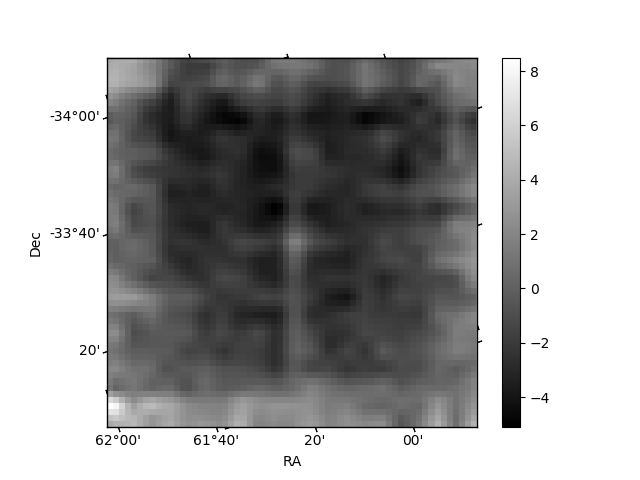
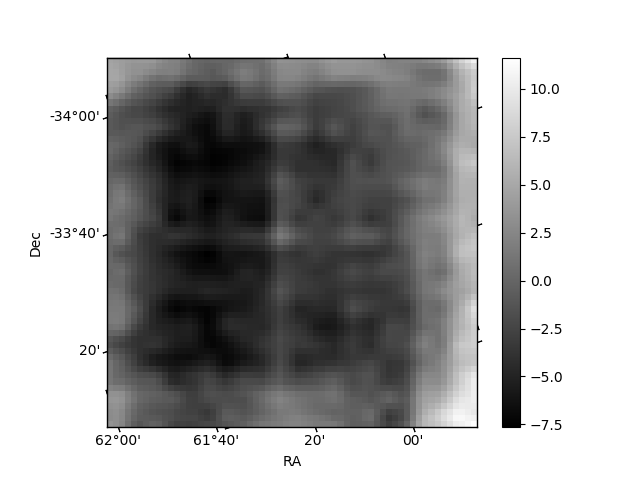
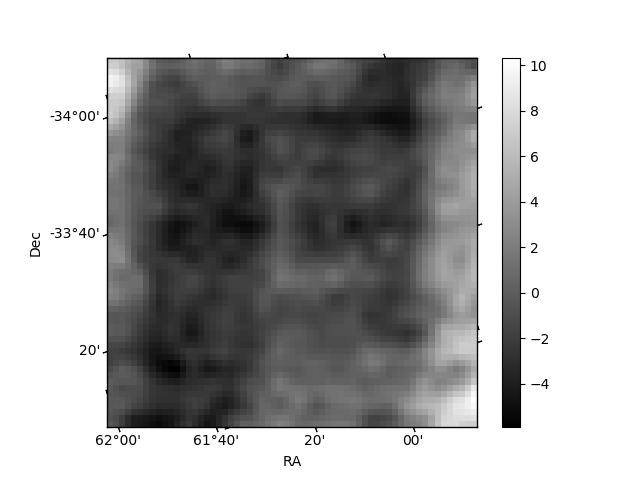
Histogram calculated using DETX and DETY for each event in the final _common_clean file
| Quadrant A | 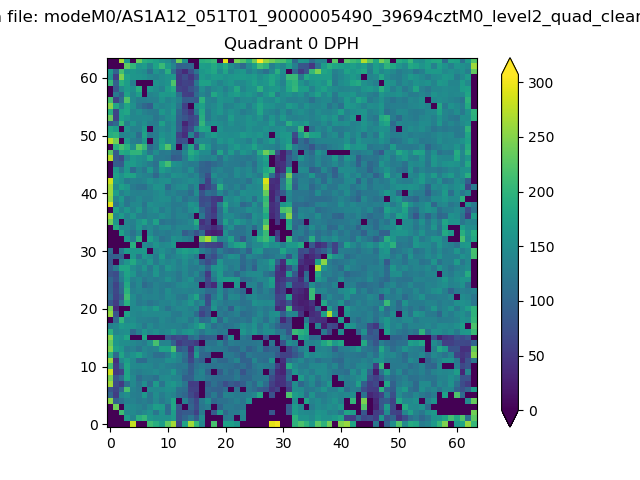 |
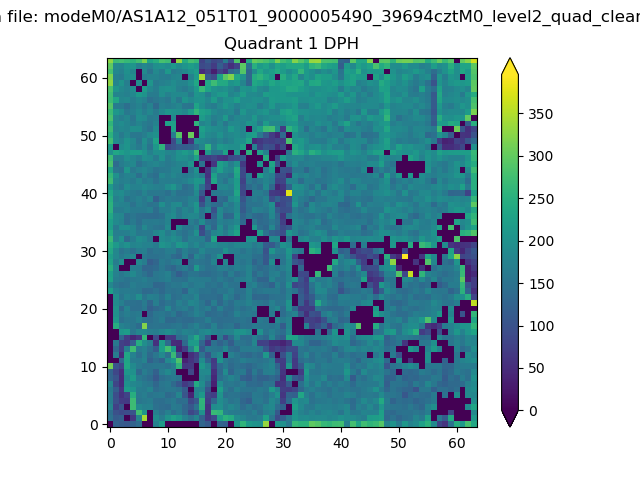 |
Quadrant B |
|---|---|---|---|
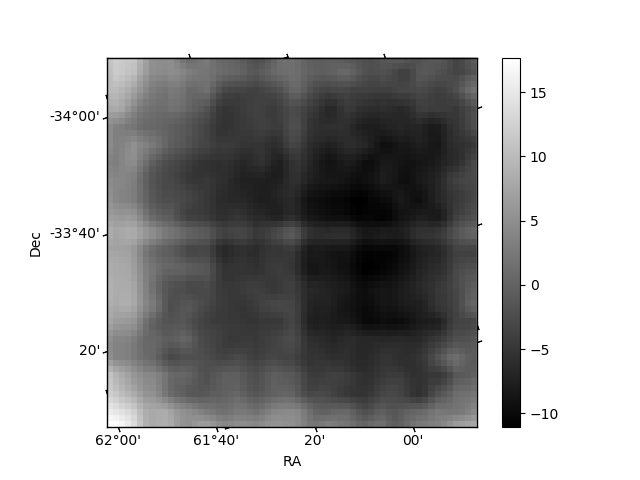
| Quadrant D | 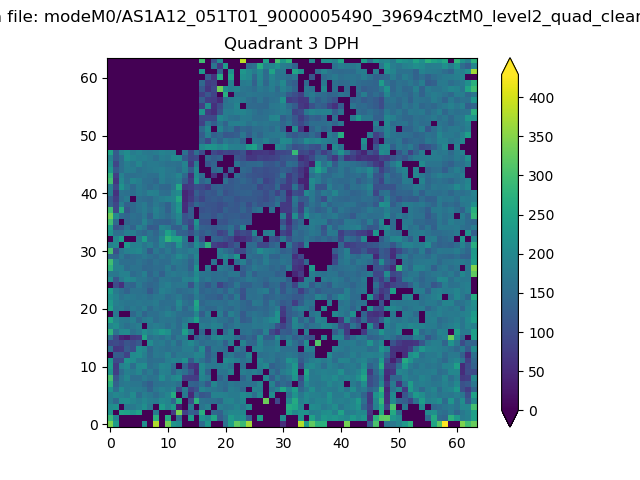 |
 |
Quadrant C |
| Plot type | Count rate plots | Images |
|---|---|---|
| Comparison with Poisson distribution Blue bars denote a histogram of data divided into 1 sec bins. Red curve is a Poisson curve with rate = median count rate of data. |
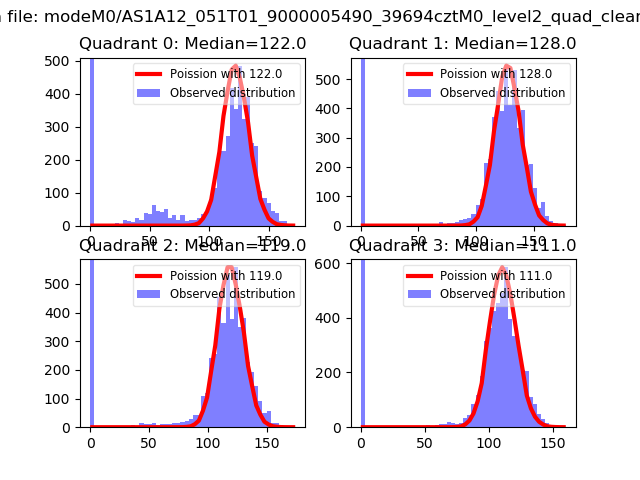 |
 |
| Quadrant-wise count rates Data is divided into 100 sec bins |
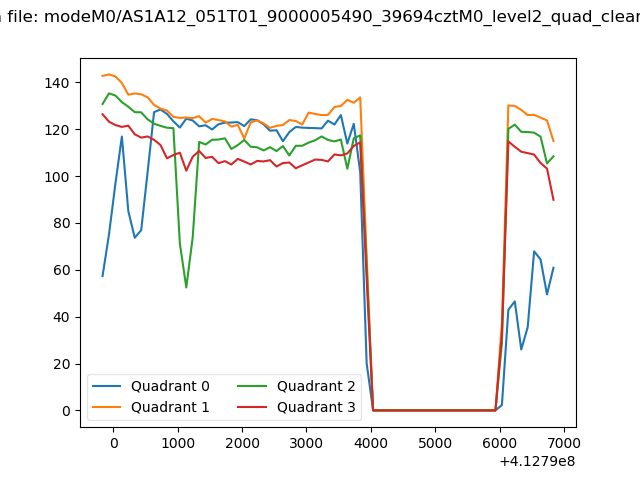 |
|
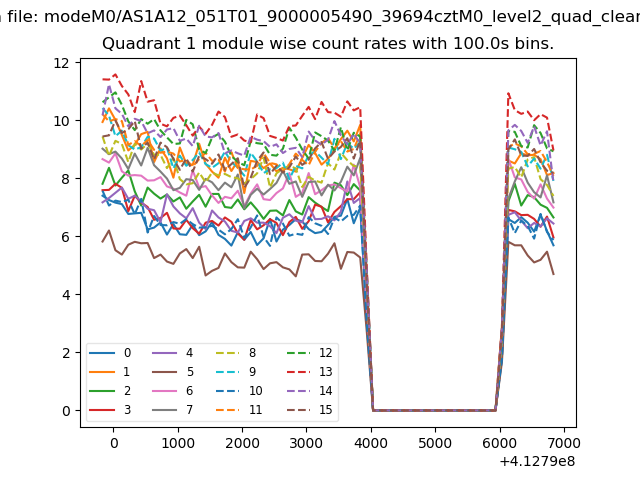
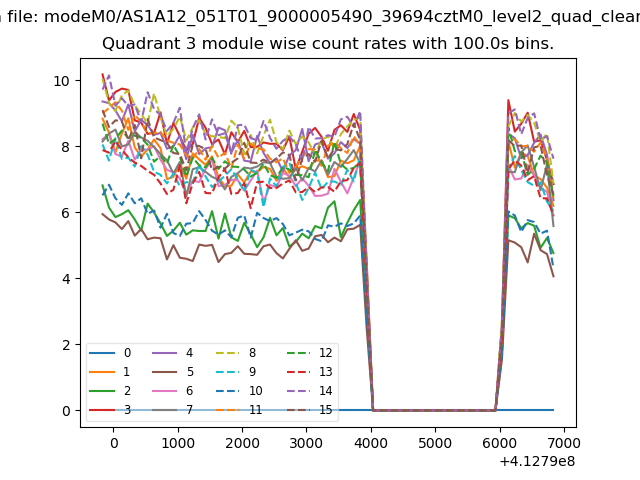
| Module-wise count rates for Quadrant A Data is divided into 100 sec bins |
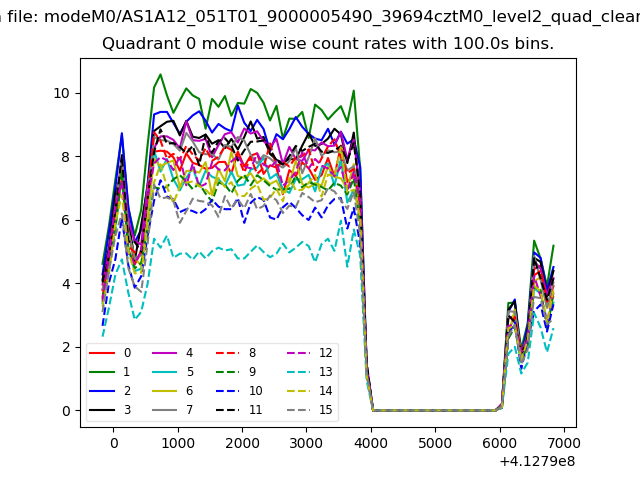 |
 |
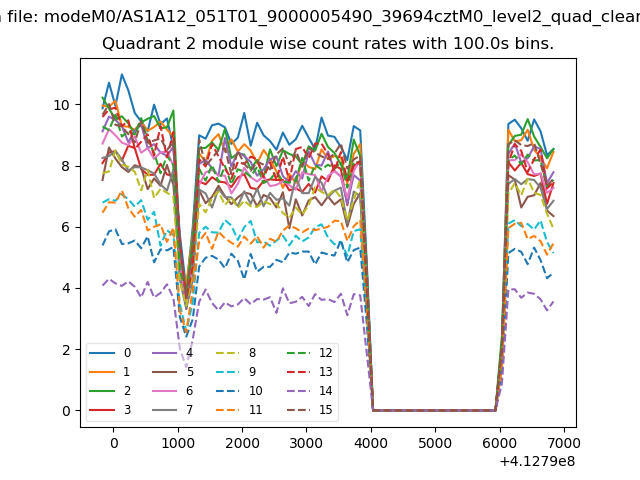
| Module-wise count rates for Quadrant B Data is divided into 100 sec bins |
 |
 |
| Module-wise count rates for Quadrant C Data is divided into 100 sec bins |
 |
 |
| Module-wise count rates for Quadrant D Data is divided into 100 sec bins |
 |
 |
| Parameter | Plot |
|---|---|
| CZT HV Monitor | 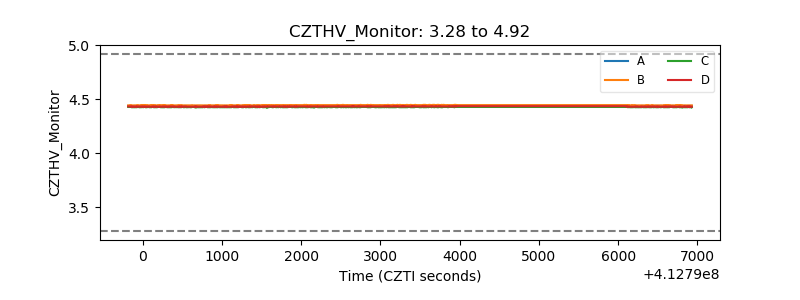 |
| D_VDD | 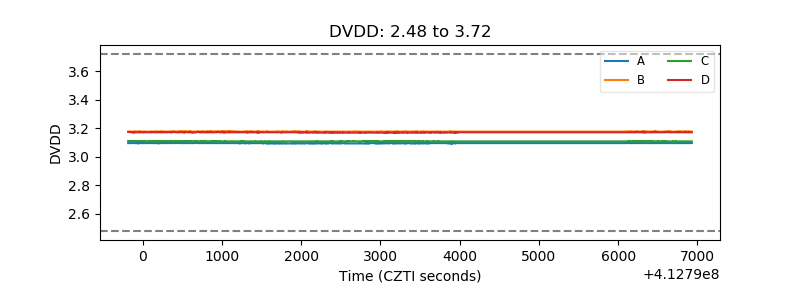 |
| Temperature 1 | 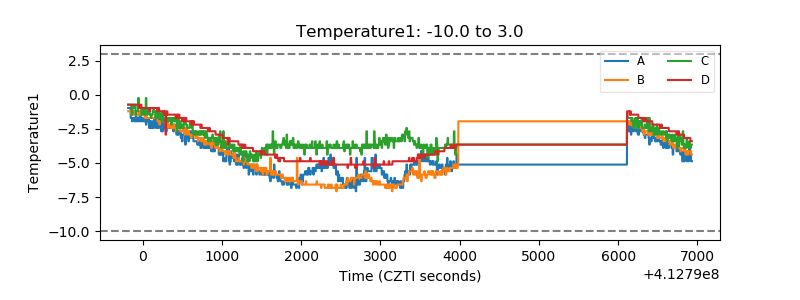 |
| Veto HV Monitor | 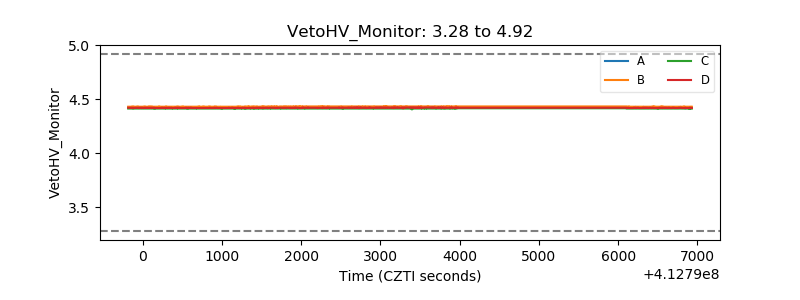 |
| Veto LLD | 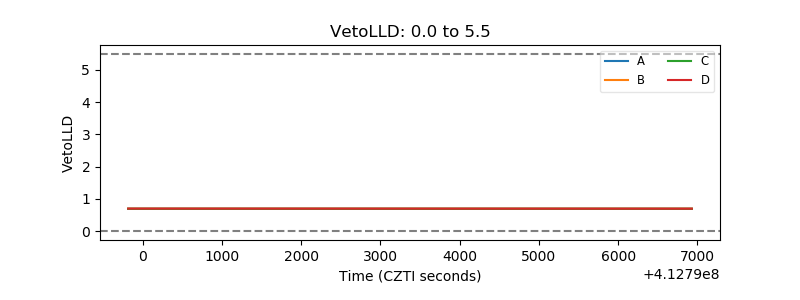 |
| Alpha Counter | 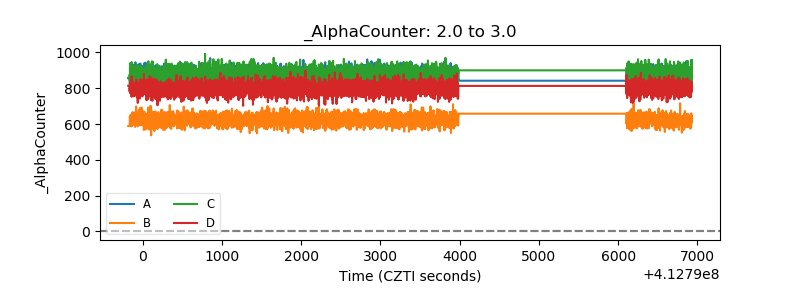 |
| _CPM_Rate | 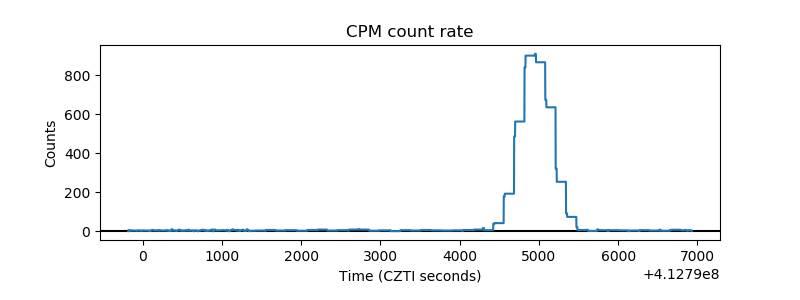 |
| CZT Counter | 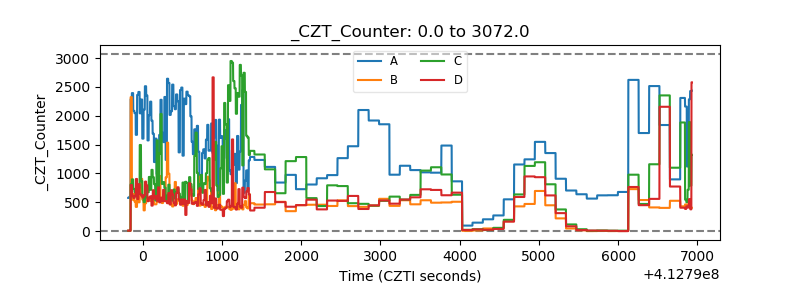 |
| +2.5 Volts monitor | 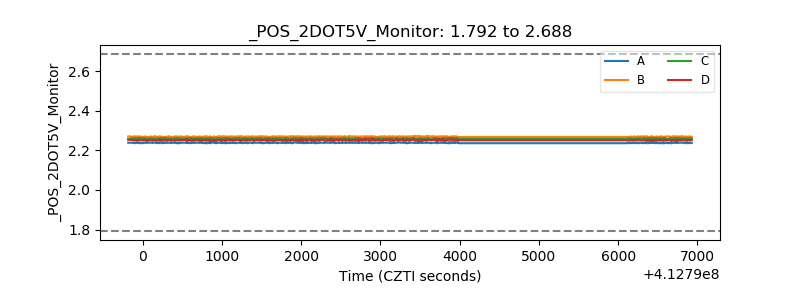 |
| +5 Volts monitor |  |
| _ROLL_ROT | 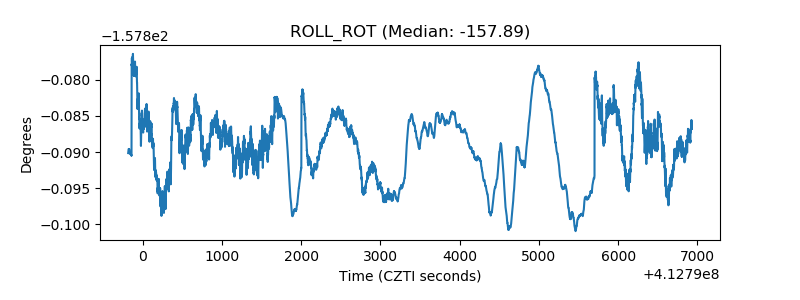 |
| _Roll_DEC | 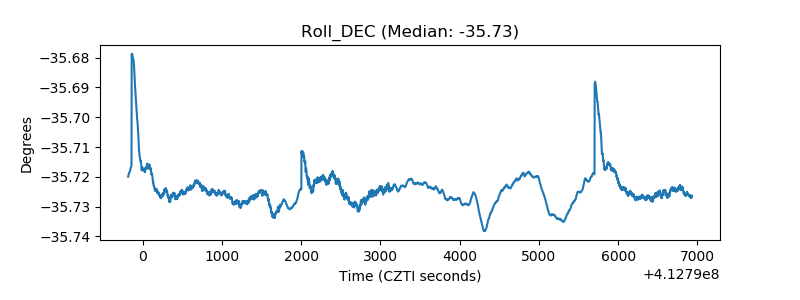 |
| _Roll_RA | 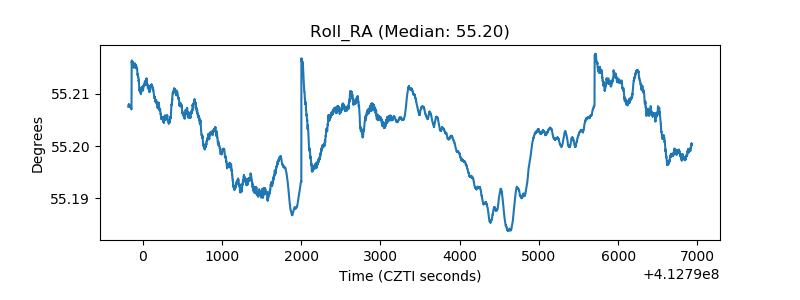 |
| Veto Counter | 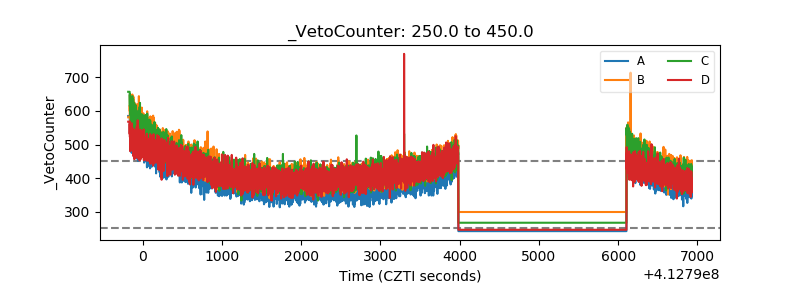 |