| Param | Original file | Final file |
|---|---|---|
| Filename | modeM0/AS1A12_051T01_9000005490_39695cztM0_level2.fits | modeM0/AS1A12_051T01_9000005490_39695cztM0_level2_quad_clean.evt |
| Size (bytes) | 512,665,920 | 81,950,400 |
| Size | 488.9 MB | 78.2 MB |
| Events in quadrant A | 8,437,134 | 463,316 |
| Events in quadrant B | 2,632,931 | 603,838 |
| Events in quadrant C | 4,231,710 | 550,873 |
| Events in quadrant D | 3,283,657 | 508,839 |
| Mode M9 | |||
|---|---|---|---|
| Quadrant | BADHDUFLAG | Total packets | Discarded packets |
| A | 0 | 28 | 0 |
| B | 0 | 28 | 0 |
| C | 0 | 28 | 0 |
| D | 0 | 29 | 0 |
| Mode M0 | |||
|---|---|---|---|
| Quadrant | BADHDUFLAG | Total packets | Discarded packets |
| A | 0 | 28569 | 3 |
| B | 0 | 11286 | 2 |
| C | 0 | 16011 | 2 |
| D | 0 | 13440 | 2 |
| Mode SS | |||
|---|---|---|---|
| Quadrant | BADHDUFLAG | Total packets | Discarded packets |
| A | 0 | 104 | 0 |
| B | 0 | 104 | 0 |
| C | 0 | 104 | 0 |
| D | 0 | 104 | 0 |
| Quadrant | Total seconds | Saturated seconds | Saturation percentage |
|---|---|---|---|
| A | 5051 | 1570 | 31.082954% |
| B | 5051 | 67 | 1.326470% |
| C | 5051 | 238 | 4.711938% |
| D | 5051 | 267 | 5.286082% |
Noise dominated data is calculated using 1-second bins in cleaned event files. If a bin has >2000 counts, and if more than 50% of those come from <1% of pixels, then it is considered to be noise-dominated and hence unusable.
| Quadrant | # 1 sec bins | Bins with >0 counts | Bins with >2000 counts | High rate bins dominated by noise | Noise dominated (total time) | Noise dominated (detector-on time) | Marked lightcurve |
|---|---|---|---|---|---|---|---|
| A | 7113 | 5052 | 1492 | 1492 | 20.98% | 29.53% | 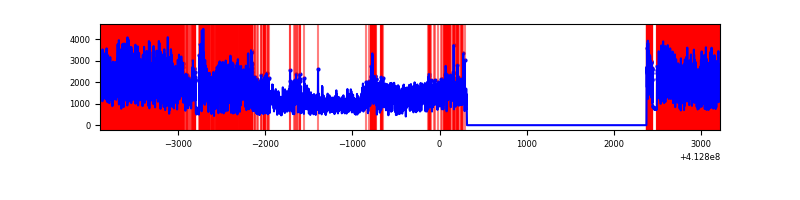 |
| B | 7113 | 5052 | 42 | 42 | 0.59% | 0.83% | 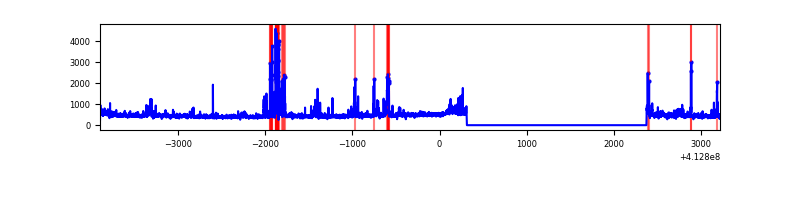 |
| C | 7113 | 5052 | 245 | 245 | 3.44% | 4.85% | 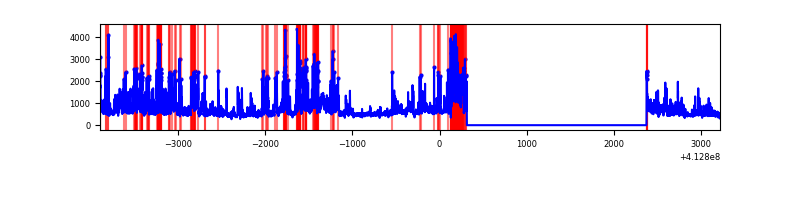 |
| D | 7113 | 5052 | 222 | 222 | 3.12% | 4.39% | 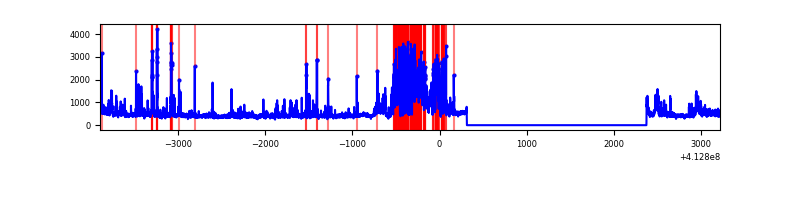 |
Top three noisy pixels from each quadrant. If the there are fewer than three noisy pixels in the level2.evt file, extra rows are filled as -1
| Pixel properties | Quadrant properties | ||||||
|---|---|---|---|---|---|---|---|
| Quadrant | DetID | PixID | Counts | Sigma | Mean | Median | Sigma |
| A | 15 | 222 | 5593045 | 53012.01 | 515 | 506 | 105.5 |
| A | 10 | 83 | 390619 | 3697.9 | 515 | 506 | 105.5 |
| A | 15 | 174 | 322177 | 3049.13 | 515 | 506 | 105.5 |
| B | 10 | 246 | 213740 | 1980.11 | 559 | 545 | 107.7 |
| B | 5 | 172 | 124960 | 1155.54 | 559 | 545 | 107.7 |
| B | 0 | 190 | 28420 | 258.9 | 559 | 545 | 107.7 |
| C | 9 | 187 | 1284835 | 10293.3 | 534 | 537 | 124.8 |
| C | 15 | 208 | 607499 | 4864.63 | 534 | 537 | 124.8 |
| C | 15 | 214 | 205079 | 1639.35 | 534 | 537 | 124.8 |
| D | 12 | 227 | 798035 | 6117.44 | 531 | 515 | 130.4 |
| D | 12 | 233 | 102962 | 785.83 | 531 | 515 | 130.4 |
| D | 2 | 250 | 94384 | 720.03 | 531 | 515 | 130.4 |
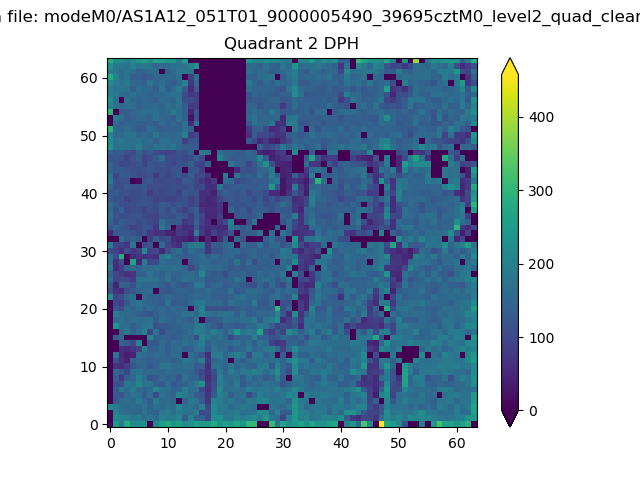
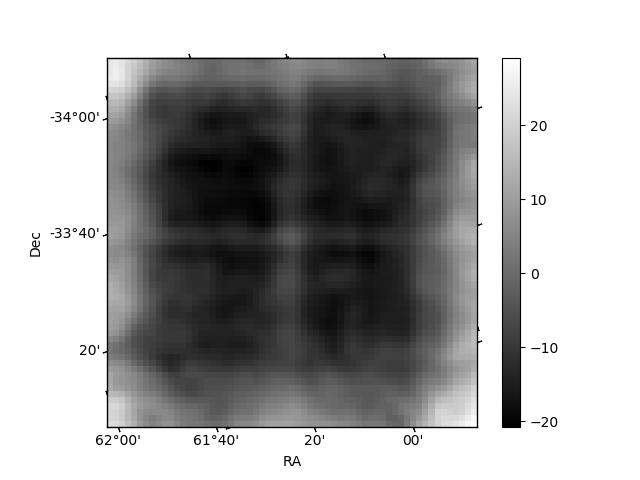
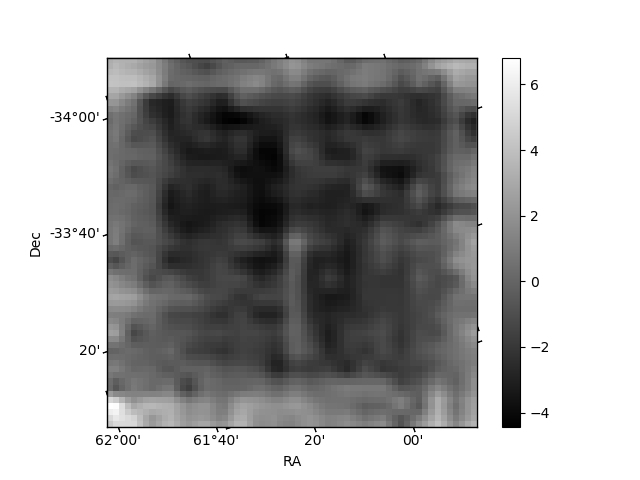
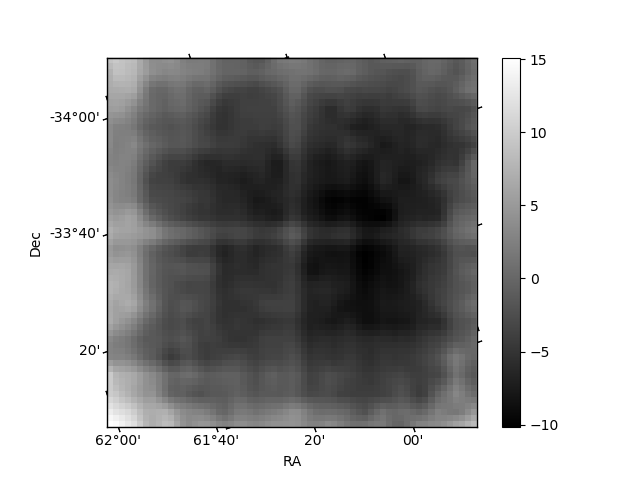
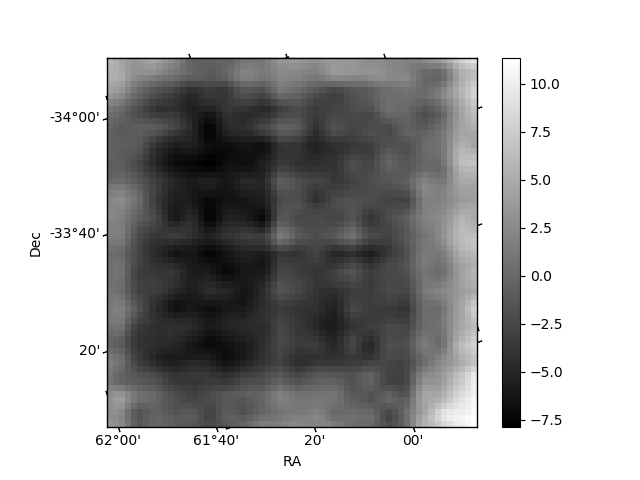
Histogram calculated using DETX and DETY for each event in the final _common_clean file
| Quadrant A | 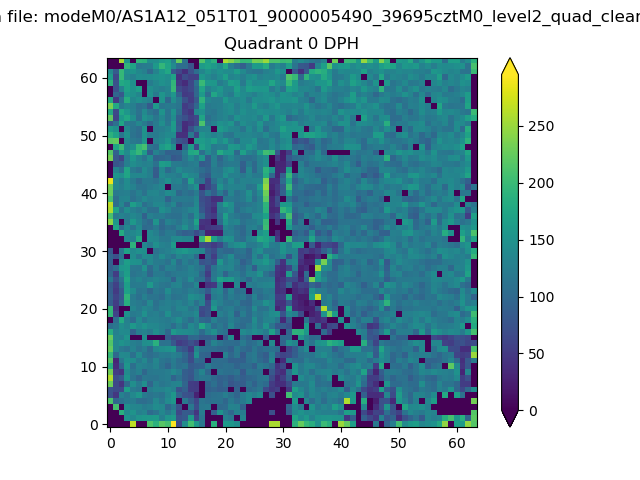 |
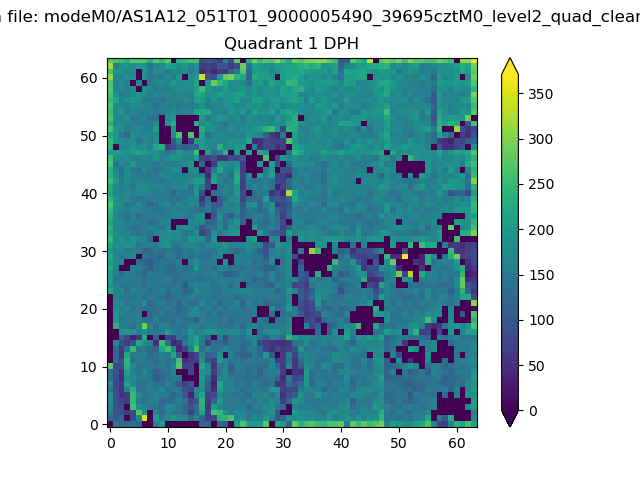 |
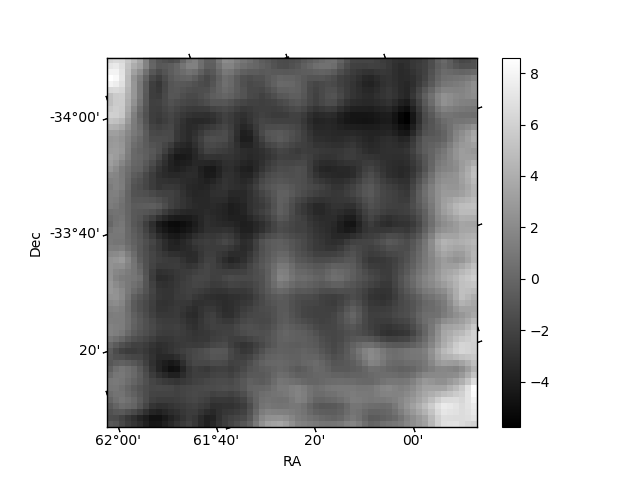
Quadrant B |
|---|---|---|---|
| Quadrant D | 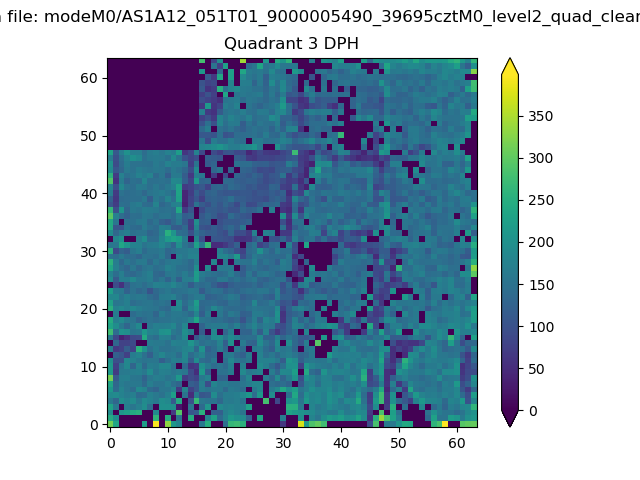 |
 |
Quadrant C |
| Plot type | Count rate plots | Images |
|---|---|---|
| Comparison with Poisson distribution Blue bars denote a histogram of data divided into 1 sec bins. Red curve is a Poisson curve with rate = median count rate of data. |
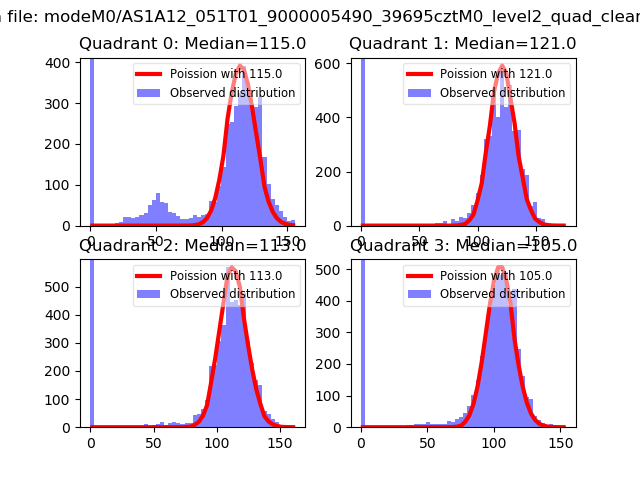 |
 |
| Quadrant-wise count rates Data is divided into 100 sec bins |
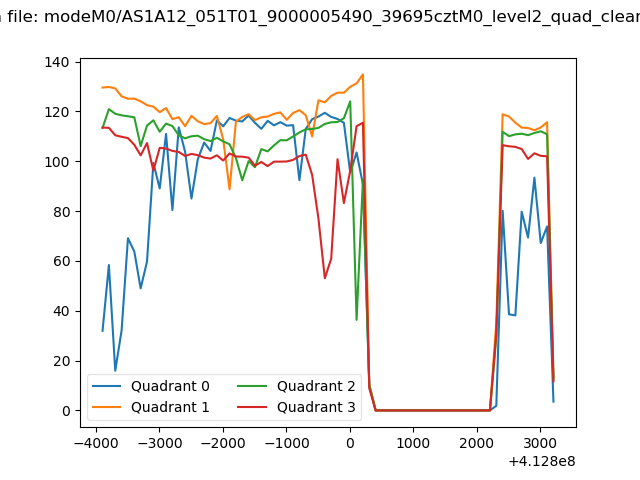 |
|
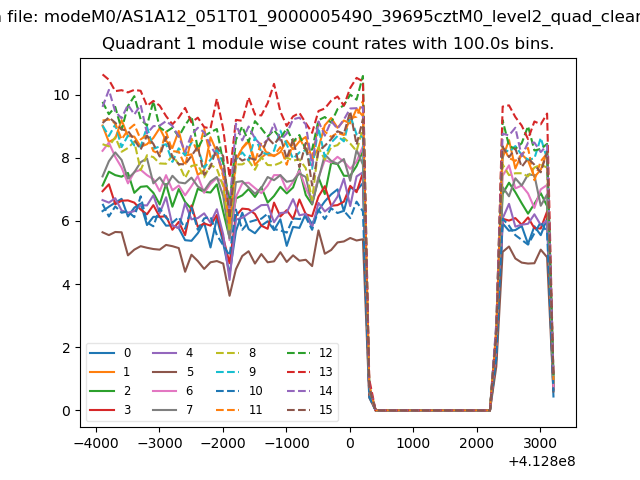
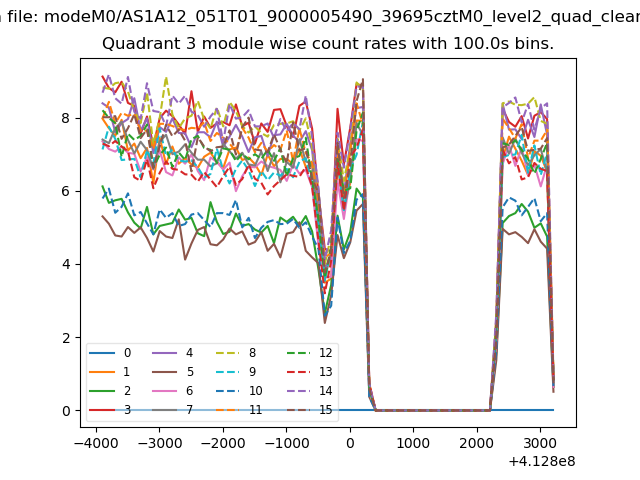
| Module-wise count rates for Quadrant A Data is divided into 100 sec bins |
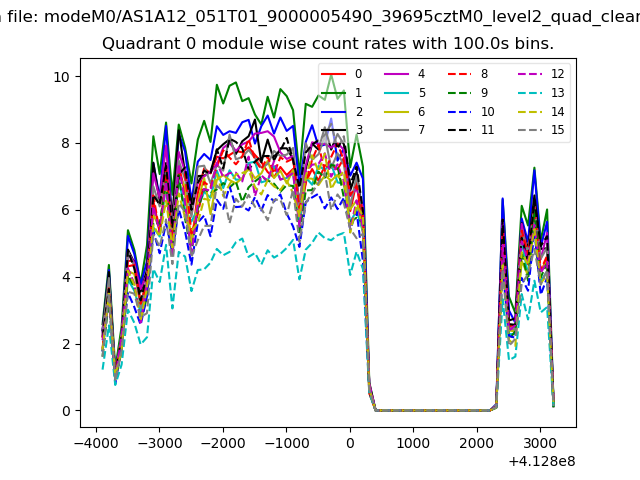 |
 |
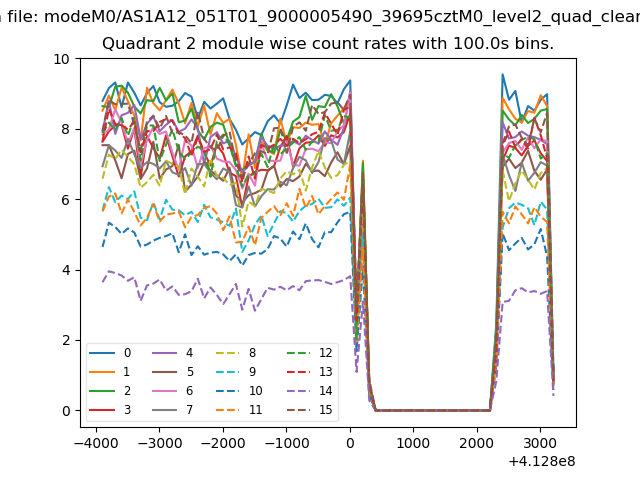
| Module-wise count rates for Quadrant B Data is divided into 100 sec bins |
 |
 |
| Module-wise count rates for Quadrant C Data is divided into 100 sec bins |
 |
 |
| Module-wise count rates for Quadrant D Data is divided into 100 sec bins |
 |
 |
| Parameter | Plot |
|---|---|
| CZT HV Monitor | 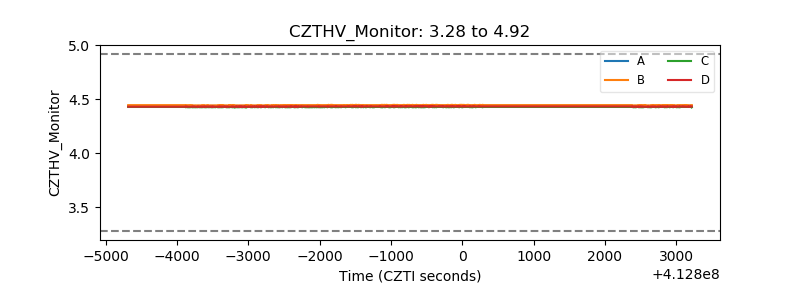 |
| D_VDD | 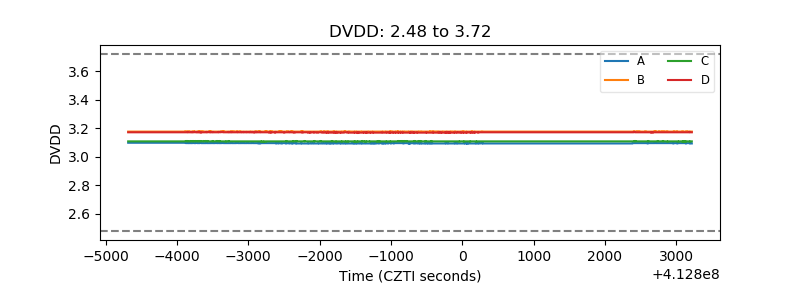 |
| Temperature 1 | 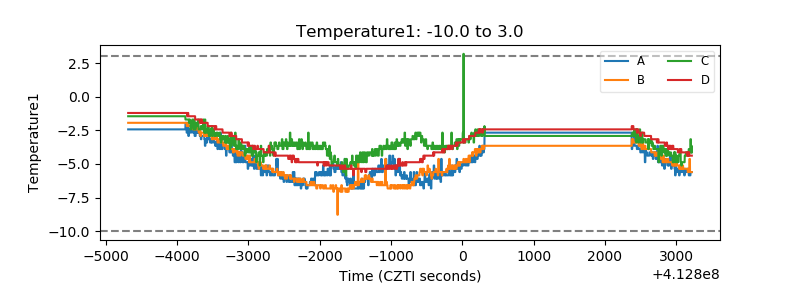 |
| Veto HV Monitor | 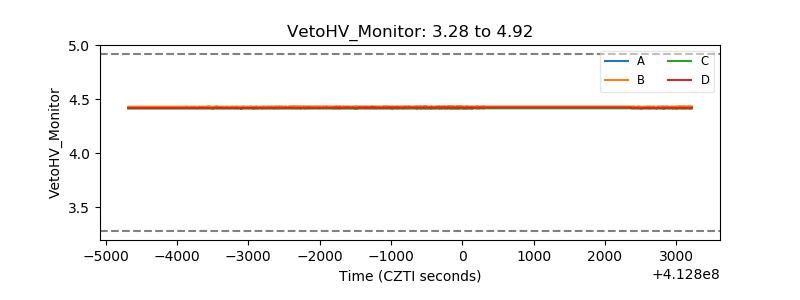 |
| Veto LLD | 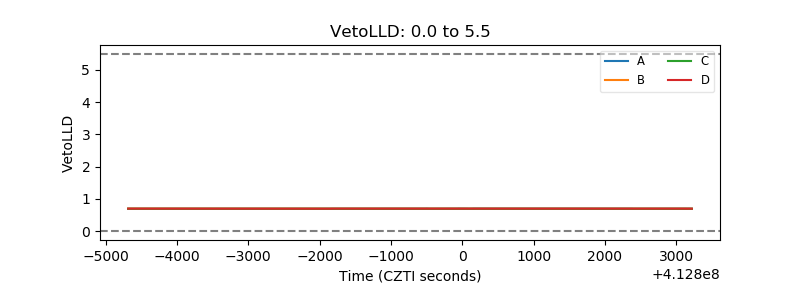 |
| Alpha Counter | 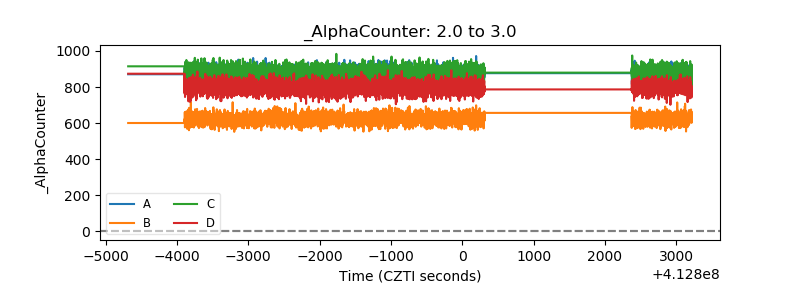 |
| _CPM_Rate | 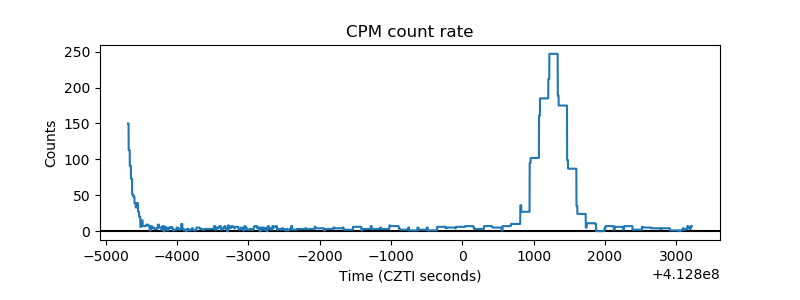 |
| CZT Counter | 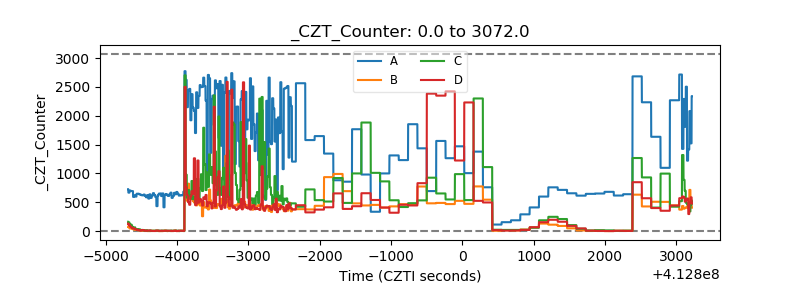 |
| +2.5 Volts monitor | 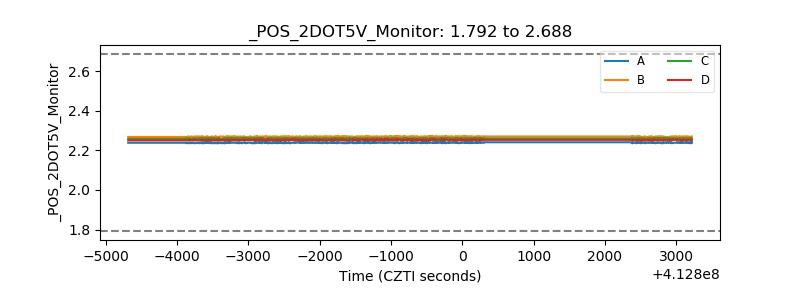 |
| +5 Volts monitor | 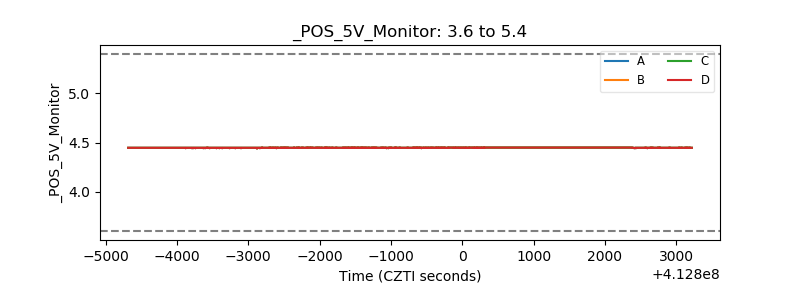 |
| _ROLL_ROT | 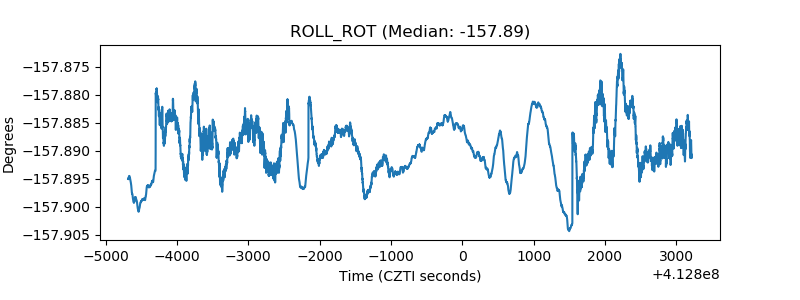 |
| _Roll_DEC | 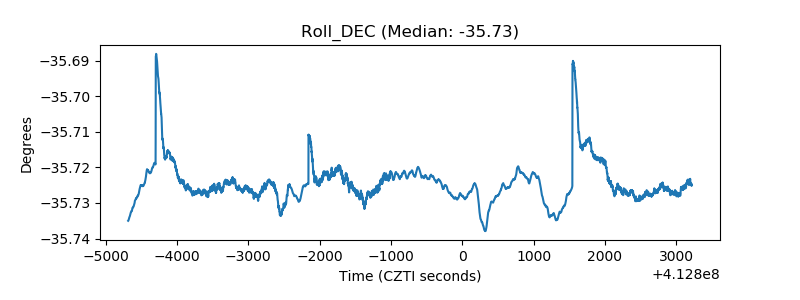 |
| _Roll_RA | 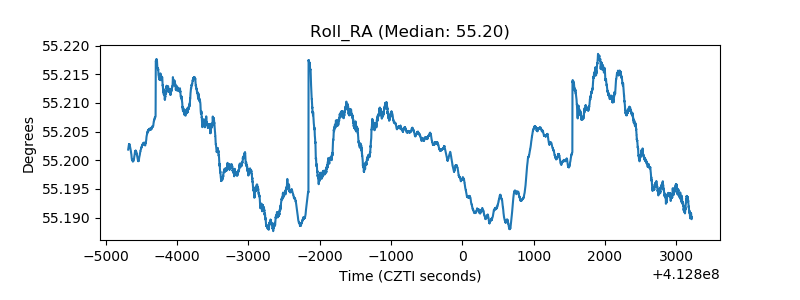 |
| Veto Counter | 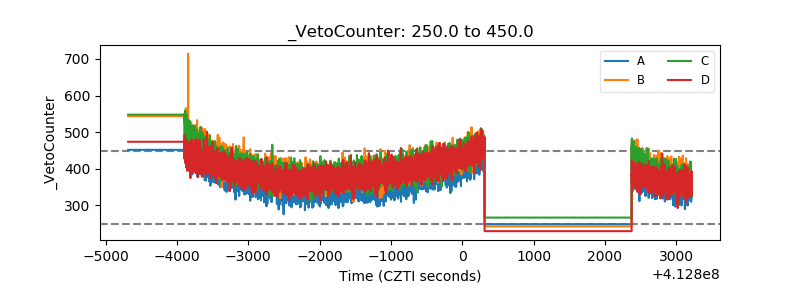 |