| Param | Original file | Final file |
|---|---|---|
| Filename | modeM0/AS1A12_051T01_9000005490_39696cztM0_level2.fits | modeM0/AS1A12_051T01_9000005490_39696cztM0_level2_quad_clean.evt |
| Size (bytes) | 114,235,200 | 17,824,320 |
| Size | 108.9 MB | 17.0 MB |
| Events in quadrant A | 2,285,224 | 80,936 |
| Events in quadrant B | 543,421 | 130,560 |
| Events in quadrant C | 706,940 | 124,965 |
| Events in quadrant D | 601,605 | 117,220 |
| Mode M9 | |||
|---|---|---|---|
| Quadrant | BADHDUFLAG | Total packets | Discarded packets |
| A | 0 | 7 | 0 |
| B | 0 | 7 | 0 |
| C | 0 | 7 | 0 |
| D | 0 | 8 | 0 |
| Mode M0 | |||
|---|---|---|---|
| Quadrant | BADHDUFLAG | Total packets | Discarded packets |
| A | 0 | 7574 | 1 |
| B | 0 | 2420 | 1 |
| C | 0 | 2864 | 1 |
| D | 0 | 2590 | 1 |
| Mode SS | |||
|---|---|---|---|
| Quadrant | BADHDUFLAG | Total packets | Discarded packets |
| A | 0 | 22 | 0 |
| B | 0 | 22 | 0 |
| C | 0 | 22 | 0 |
| D | 0 | 22 | 0 |
| Quadrant | Total seconds | Saturated seconds | Saturation percentage |
|---|---|---|---|
| A | 1137 | 570 | 50.131926% |
| B | 1137 | 4 | 0.351803% |
| C | 1137 | 5 | 0.439754% |
| D | 1137 | 1 | 0.087951% |
Noise dominated data is calculated using 1-second bins in cleaned event files. If a bin has >2000 counts, and if more than 50% of those come from <1% of pixels, then it is considered to be noise-dominated and hence unusable.
| Quadrant | # 1 sec bins | Bins with >0 counts | Bins with >2000 counts | High rate bins dominated by noise | Noise dominated (total time) | Noise dominated (detector-on time) | Marked lightcurve |
|---|---|---|---|---|---|---|---|
| A | 1137 | 1137 | 588 | 588 | 51.72% | 51.72% | 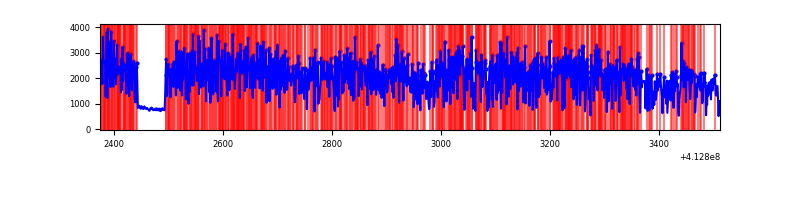 |
| B | 1137 | 1137 | 5 | 5 | 0.44% | 0.44% | 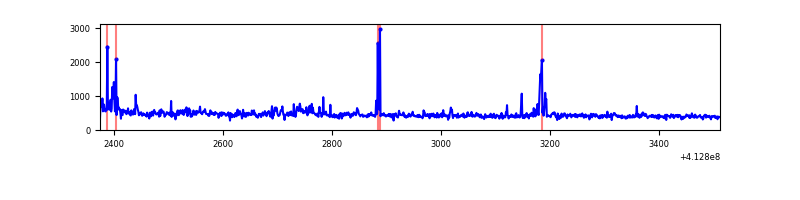 |
| C | 1137 | 1137 | 5 | 5 | 0.44% | 0.44% | 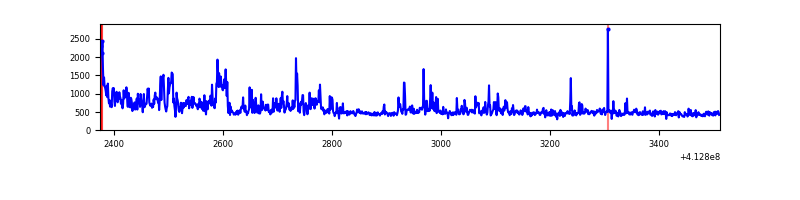 |
| D | 1137 | 1137 | 0 | 0 | 0.00% | 0.00% |  |
Top three noisy pixels from each quadrant. If the there are fewer than three noisy pixels in the level2.evt file, extra rows are filled as -1
| Pixel properties | Quadrant properties | ||||||
|---|---|---|---|---|---|---|---|
| Quadrant | DetID | PixID | Counts | Sigma | Mean | Median | Sigma |
| A | 15 | 222 | 1698222 | 72139.72 | 105 | 103 | 23.5 |
| A | 10 | 83 | 130708 | 5548.38 | 105 | 103 | 23.5 |
| A | 13 | 248 | 28665 | 1213.37 | 105 | 103 | 23.5 |
| B | 5 | 32 | 20471 | 808.32 | 120 | 117 | 25.2 |
| B | 0 | 190 | 15689 | 618.42 | 120 | 117 | 25.2 |
| B | 4 | 170 | 10803 | 424.38 | 120 | 117 | 25.2 |
| C | 9 | 187 | 128725 | 4455.18 | 115 | 115 | 28.9 |
| C | 15 | 208 | 54537 | 1885.23 | 115 | 115 | 28.9 |
| C | 15 | 214 | 50514 | 1745.87 | 115 | 115 | 28.9 |
| D | 13 | 174 | 59829 | 2001.08 | 115 | 111 | 29.8 |
| D | 12 | 233 | 33665 | 1124.36 | 115 | 111 | 29.8 |
| D | 13 | 249 | 28872 | 963.75 | 115 | 111 | 29.8 |
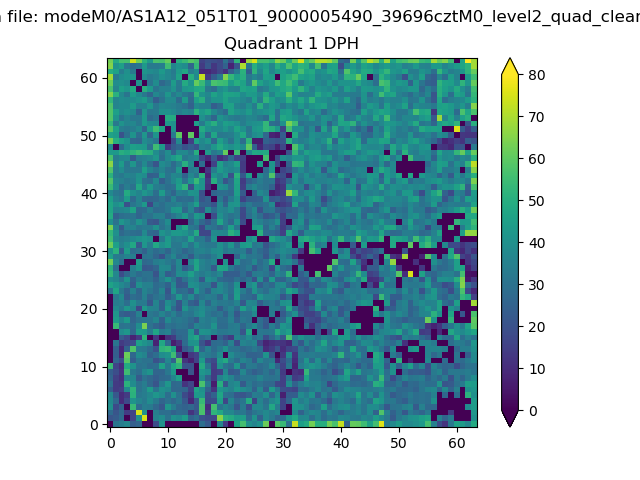
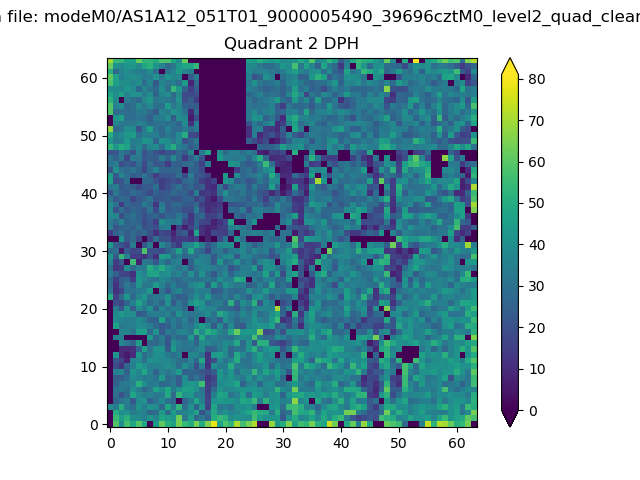
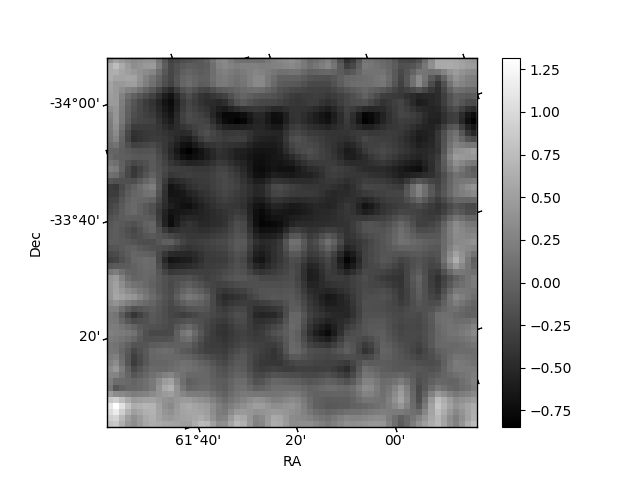
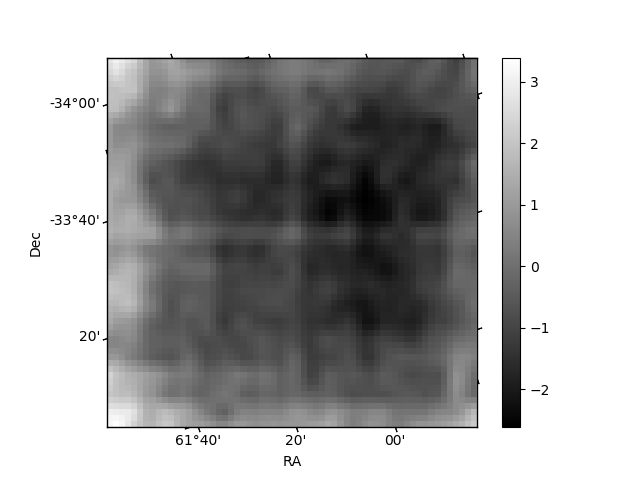
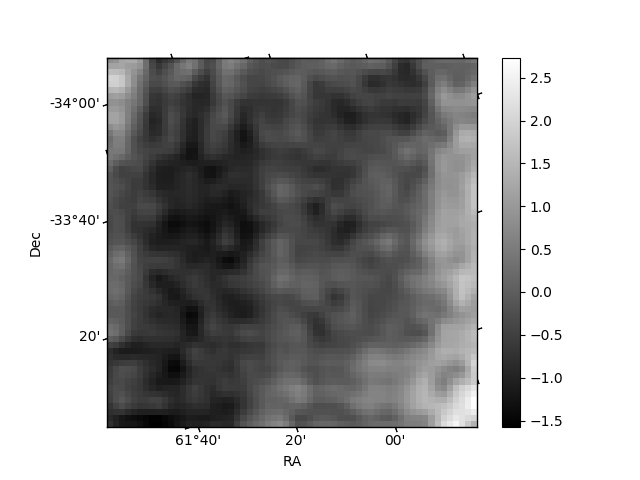
Histogram calculated using DETX and DETY for each event in the final _common_clean file
| Quadrant A | 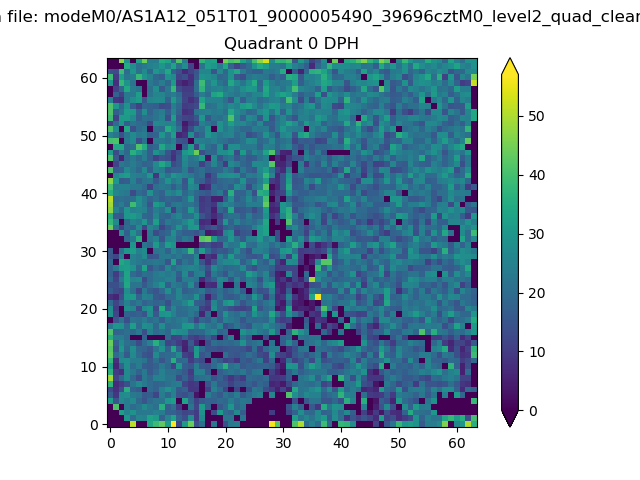 |
 |
Quadrant B |
|---|---|---|---|
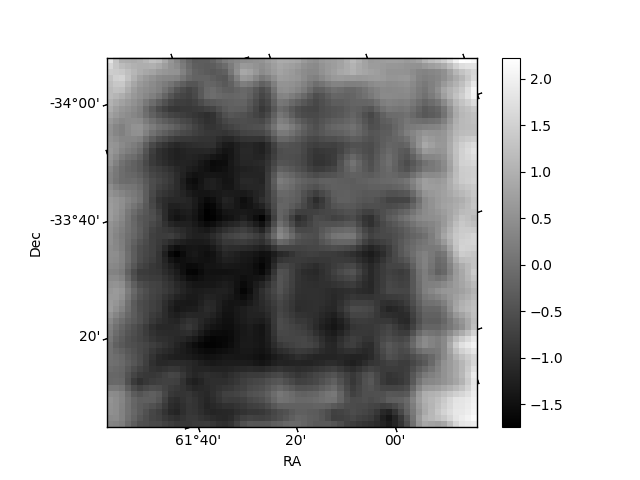
| Quadrant D | 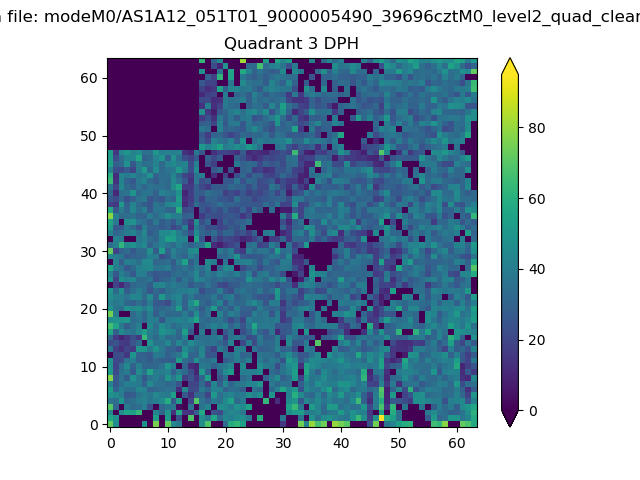 |
 |
Quadrant C |
| Plot type | Count rate plots | Images |
|---|---|---|
| Comparison with Poisson distribution Blue bars denote a histogram of data divided into 1 sec bins. Red curve is a Poisson curve with rate = median count rate of data. |
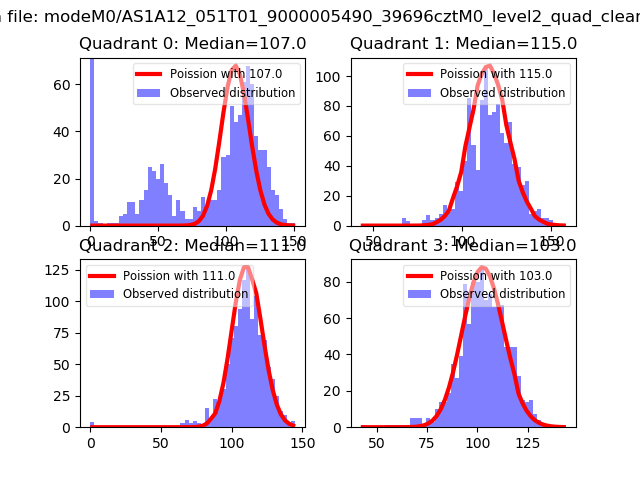 |
 |
| Quadrant-wise count rates Data is divided into 100 sec bins |
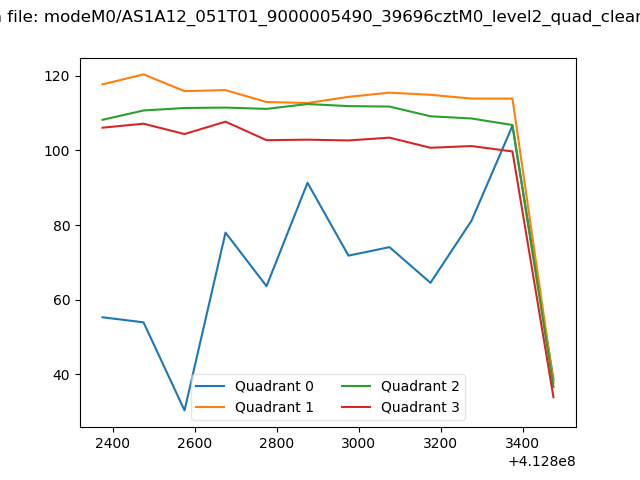 |
|
| Module-wise count rates for Quadrant A Data is divided into 100 sec bins |
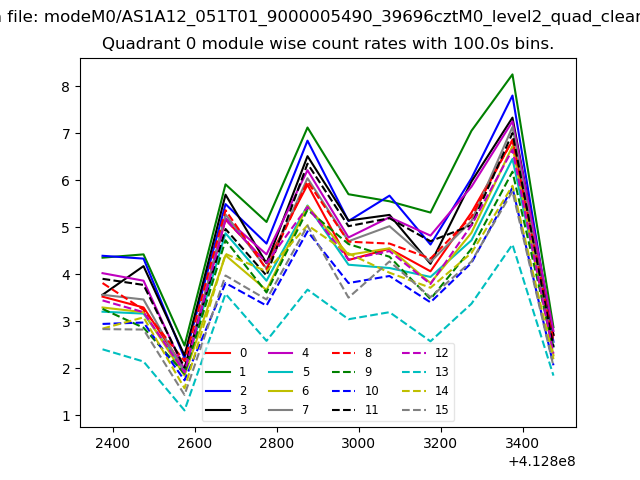 |
 |
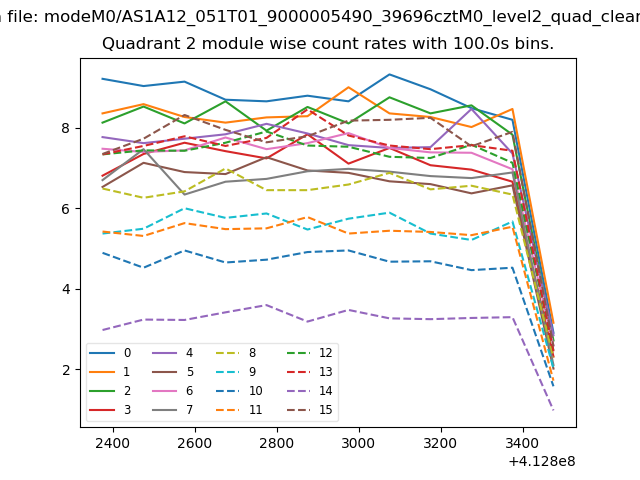
| Module-wise count rates for Quadrant B Data is divided into 100 sec bins |
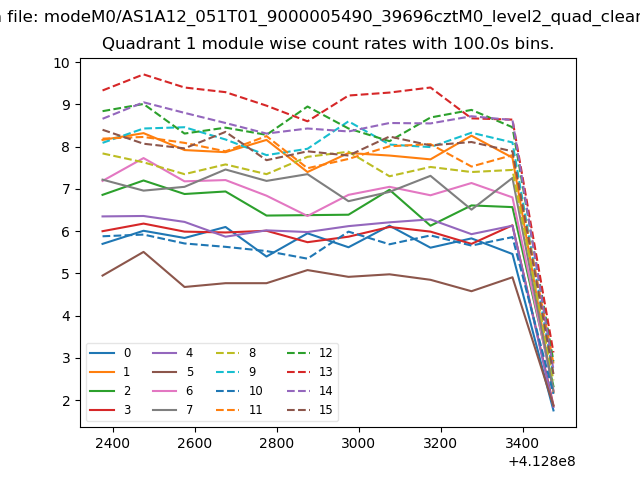 |
 |
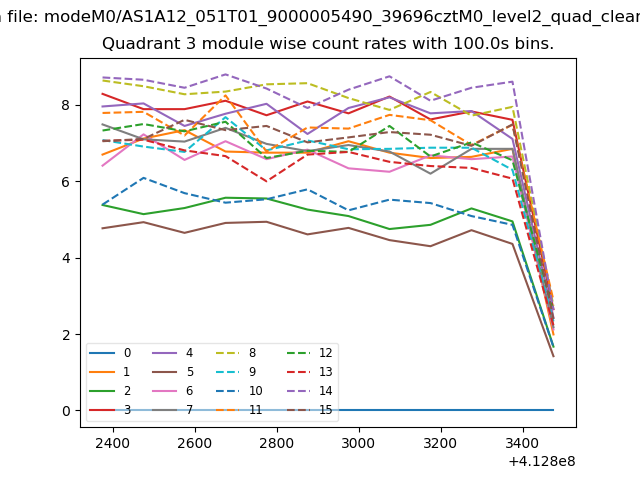
| Module-wise count rates for Quadrant C Data is divided into 100 sec bins |
 |
 |
| Module-wise count rates for Quadrant D Data is divided into 100 sec bins |
 |
 |
| Parameter | Plot |
|---|---|
| CZT HV Monitor | 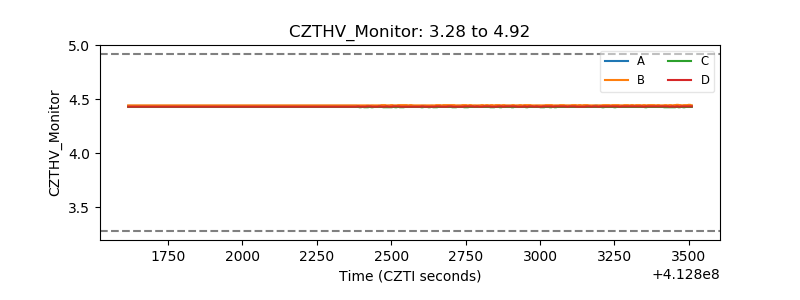 |
| D_VDD | 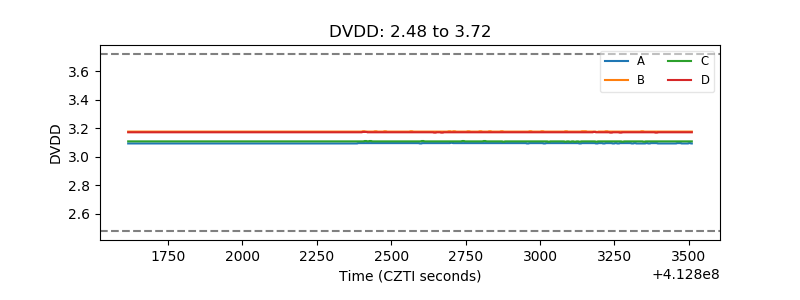 |
| Temperature 1 | 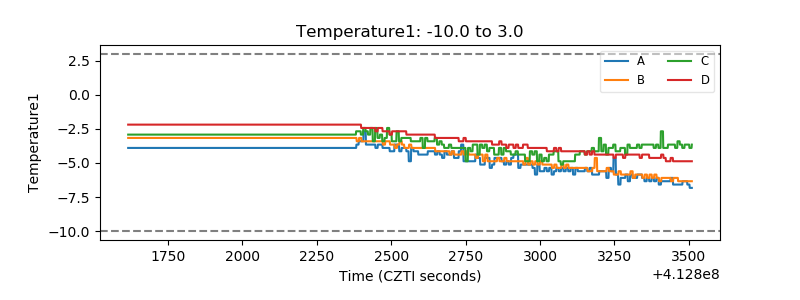 |
| Veto HV Monitor | 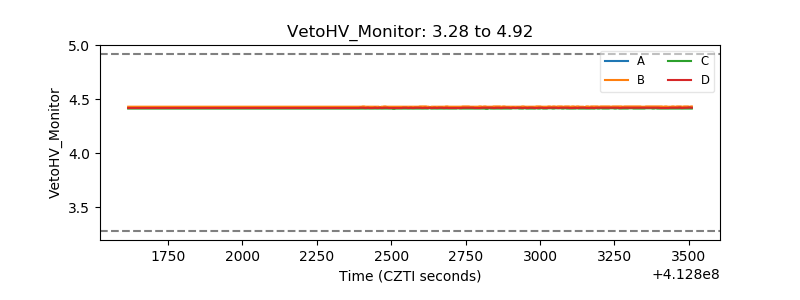 |
| Veto LLD | 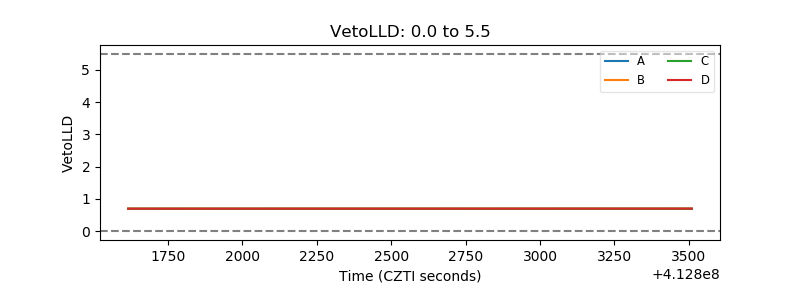 |
| Alpha Counter | 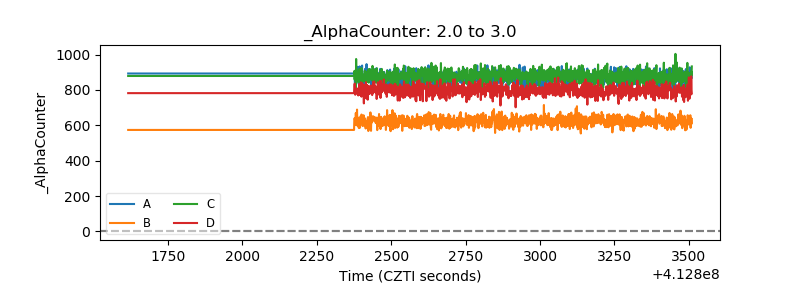 |
| _CPM_Rate | 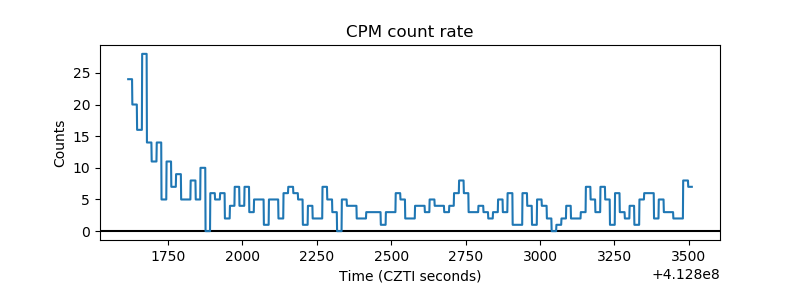 |
| CZT Counter | 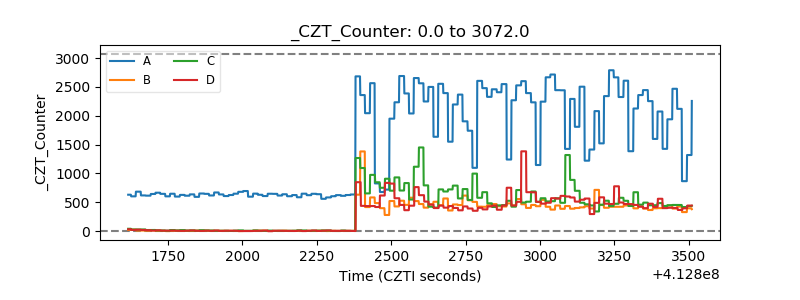 |
| +2.5 Volts monitor | 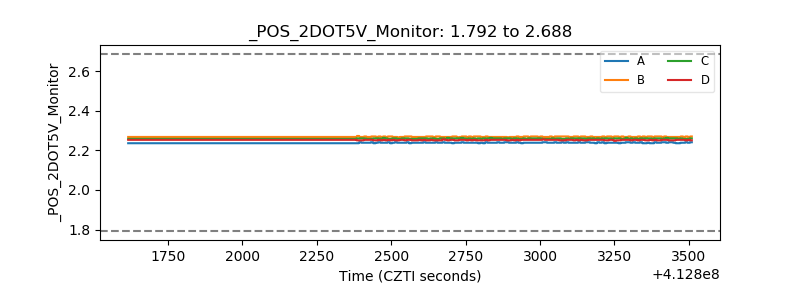 |
| +5 Volts monitor | 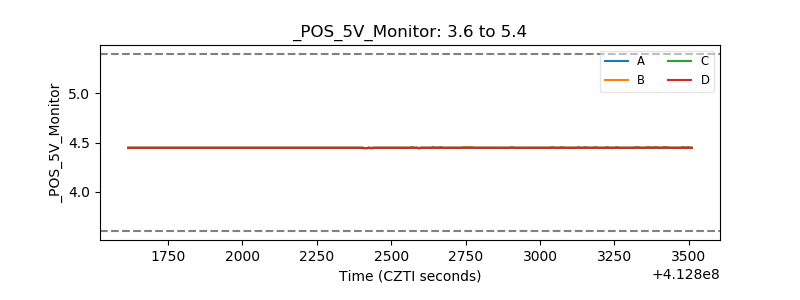 |
| _ROLL_ROT | 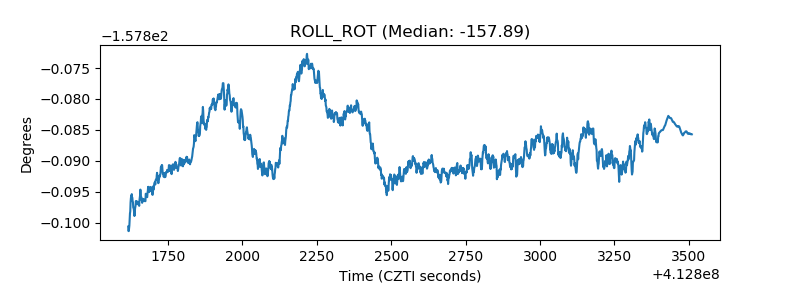 |
| _Roll_DEC | 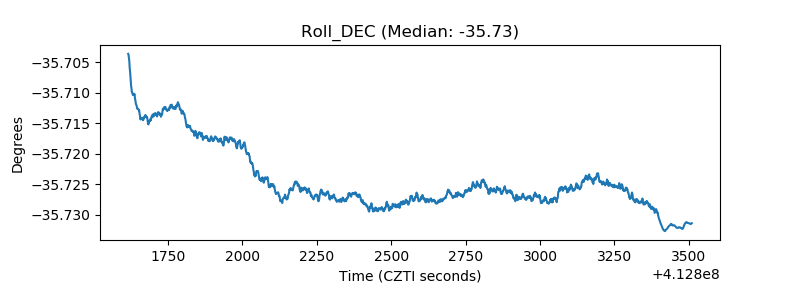 |
| _Roll_RA | 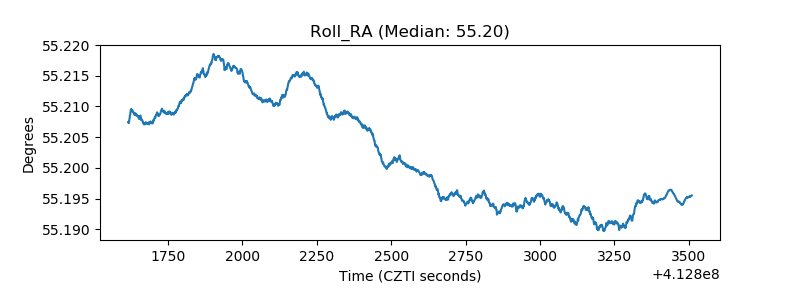 |
| Veto Counter | 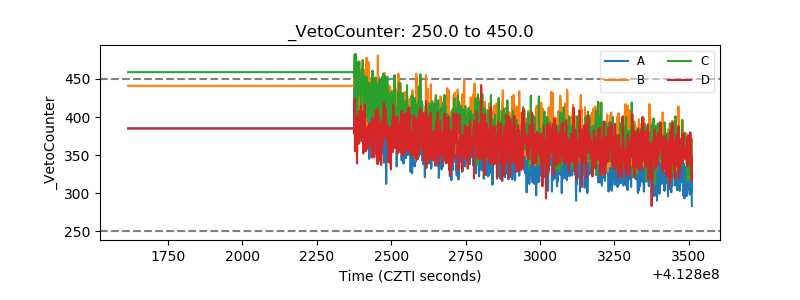 |