| Param | Original file | Final file |
|---|---|---|
| Filename | modeM0/AS1A12_011T22_9000005492_39696cztM0_level2.fits | modeM0/AS1A12_011T22_9000005492_39696cztM0_level2_quad_clean.evt |
| Size (bytes) | 259,580,160 | 43,908,480 |
| Size | 247.6 MB | 41.9 MB |
| Events in quadrant A | 4,320,041 | 245,296 |
| Events in quadrant B | 1,517,007 | 312,656 |
| Events in quadrant C | 2,030,586 | 302,107 |
| Events in quadrant D | 1,528,857 | 275,368 |
| Mode M0 | |||
|---|---|---|---|
| Quadrant | BADHDUFLAG | Total packets | Discarded packets |
| A | 0 | 14713 | 2 |
| B | 0 | 6307 | 1 |
| C | 0 | 7734 | 1 |
| D | 0 | 6453 | 1 |
| Mode SS | |||
|---|---|---|---|
| Quadrant | BADHDUFLAG | Total packets | Discarded packets |
| A | 0 | 56 | 0 |
| B | 0 | 56 | 0 |
| C | 0 | 56 | 0 |
| D | 0 | 56 | 0 |
| Mode M9 | |||
|---|---|---|---|
| Quadrant | BADHDUFLAG | Total packets | Discarded packets |
| A | 0 | 18 | 0 |
| B | 0 | 18 | 0 |
| C | 0 | 18 | 0 |
| D | 0 | 18 | 0 |
| Quadrant | Total seconds | Saturated seconds | Saturation percentage |
|---|---|---|---|
| A | 2713 | 808 | 29.782529% |
| B | 2713 | 92 | 3.391080% |
| C | 2713 | 67 | 2.469591% |
| D | 2713 | 82 | 3.022484% |
Noise dominated data is calculated using 1-second bins in cleaned event files. If a bin has >2000 counts, and if more than 50% of those come from <1% of pixels, then it is considered to be noise-dominated and hence unusable.
| Quadrant | # 1 sec bins | Bins with >0 counts | Bins with >2000 counts | High rate bins dominated by noise | Noise dominated (total time) | Noise dominated (detector-on time) | Marked lightcurve |
|---|---|---|---|---|---|---|---|
| A | 4504 | 2714 | 684 | 684 | 15.19% | 25.20% | 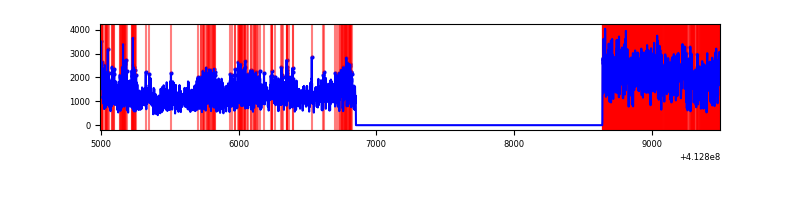 |
| B | 4504 | 2714 | 67 | 67 | 1.49% | 2.47% | 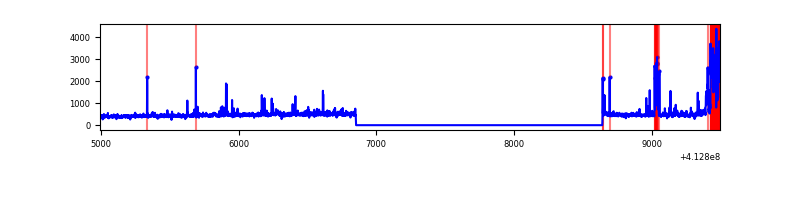 |
| C | 4504 | 2714 | 72 | 72 | 1.60% | 2.65% | 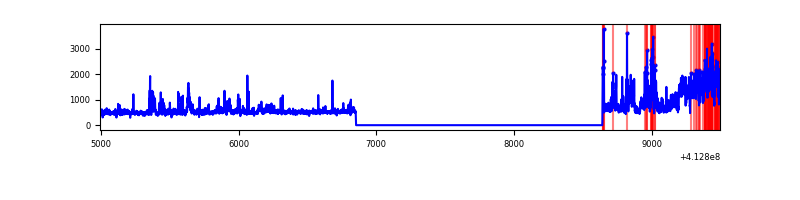 |
| D | 4504 | 2714 | 68 | 68 | 1.51% | 2.51% | 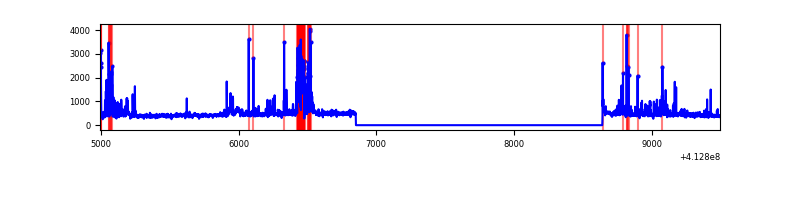 |
Top three noisy pixels from each quadrant. If the there are fewer than three noisy pixels in the level2.evt file, extra rows are filled as -1
| Pixel properties | Quadrant properties | ||||||
|---|---|---|---|---|---|---|---|
| Quadrant | DetID | PixID | Counts | Sigma | Mean | Median | Sigma |
| A | 15 | 222 | 2848132 | 47497.52 | 286 | 279 | 60.0 |
| A | 10 | 83 | 192934 | 3213.17 | 286 | 279 | 60.0 |
| A | 15 | 174 | 161564 | 2689.97 | 286 | 279 | 60.0 |
| B | 5 | 172 | 310535 | 5145.93 | 302 | 293 | 60.3 |
| B | 10 | 246 | 15206 | 247.36 | 302 | 293 | 60.3 |
| B | 12 | 111 | 7448 | 118.68 | 302 | 293 | 60.3 |
| C | 15 | 208 | 507580 | 7246.95 | 295 | 297 | 70.0 |
| C | 9 | 187 | 230764 | 3292.41 | 295 | 297 | 70.0 |
| C | 15 | 214 | 111116 | 1583.14 | 295 | 297 | 70.0 |
| D | 2 | 153 | 172441 | 2380.06 | 294 | 286 | 72.3 |
| D | 12 | 233 | 165281 | 2281.07 | 294 | 286 | 72.3 |
| D | 2 | 250 | 24849 | 339.59 | 294 | 286 | 72.3 |
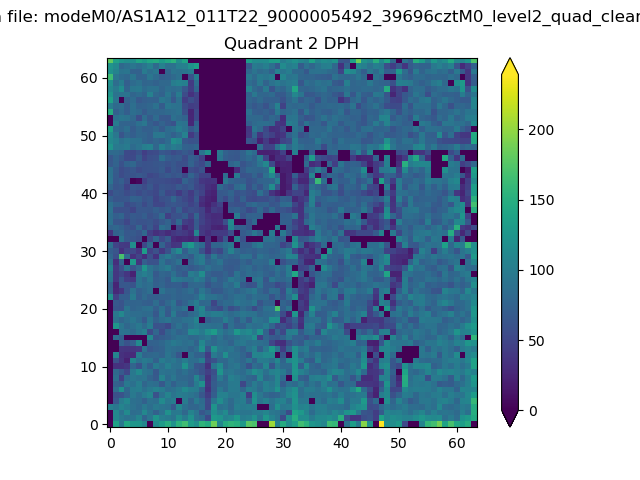
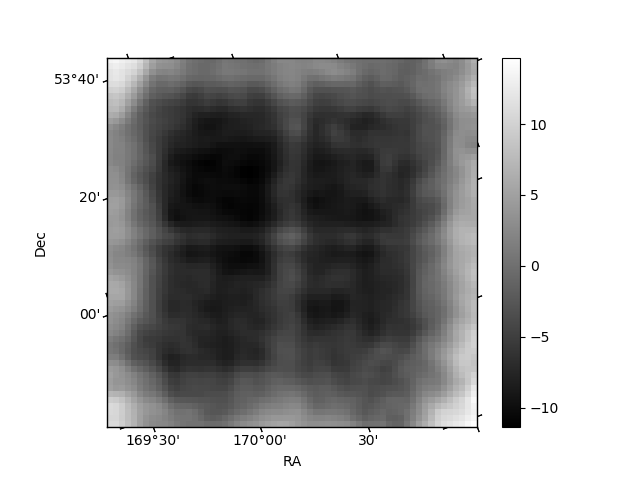
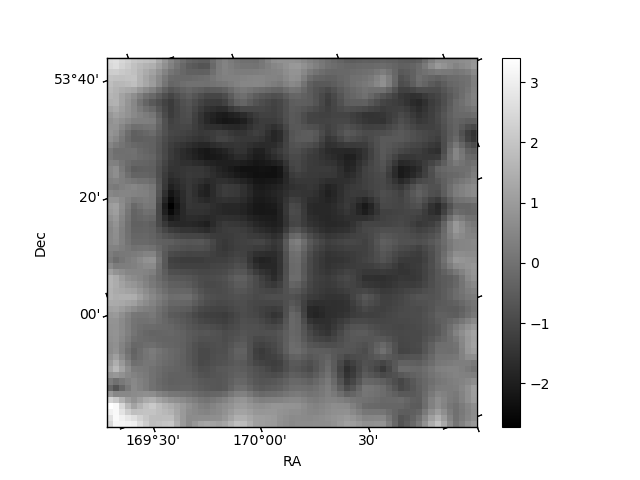
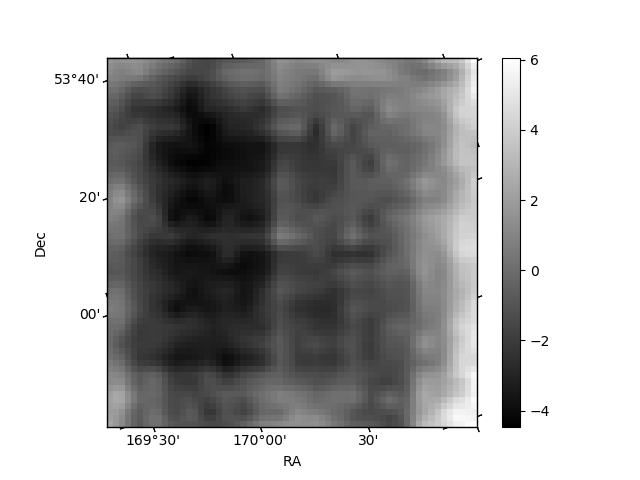
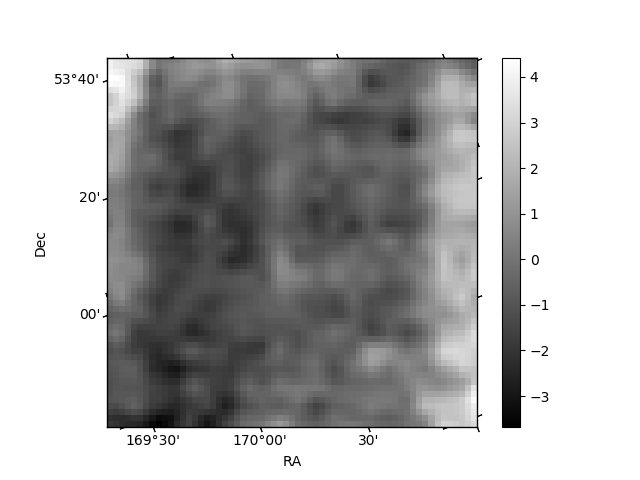
Histogram calculated using DETX and DETY for each event in the final _common_clean file
| Quadrant A | 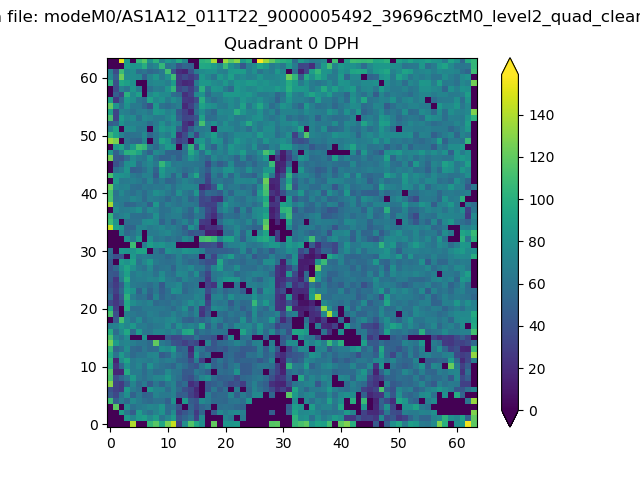 |
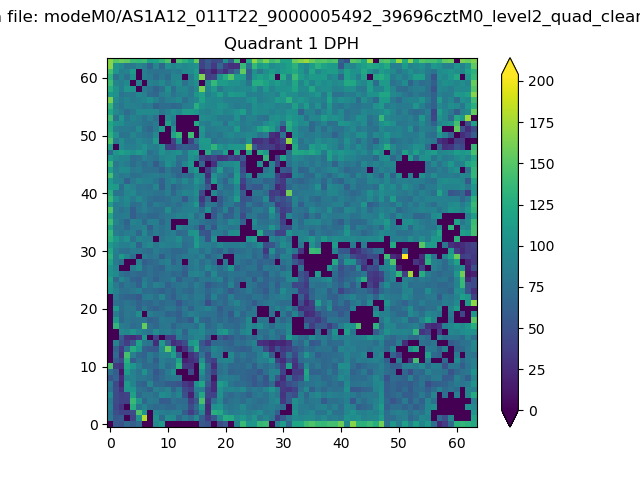 |
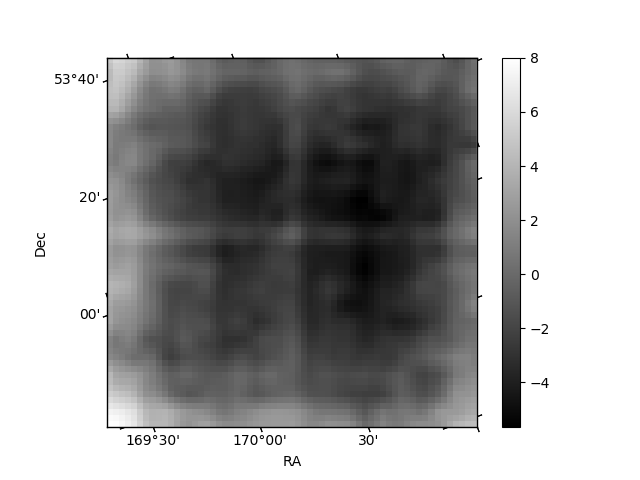
Quadrant B |
|---|---|---|---|
| Quadrant D | 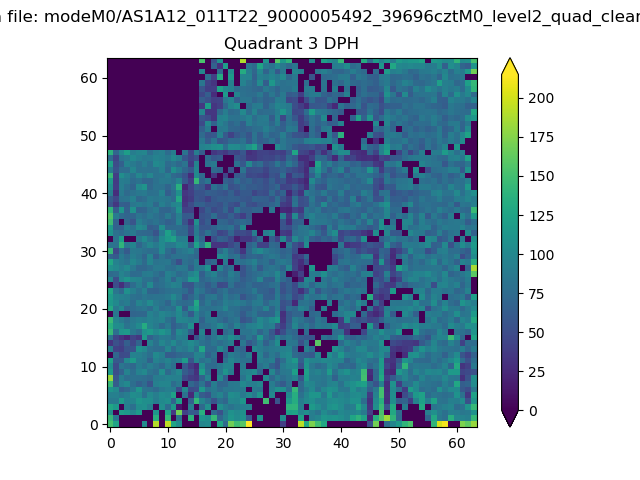 |
 |
Quadrant C |
| Plot type | Count rate plots | Images |
|---|---|---|
| Comparison with Poisson distribution Blue bars denote a histogram of data divided into 1 sec bins. Red curve is a Poisson curve with rate = median count rate of data. |
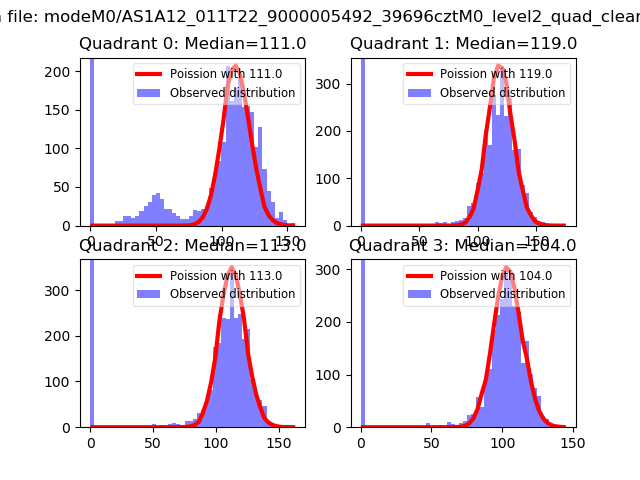 |
 |
| Quadrant-wise count rates Data is divided into 100 sec bins |
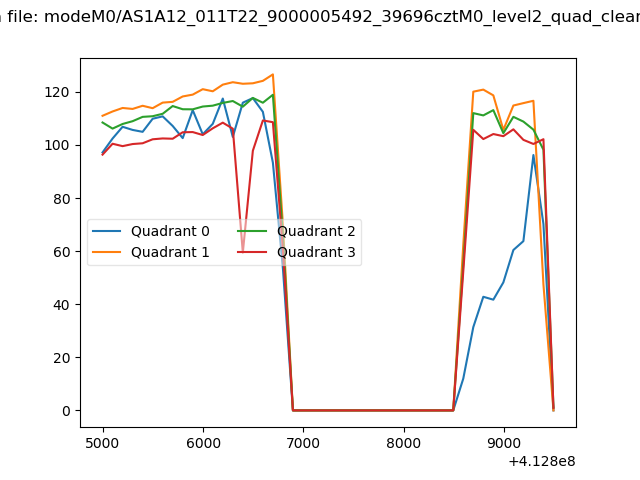 |
|
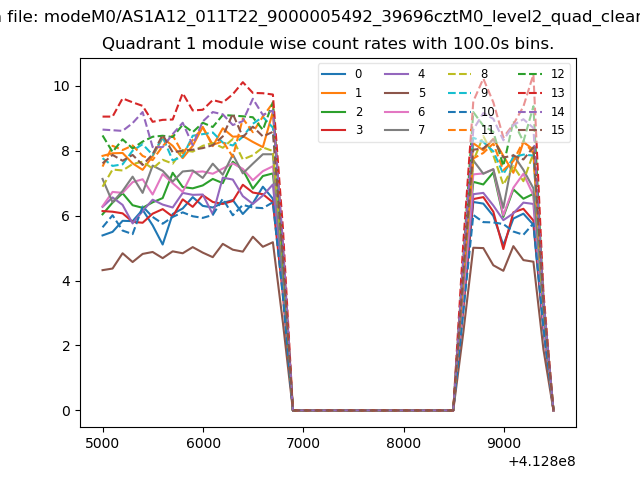
| Module-wise count rates for Quadrant A Data is divided into 100 sec bins |
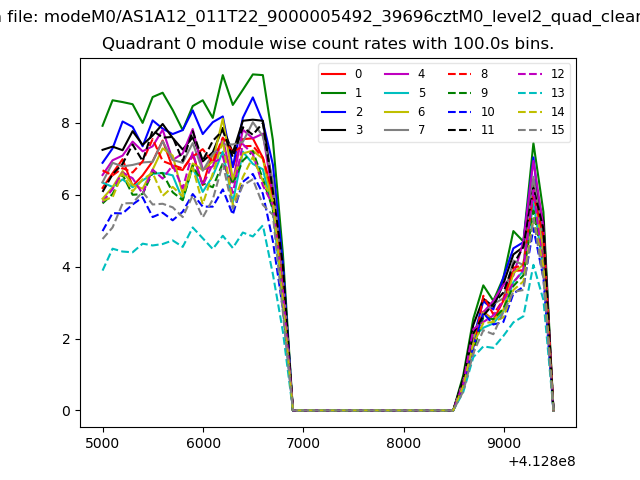 |
 |
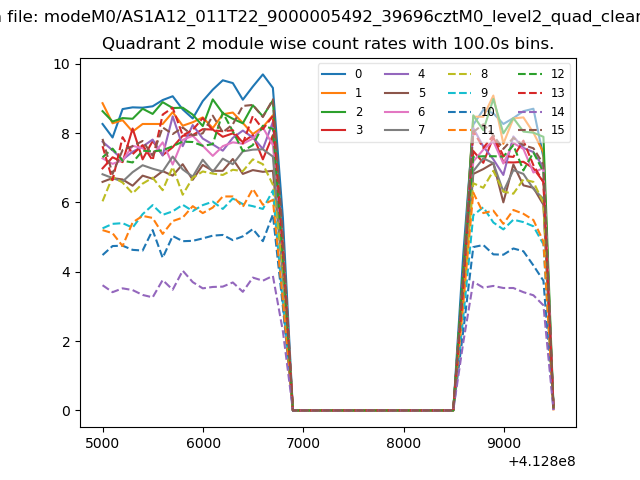
| Module-wise count rates for Quadrant B Data is divided into 100 sec bins |
 |
 |
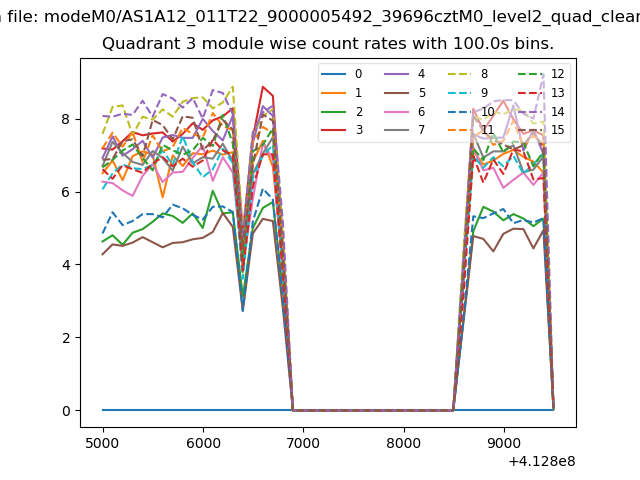
| Module-wise count rates for Quadrant C Data is divided into 100 sec bins |
 |
 |
| Module-wise count rates for Quadrant D Data is divided into 100 sec bins |
 |
 |
| Parameter | Plot |
|---|---|
| CZT HV Monitor | 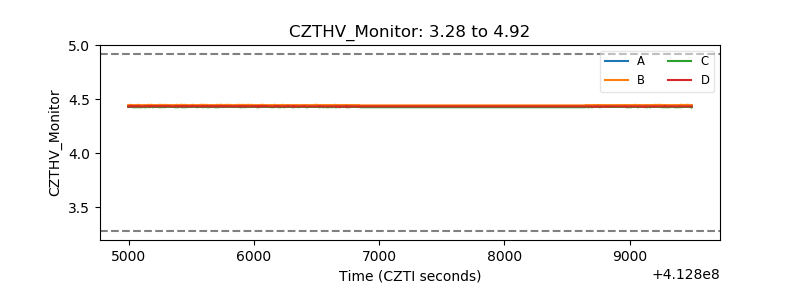 |
| D_VDD | 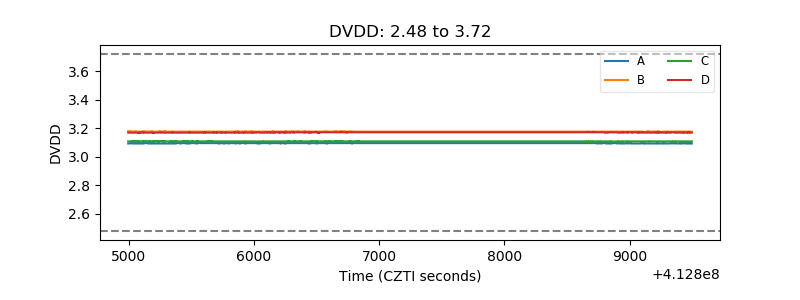 |
| Temperature 1 | 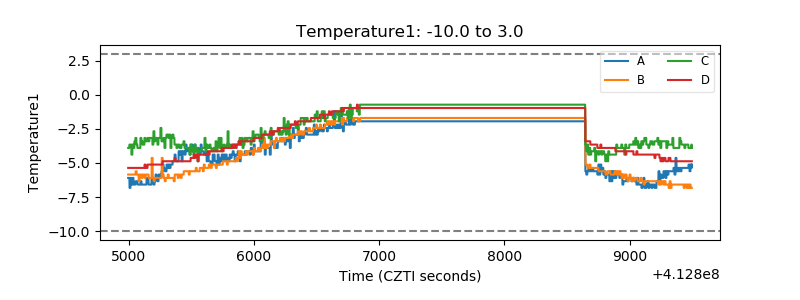 |
| Veto HV Monitor | 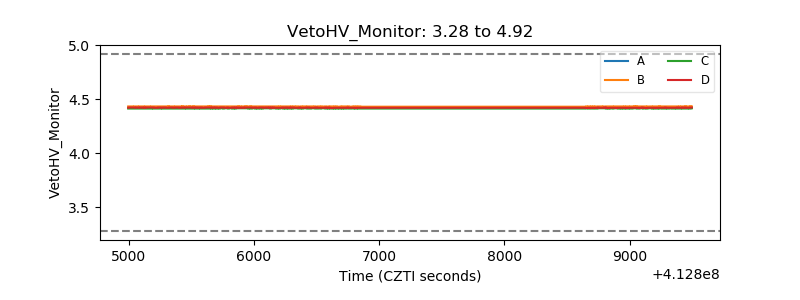 |
| Veto LLD | 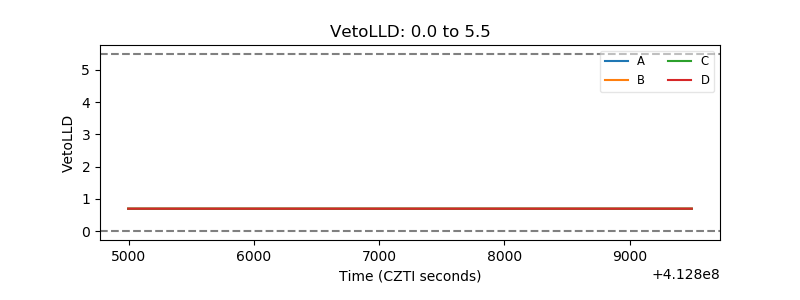 |
| Alpha Counter | 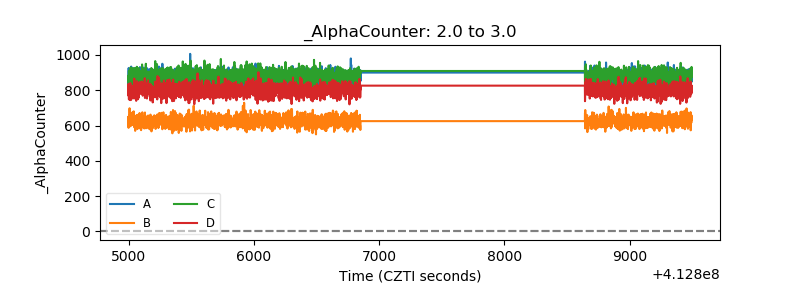 |
| _CPM_Rate | 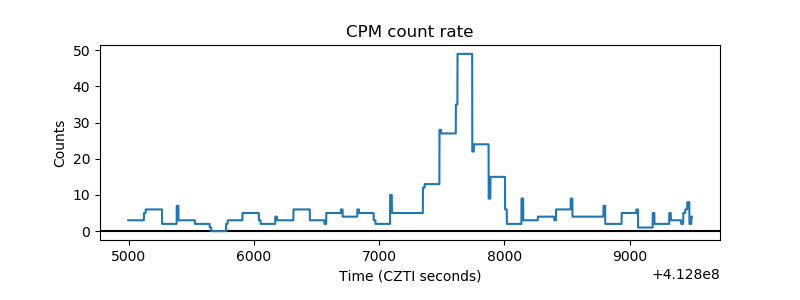 |
| CZT Counter | 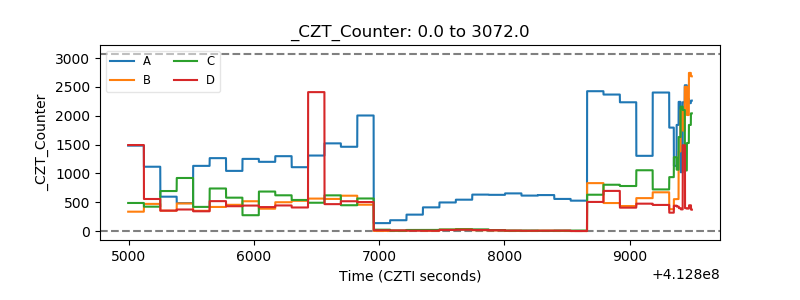 |
| +2.5 Volts monitor | 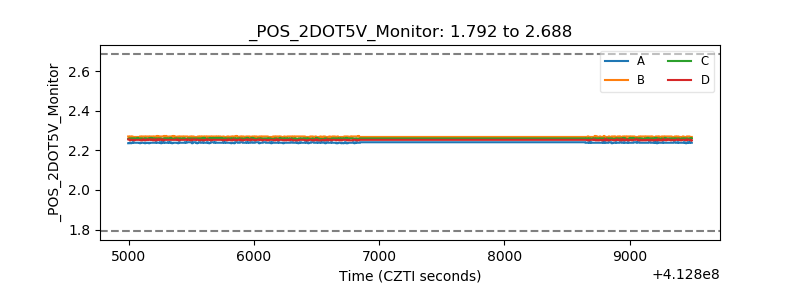 |
| +5 Volts monitor | 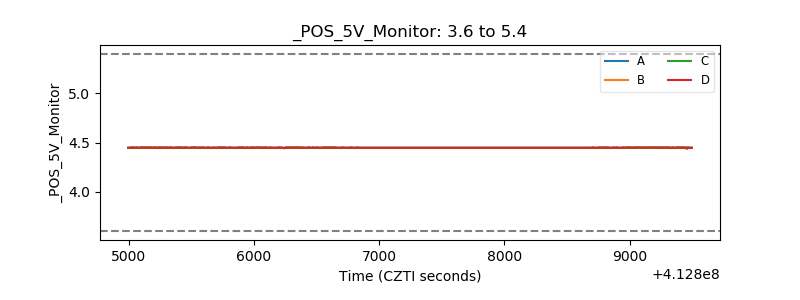 |
| _ROLL_ROT | 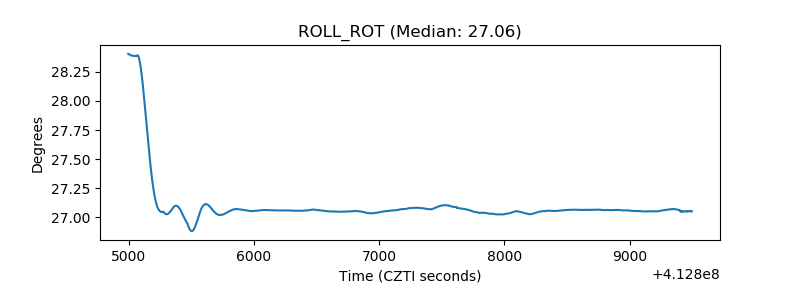 |
| _Roll_DEC | 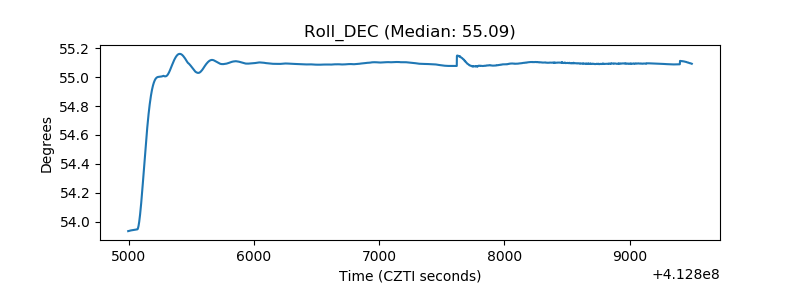 |
| _Roll_RA | 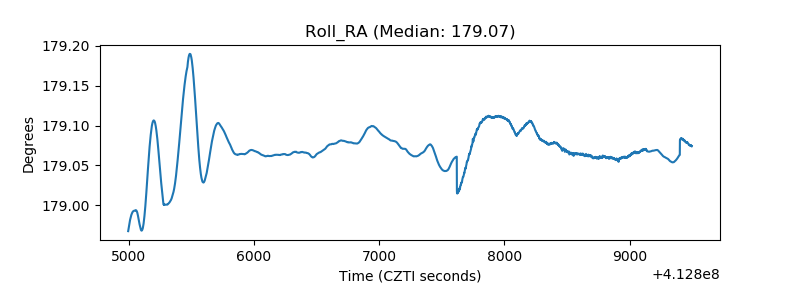 |
| Veto Counter | 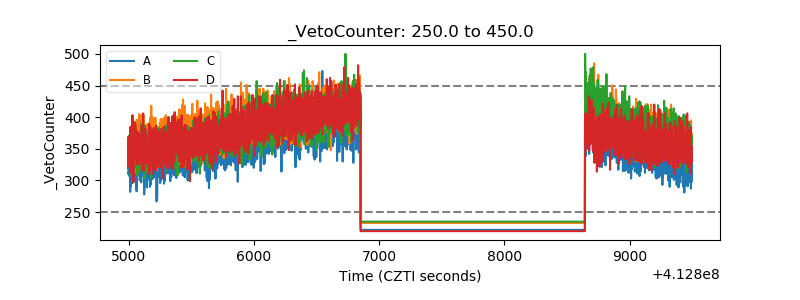 |