| Param | Original file | Final file |
|---|---|---|
| Filename | modeM0/AS1A12_011T22_9000005492_39697cztM0_level2.fits | modeM0/AS1A12_011T22_9000005492_39697cztM0_level2_quad_clean.evt |
| Size (bytes) | 611,642,880 | 85,809,600 |
| Size | 583.3 MB | 81.8 MB |
| Events in quadrant A | 10,375,377 | 430,763 |
| Events in quadrant B | 3,301,116 | 628,238 |
| Events in quadrant C | 5,613,182 | 575,873 |
| Events in quadrant D | 2,911,760 | 566,584 |
| Mode M0 | |||
|---|---|---|---|
| Quadrant | BADHDUFLAG | Total packets | Discarded packets |
| A | 0 | 34728 | 2 |
| B | 0 | 13743 | 1 |
| C | 0 | 20547 | 1 |
| D | 0 | 12819 | 1 |
| Mode SS | |||
|---|---|---|---|
| Quadrant | BADHDUFLAG | Total packets | Discarded packets |
| A | 0 | 114 | 0 |
| B | 0 | 114 | 0 |
| C | 0 | 114 | 0 |
| D | 0 | 114 | 0 |
| Mode M9 | |||
|---|---|---|---|
| Quadrant | BADHDUFLAG | Total packets | Discarded packets |
| A | 0 | 31 | 0 |
| B | 0 | 31 | 0 |
| C | 0 | 31 | 0 |
| D | 0 | 32 | 0 |
| Quadrant | Total seconds | Saturated seconds | Saturation percentage |
|---|---|---|---|
| A | 5672 | 2434 | 42.912553% |
| B | 5672 | 222 | 3.913963% |
| C | 5672 | 526 | 9.273625% |
| D | 5672 | 105 | 1.851199% |
Noise dominated data is calculated using 1-second bins in cleaned event files. If a bin has >2000 counts, and if more than 50% of those come from <1% of pixels, then it is considered to be noise-dominated and hence unusable.
| Quadrant | # 1 sec bins | Bins with >0 counts | Bins with >2000 counts | High rate bins dominated by noise | Noise dominated (total time) | Noise dominated (detector-on time) | Marked lightcurve |
|---|---|---|---|---|---|---|---|
| A | 7134 | 5673 | 2315 | 2315 | 32.45% | 40.81% | 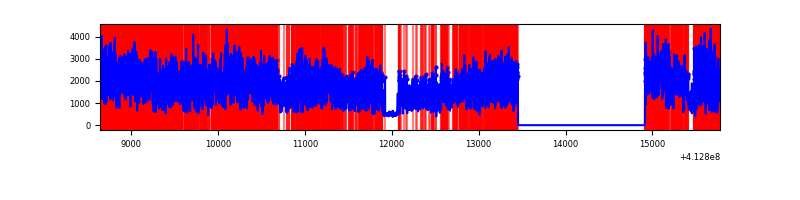 |
| B | 7134 | 5673 | 151 | 151 | 2.12% | 2.66% | 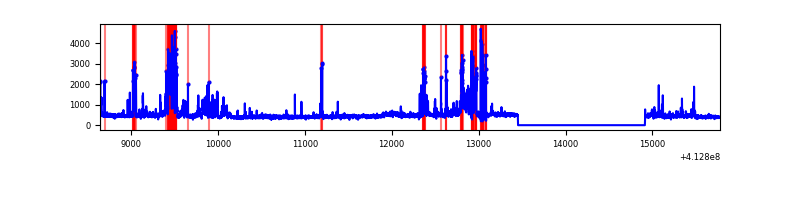 |
| C | 7134 | 5673 | 588 | 588 | 8.24% | 10.36% | 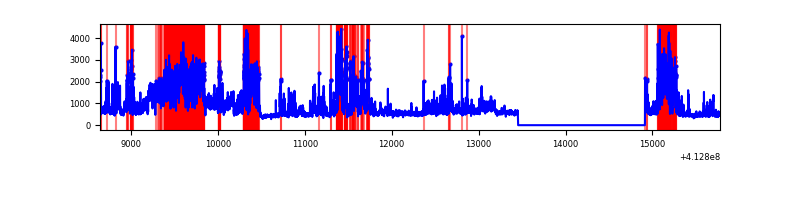 |
| D | 7134 | 5673 | 91 | 91 | 1.28% | 1.60% | 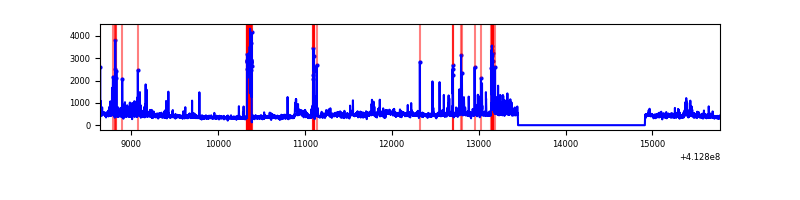 |
Top three noisy pixels from each quadrant. If the there are fewer than three noisy pixels in the level2.evt file, extra rows are filled as -1
| Pixel properties | Quadrant properties | ||||||
|---|---|---|---|---|---|---|---|
| Quadrant | DetID | PixID | Counts | Sigma | Mean | Median | Sigma |
| A | 15 | 222 | 6849438 | 61573.49 | 544 | 533 | 111.2 |
| A | 6 | 10 | 772809 | 6942.97 | 544 | 533 | 111.2 |
| A | 10 | 83 | 380408 | 3415.18 | 544 | 533 | 111.2 |
| B | 5 | 172 | 515261 | 4368.03 | 603 | 586 | 117.8 |
| B | 10 | 246 | 341016 | 2889.22 | 603 | 586 | 117.8 |
| B | 0 | 230 | 47314 | 396.58 | 603 | 586 | 117.8 |
| C | 15 | 208 | 1845852 | 13673.43 | 581 | 585 | 135.0 |
| C | 9 | 187 | 1232668 | 9129.73 | 581 | 585 | 135.0 |
| C | 15 | 214 | 227877 | 1684.23 | 581 | 585 | 135.0 |
| D | 2 | 153 | 228086 | 1575.98 | 590 | 573 | 144.4 |
| D | 12 | 227 | 152610 | 1053.16 | 590 | 573 | 144.4 |
| D | 12 | 233 | 148013 | 1021.32 | 590 | 573 | 144.4 |
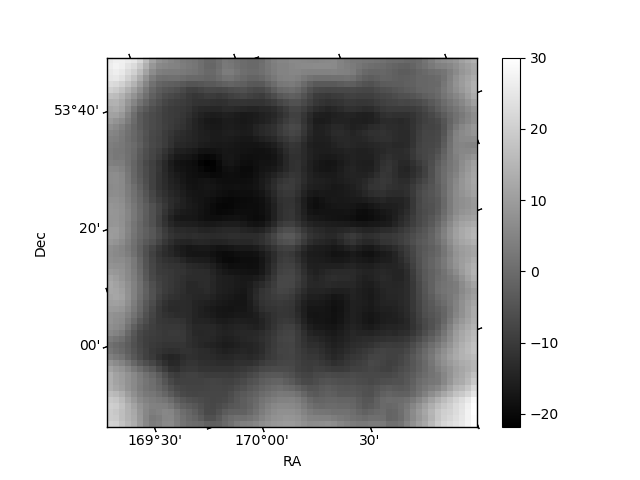
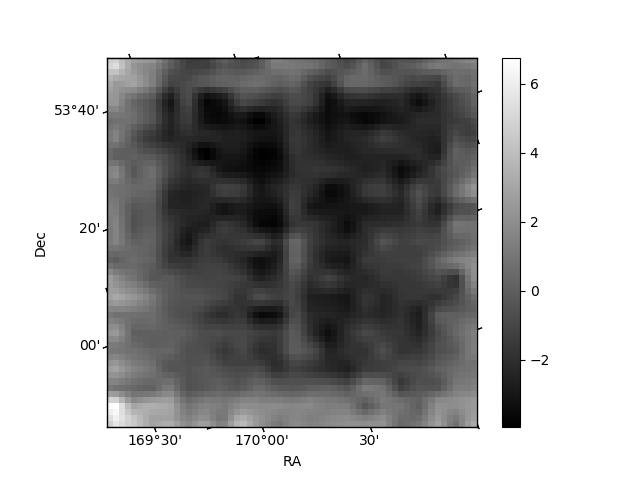
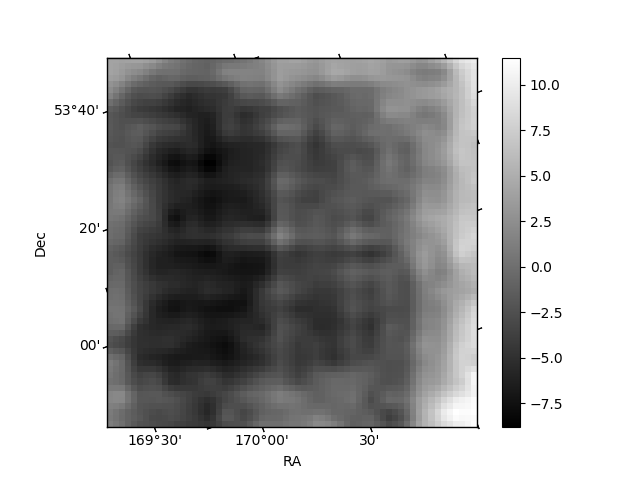
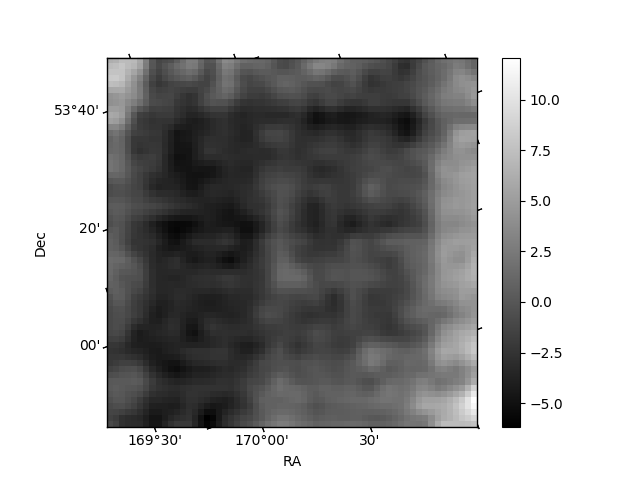
Histogram calculated using DETX and DETY for each event in the final _common_clean file
| Quadrant A | 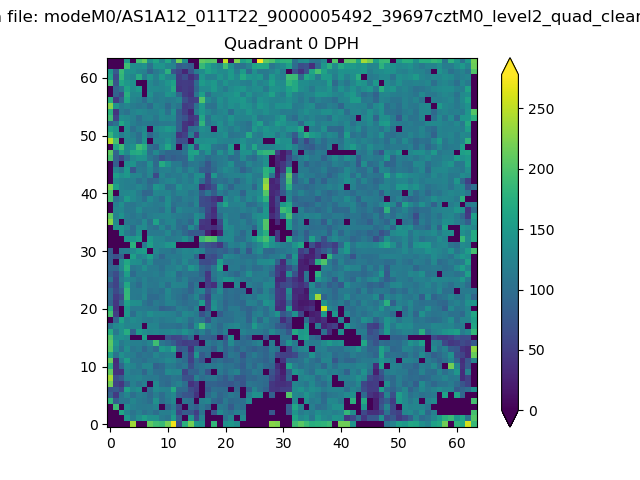 |
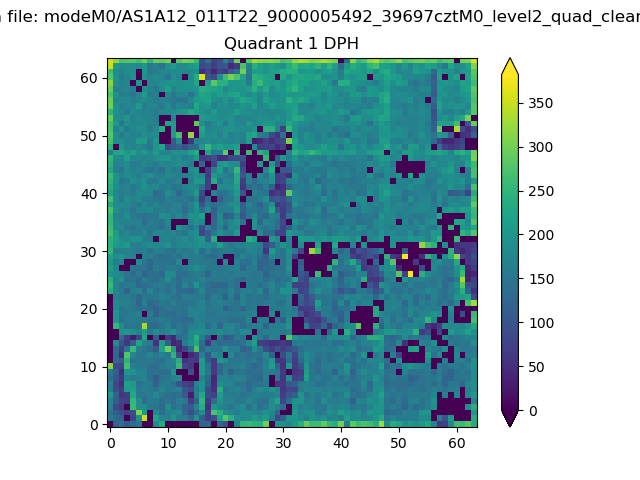 |
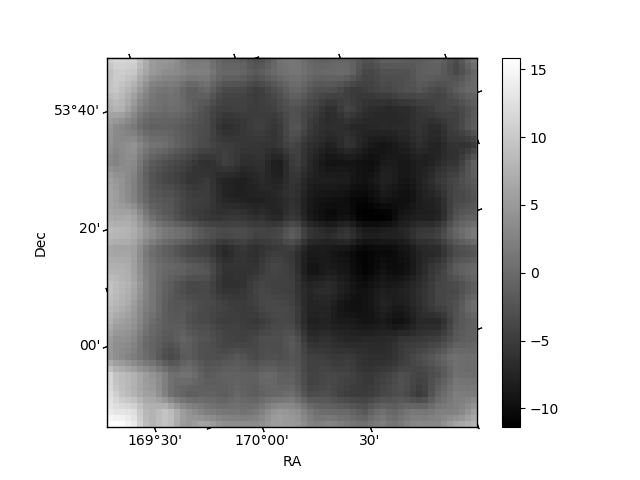
Quadrant B |
|---|---|---|---|
| Quadrant D | 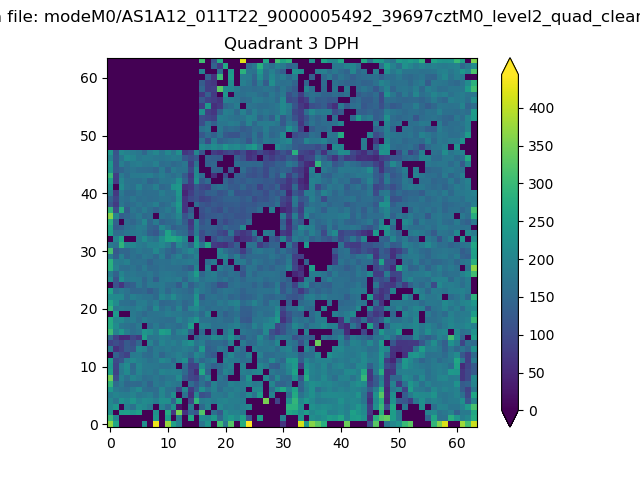 |
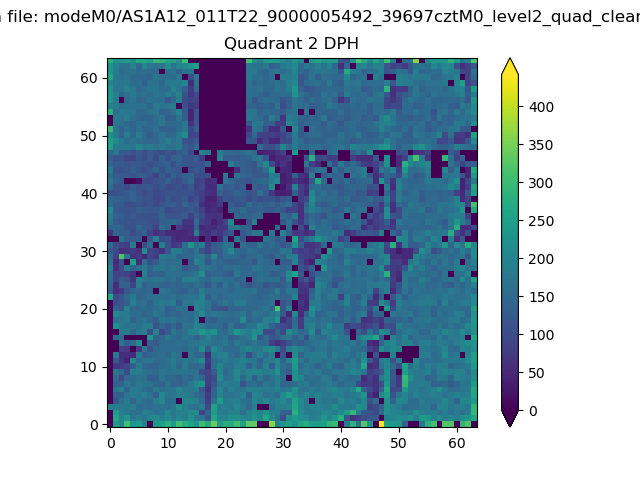 |
Quadrant C |
| Plot type | Count rate plots | Images |
|---|---|---|
| Comparison with Poisson distribution Blue bars denote a histogram of data divided into 1 sec bins. Red curve is a Poisson curve with rate = median count rate of data. |
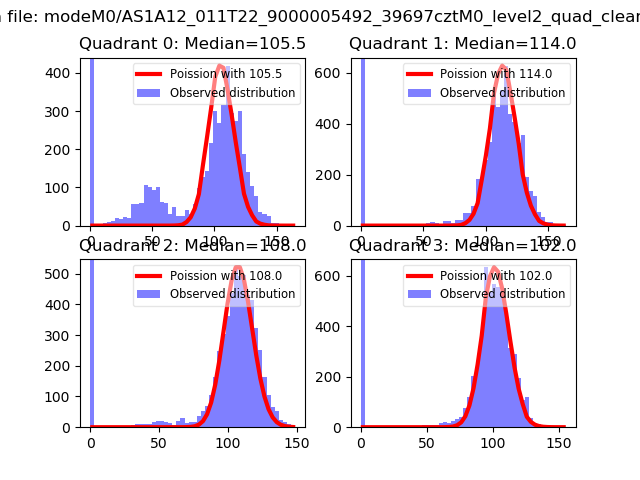 |
 |
| Quadrant-wise count rates Data is divided into 100 sec bins |
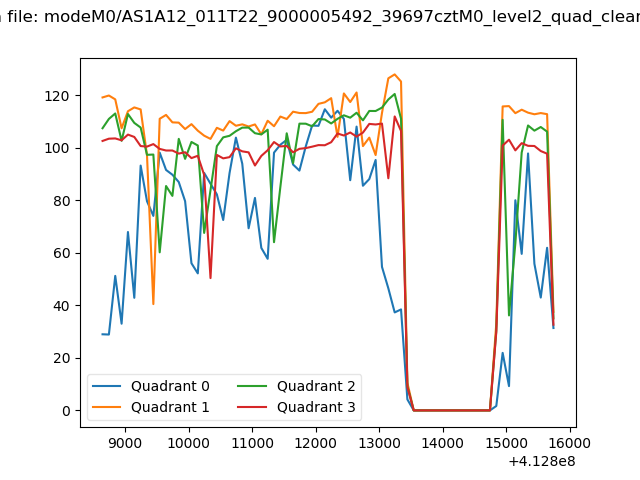 |
|
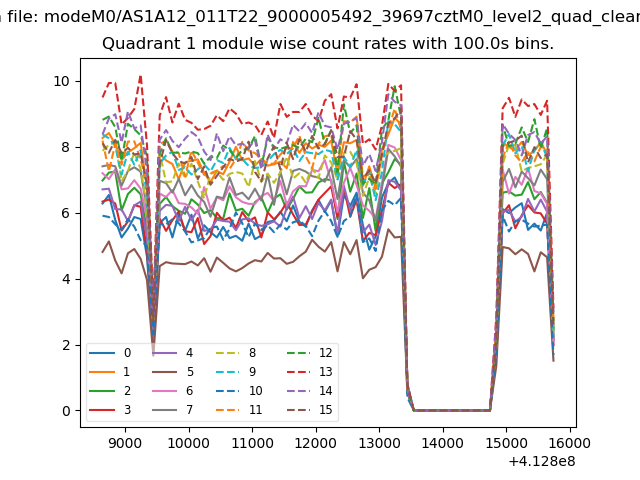
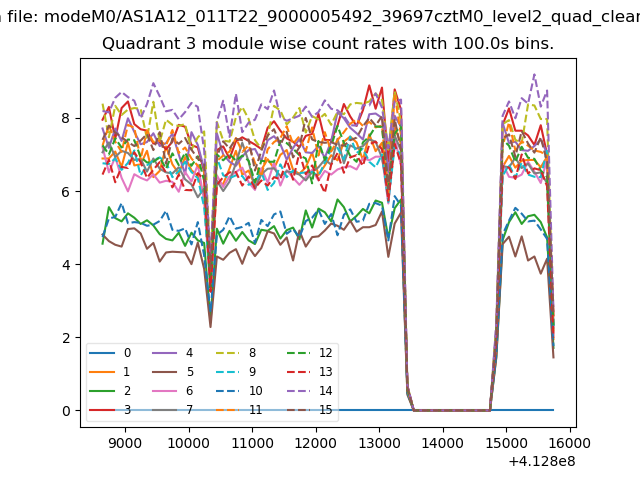
| Module-wise count rates for Quadrant A Data is divided into 100 sec bins |
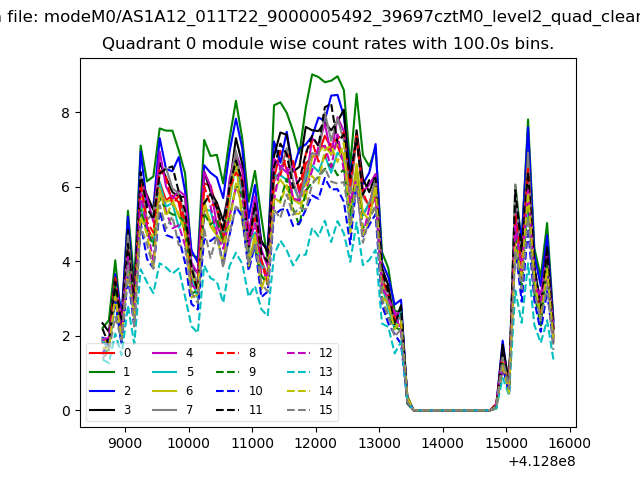 |
 |
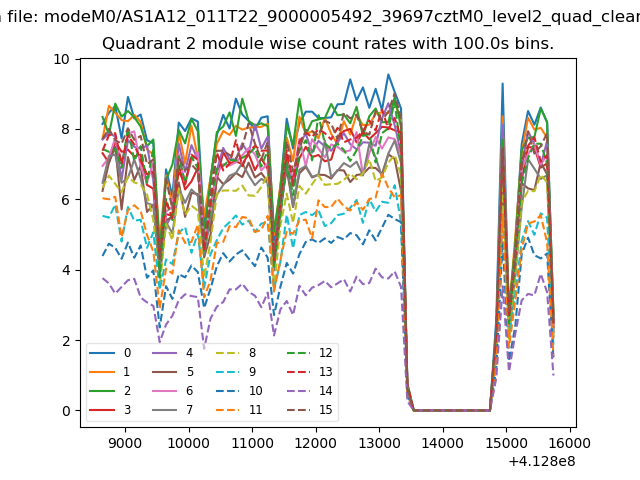
| Module-wise count rates for Quadrant B Data is divided into 100 sec bins |
 |
 |
| Module-wise count rates for Quadrant C Data is divided into 100 sec bins |
 |
 |
| Module-wise count rates for Quadrant D Data is divided into 100 sec bins |
 |
 |
| Parameter | Plot |
|---|---|
| CZT HV Monitor | 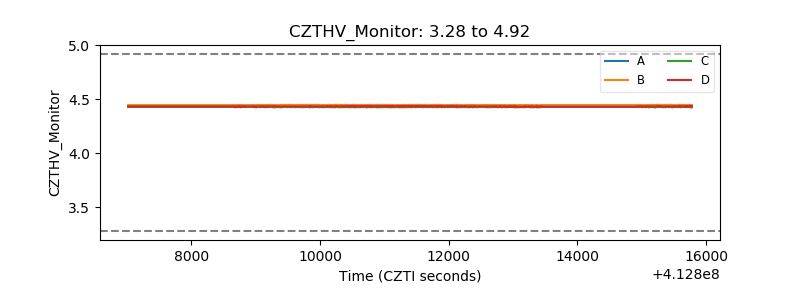 |
| D_VDD | 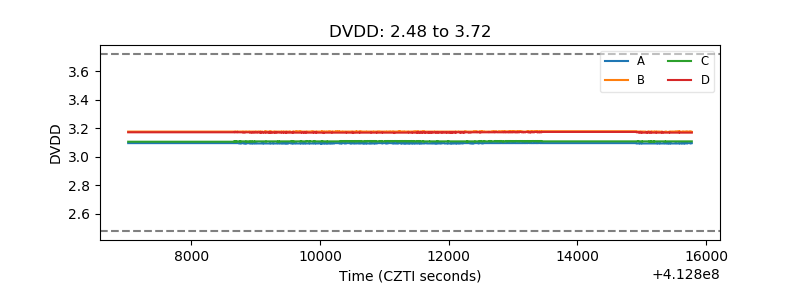 |
| Temperature 1 | 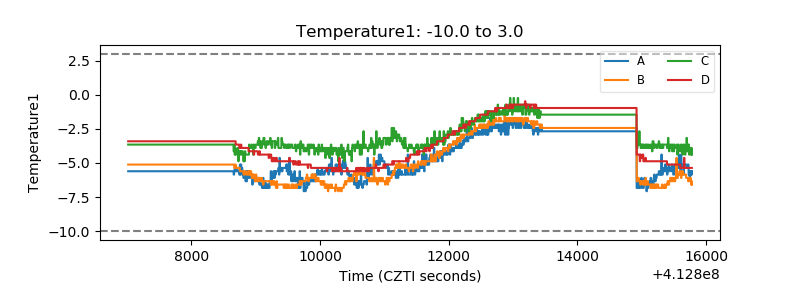 |
| Veto HV Monitor | 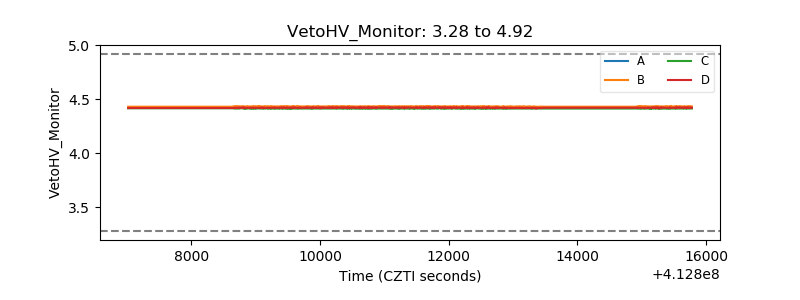 |
| Veto LLD | 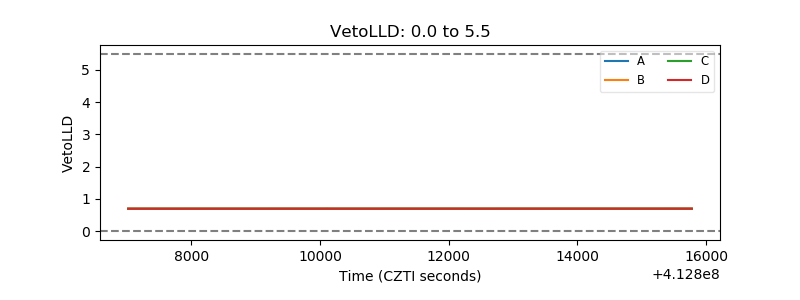 |
| Alpha Counter | 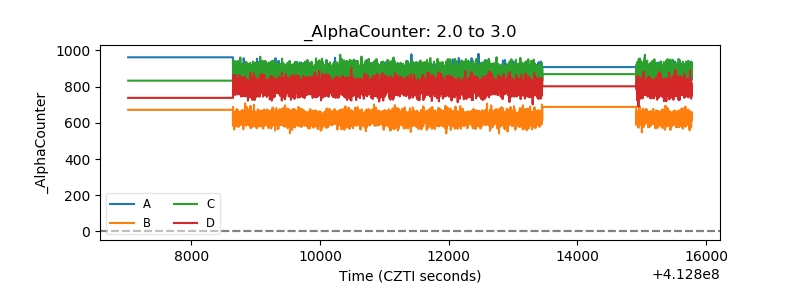 |
| _CPM_Rate | 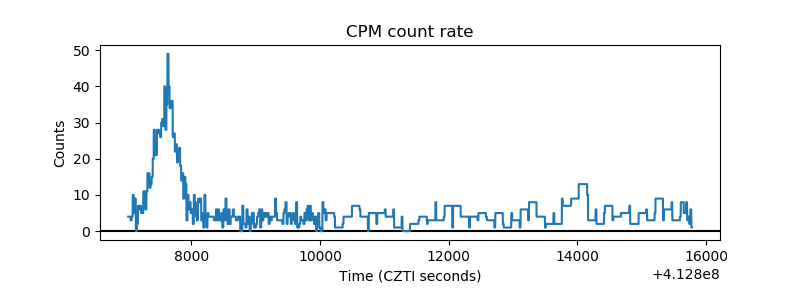 |
| CZT Counter | 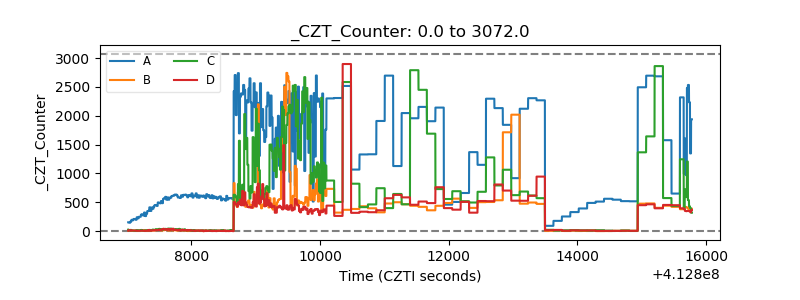 |
| +2.5 Volts monitor | 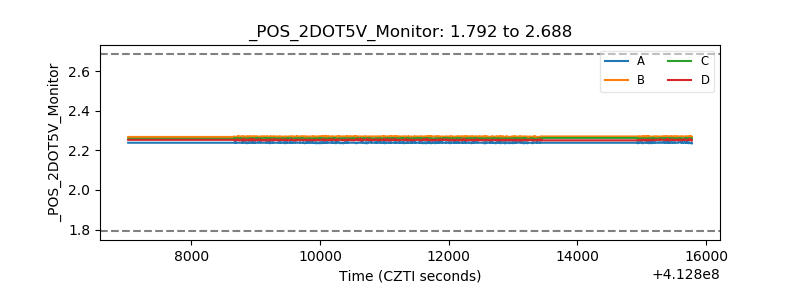 |
| +5 Volts monitor | 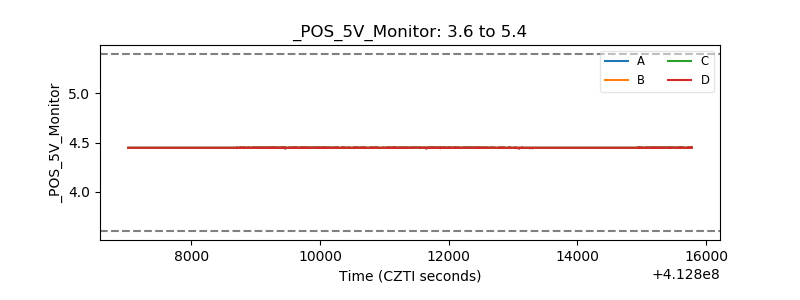 |
| _ROLL_ROT | 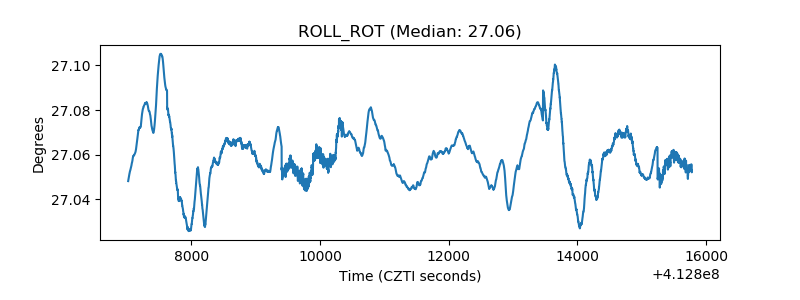 |
| _Roll_DEC | 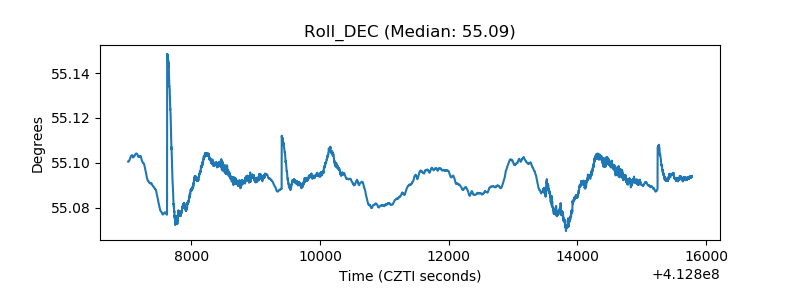 |
| _Roll_RA | 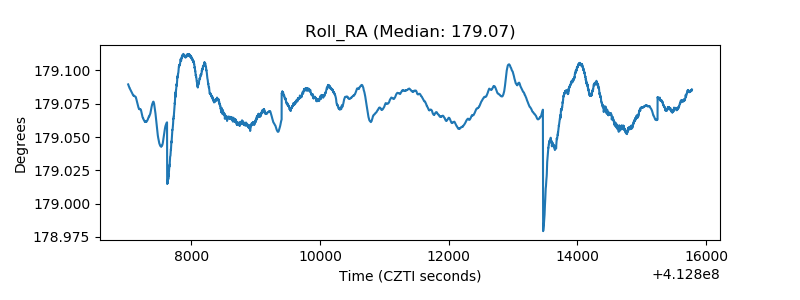 |
| Veto Counter | 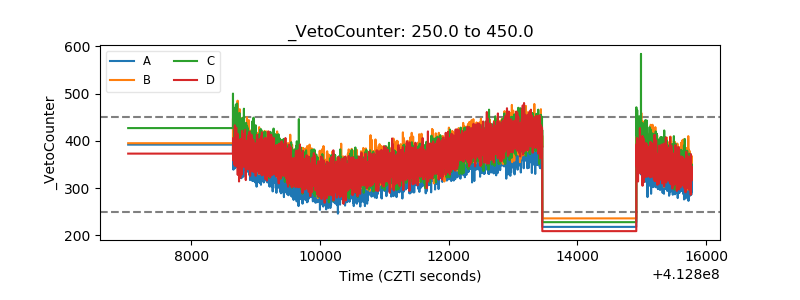 |