| Param | Original file | Final file |
|---|---|---|
| Filename | modeM0/AS1A12_011T22_9000005492_39698cztM0_level2.fits | modeM0/AS1A12_011T22_9000005492_39698cztM0_level2_quad_clean.evt |
| Size (bytes) | 579,147,840 | 87,197,760 |
| Size | 552.3 MB | 83.2 MB |
| Events in quadrant A | 10,383,690 | 399,701 |
| Events in quadrant B | 3,177,768 | 634,265 |
| Events in quadrant C | 4,581,370 | 611,511 |
| Events in quadrant D | 2,838,601 | 583,895 |
| Mode M0 | |||
|---|---|---|---|
| Quadrant | BADHDUFLAG | Total packets | Discarded packets |
| A | 0 | 34940 | 2 |
| B | 0 | 13637 | 1 |
| C | 0 | 17716 | 1 |
| D | 0 | 12924 | 1 |
| Mode SS | |||
|---|---|---|---|
| Quadrant | BADHDUFLAG | Total packets | Discarded packets |
| A | 0 | 118 | 0 |
| B | 0 | 118 | 0 |
| C | 0 | 118 | 0 |
| D | 0 | 118 | 0 |
| Mode M9 | |||
|---|---|---|---|
| Quadrant | BADHDUFLAG | Total packets | Discarded packets |
| A | 0 | 20 | 0 |
| B | 0 | 20 | 0 |
| C | 0 | 20 | 0 |
| D | 0 | 21 | 0 |
| Quadrant | Total seconds | Saturated seconds | Saturation percentage |
|---|---|---|---|
| A | 5882 | 2607 | 44.321659% |
| B | 5882 | 317 | 5.389323% |
| C | 5882 | 288 | 4.896294% |
| D | 5882 | 38 | 0.646039% |
Noise dominated data is calculated using 1-second bins in cleaned event files. If a bin has >2000 counts, and if more than 50% of those come from <1% of pixels, then it is considered to be noise-dominated and hence unusable.
| Quadrant | # 1 sec bins | Bins with >0 counts | Bins with >2000 counts | High rate bins dominated by noise | Noise dominated (total time) | Noise dominated (detector-on time) | Marked lightcurve |
|---|---|---|---|---|---|---|---|
| A | 7194 | 5883 | 2263 | 2263 | 31.46% | 38.47% | 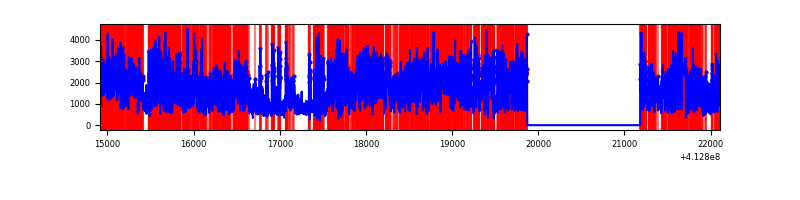 |
| B | 7194 | 5883 | 167 | 167 | 2.32% | 2.84% |  |
| C | 7194 | 5883 | 281 | 281 | 3.91% | 4.78% | 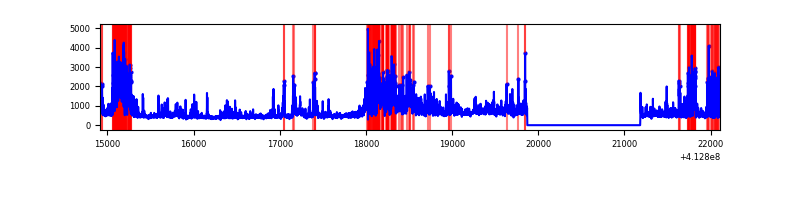 |
| D | 7194 | 5883 | 22 | 22 | 0.31% | 0.37% | 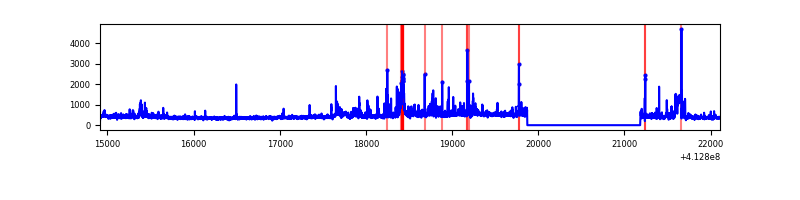 |
Top three noisy pixels from each quadrant. If the there are fewer than three noisy pixels in the level2.evt file, extra rows are filled as -1
| Pixel properties | Quadrant properties | ||||||
|---|---|---|---|---|---|---|---|
| Quadrant | DetID | PixID | Counts | Sigma | Mean | Median | Sigma |
| A | 15 | 222 | 4153109 | 38091.28 | 527 | 516 | 109.0 |
| A | 6 | 10 | 3342140 | 30652.35 | 527 | 516 | 109.0 |
| A | 15 | 174 | 452041 | 4141.79 | 527 | 516 | 109.0 |
| B | 10 | 246 | 662304 | 5547.92 | 607 | 590 | 119.3 |
| B | 5 | 172 | 63529 | 527.69 | 607 | 590 | 119.3 |
| B | 5 | 255 | 52178 | 432.52 | 607 | 590 | 119.3 |
| C | 9 | 187 | 1681650 | 11861.09 | 609 | 613 | 141.7 |
| C | 15 | 208 | 240912 | 1695.51 | 609 | 613 | 141.7 |
| C | 15 | 214 | 237171 | 1669.11 | 609 | 613 | 141.7 |
| D | 13 | 249 | 191772 | 1276.25 | 616 | 598 | 149.8 |
| D | 2 | 250 | 115869 | 769.53 | 616 | 598 | 149.8 |
| D | 12 | 233 | 84448 | 559.77 | 616 | 598 | 149.8 |
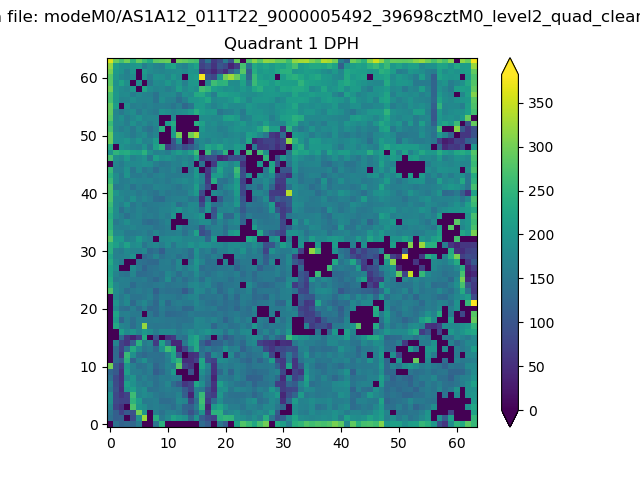
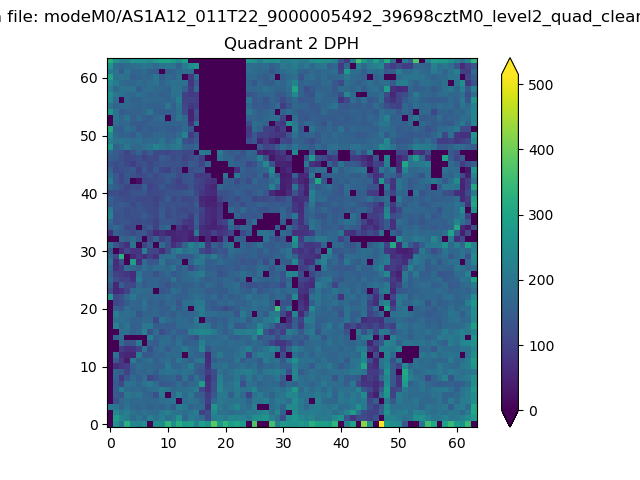
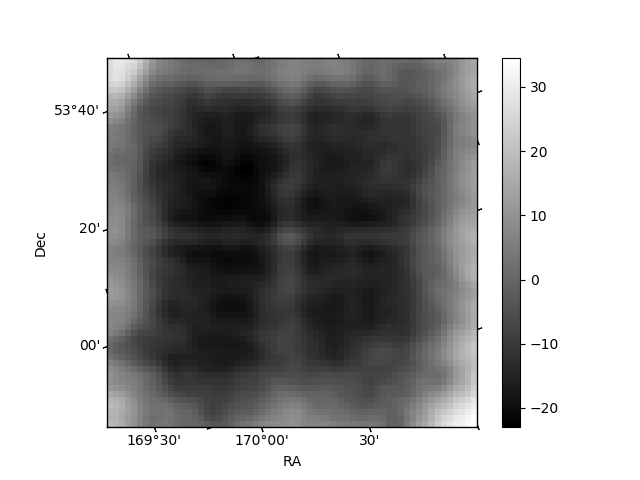
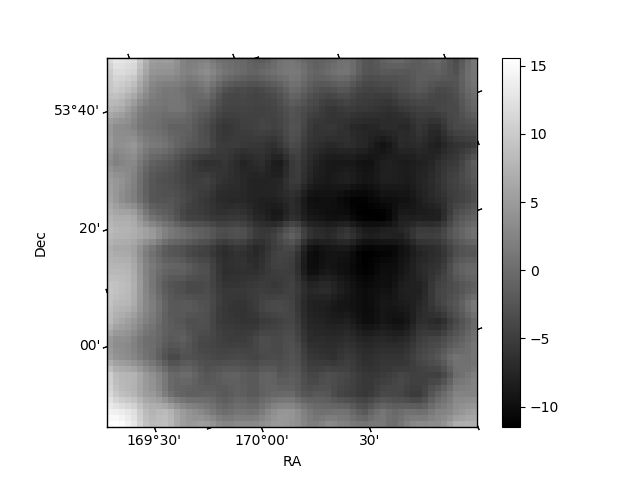
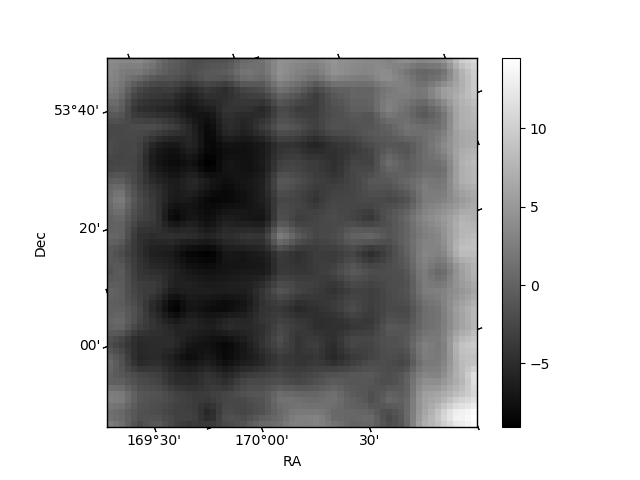
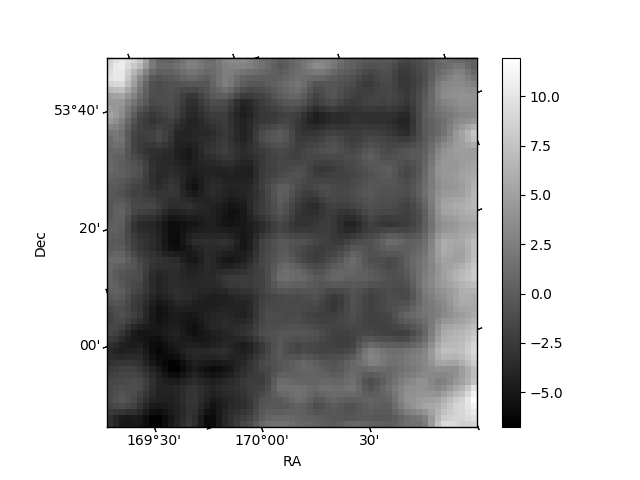
Histogram calculated using DETX and DETY for each event in the final _common_clean file
| Quadrant A | 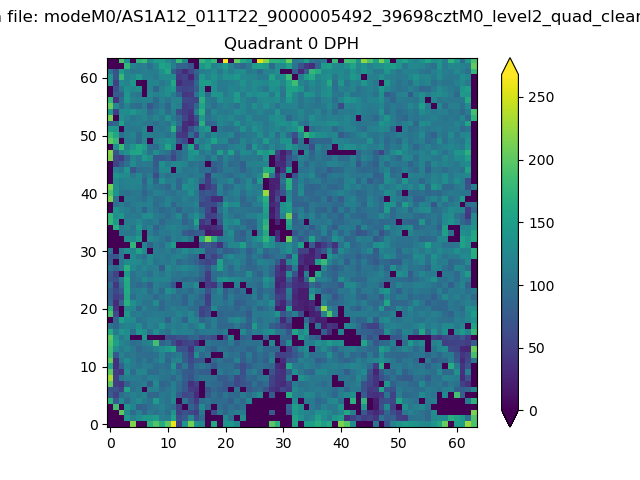 |
 |
Quadrant B |
|---|---|---|---|
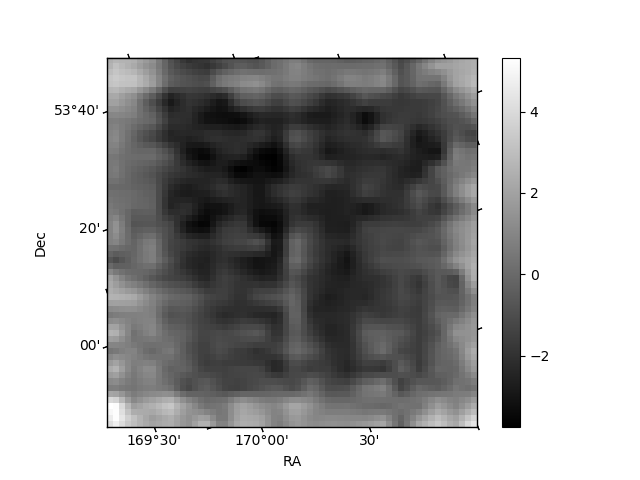
| Quadrant D | 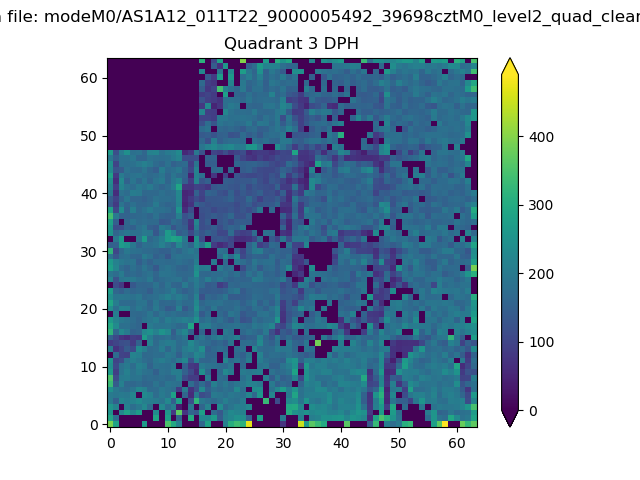 |
 |
Quadrant C |
| Plot type | Count rate plots | Images |
|---|---|---|
| Comparison with Poisson distribution Blue bars denote a histogram of data divided into 1 sec bins. Red curve is a Poisson curve with rate = median count rate of data. |
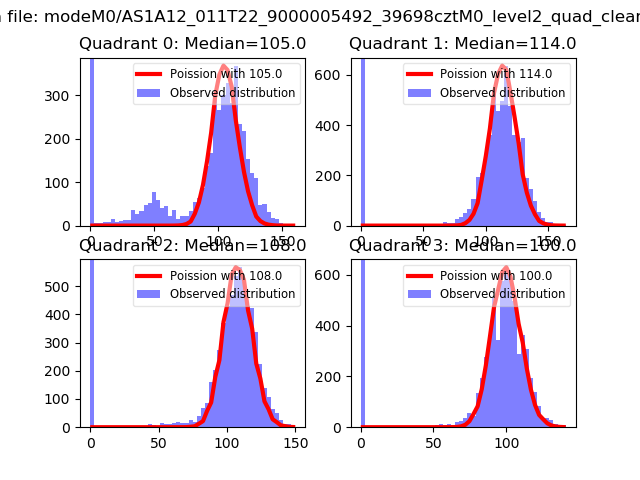 |
 |
| Quadrant-wise count rates Data is divided into 100 sec bins |
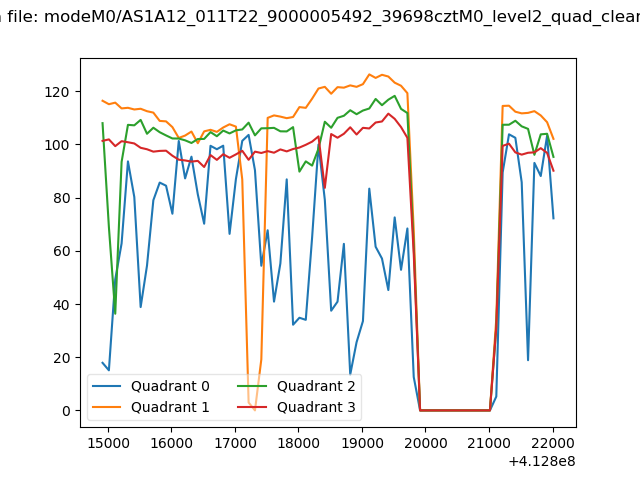 |
|
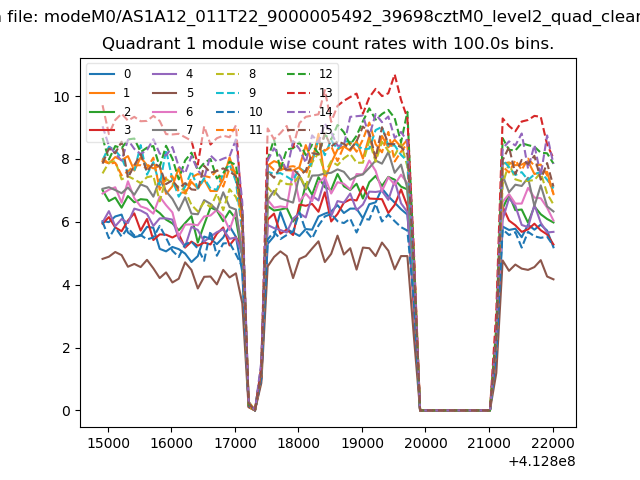
| Module-wise count rates for Quadrant A Data is divided into 100 sec bins |
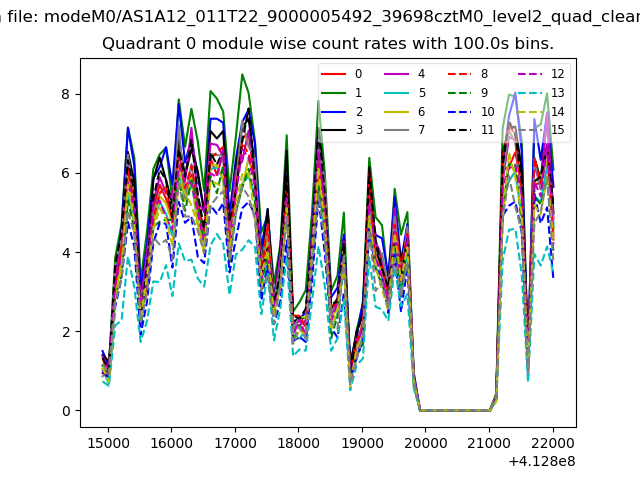 |
 |
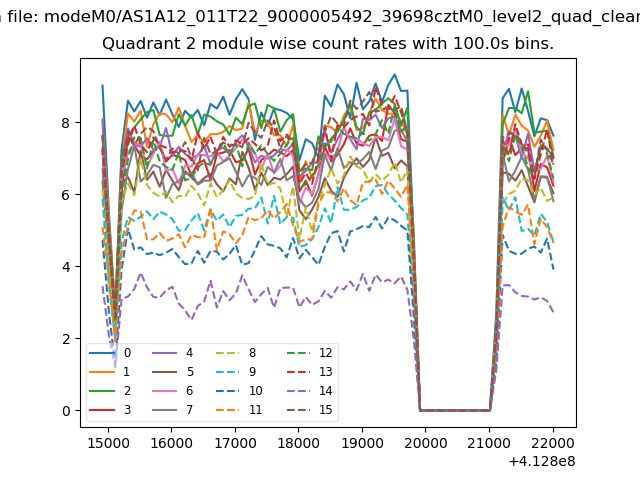
| Module-wise count rates for Quadrant B Data is divided into 100 sec bins |
 |
 |
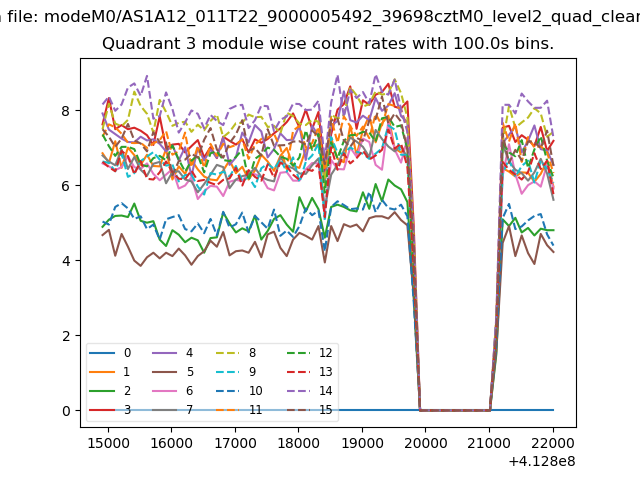
| Module-wise count rates for Quadrant C Data is divided into 100 sec bins |
 |
 |
| Module-wise count rates for Quadrant D Data is divided into 100 sec bins |
 |
 |
| Parameter | Plot |
|---|---|
| CZT HV Monitor | 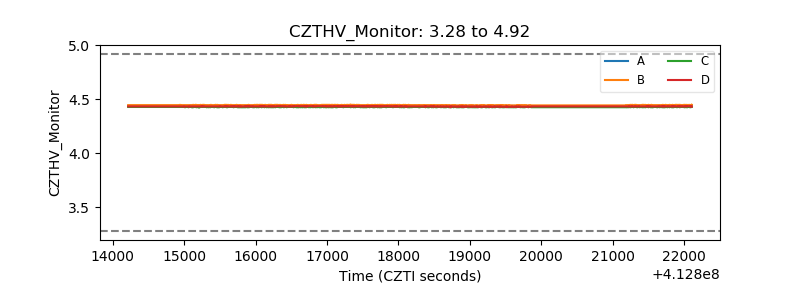 |
| D_VDD | 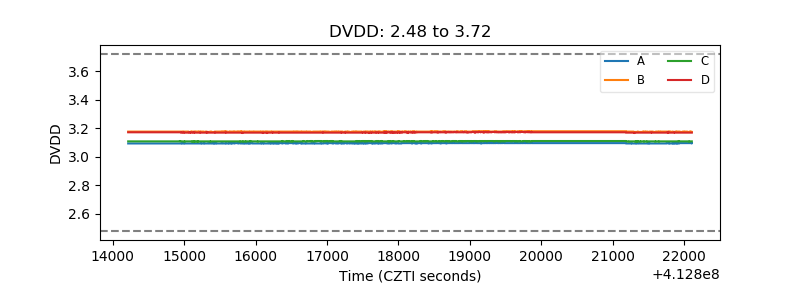 |
| Temperature 1 | 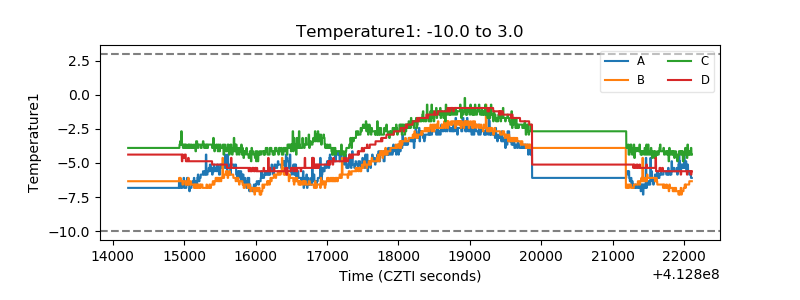 |
| Veto HV Monitor | 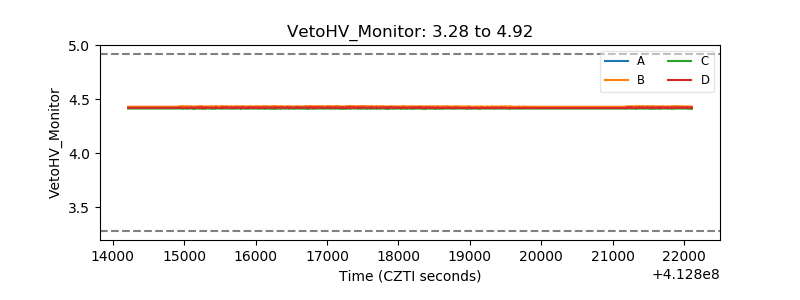 |
| Veto LLD | 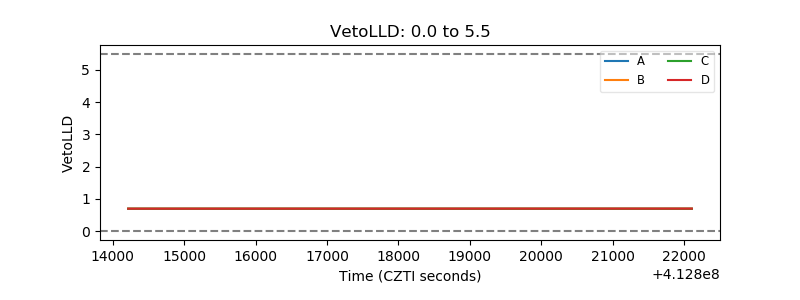 |
| Alpha Counter | 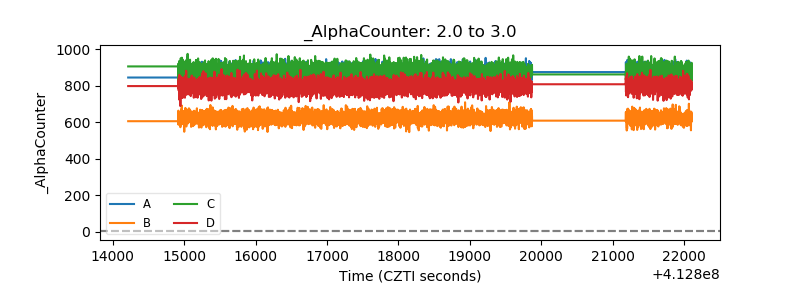 |
| _CPM_Rate | 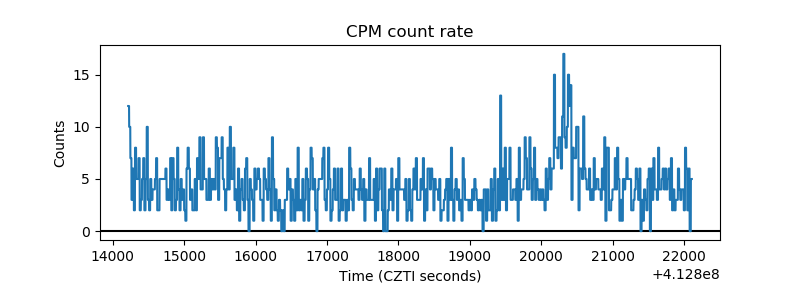 |
| CZT Counter | 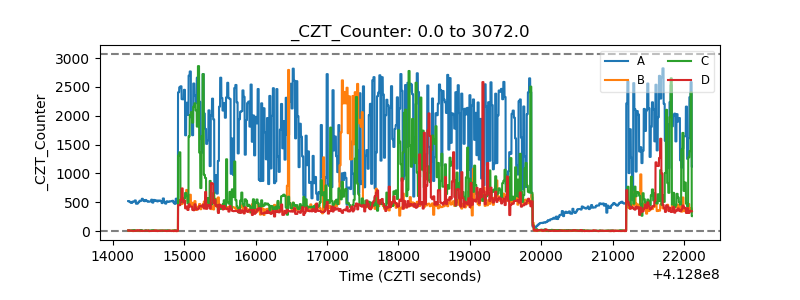 |
| +2.5 Volts monitor |  |
| +5 Volts monitor | 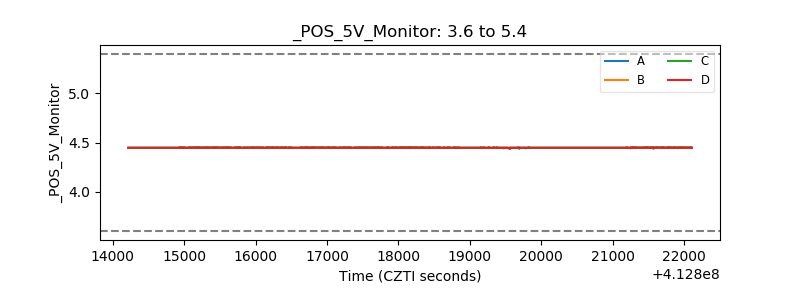 |
| _ROLL_ROT | 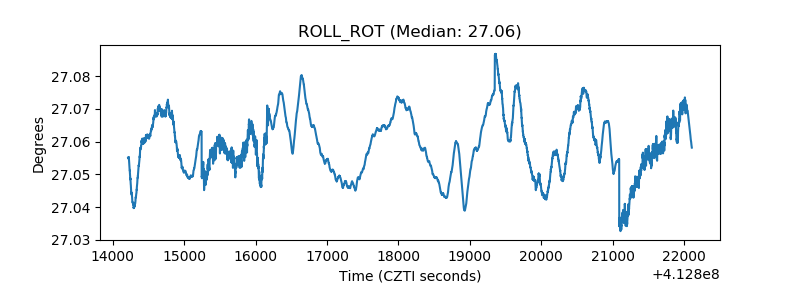 |
| _Roll_DEC | 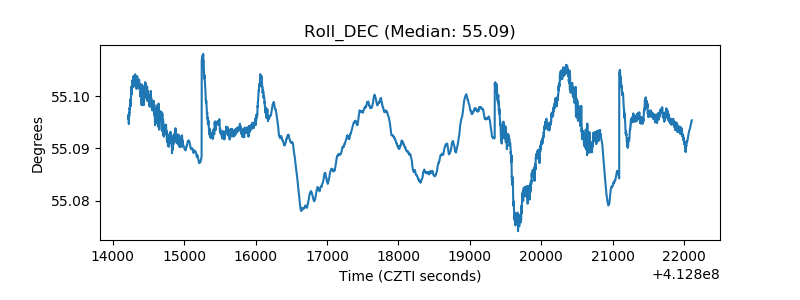 |
| _Roll_RA | 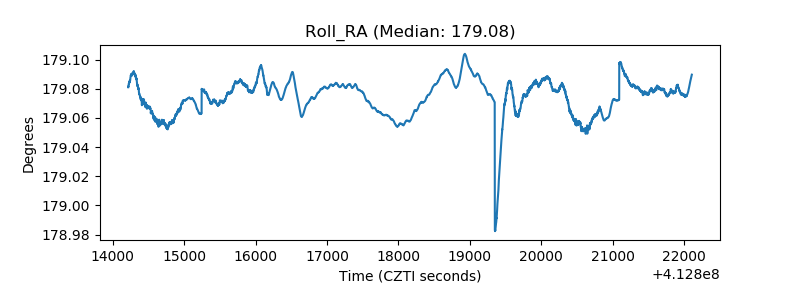 |
| Veto Counter | 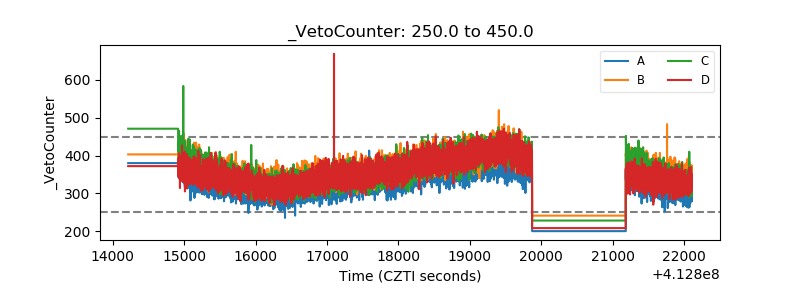 |