| Param | Original file | Final file |
|---|---|---|
| Filename | modeM0/AS1A12_011T22_9000005492_39701cztM0_level2.fits | modeM0/AS1A12_011T22_9000005492_39701cztM0_level2_quad_clean.evt |
| Size (bytes) | 1,599,312,960 | 244,143,360 |
| Size | 1.5 GB | 232.8 MB |
| Events in quadrant A | 23,775,839 | 1,430,954 |
| Events in quadrant B | 10,215,075 | 1,695,525 |
| Events in quadrant C | 13,573,294 | 1,634,042 |
| Events in quadrant D | 10,401,142 | 1,523,674 |
| Mode M0 | |||
|---|---|---|---|
| Quadrant | BADHDUFLAG | Total packets | Discarded packets |
| A | 0 | 81935 | 5 |
| B | 0 | 41718 | 4 |
| C | 0 | 51199 | 4 |
| D | 0 | 42412 | 4 |
| Mode SS | |||
|---|---|---|---|
| Quadrant | BADHDUFLAG | Total packets | Discarded packets |
| A | 0 | 330 | 0 |
| B | 0 | 330 | 0 |
| C | 0 | 330 | 0 |
| D | 0 | 330 | 0 |
| Mode M9 | |||
|---|---|---|---|
| Quadrant | BADHDUFLAG | Total packets | Discarded packets |
| A | 0 | 54 | 0 |
| B | 0 | 54 | 0 |
| C | 0 | 54 | 0 |
| D | 0 | 54 | 0 |
| Quadrant | Total seconds | Saturated seconds | Saturation percentage |
|---|---|---|---|
| A | 16042 | 3926 | 24.473258% |
| B | 16042 | 883 | 5.504301% |
| C | 16042 | 901 | 5.616507% |
| D | 16042 | 667 | 4.157836% |
Noise dominated data is calculated using 1-second bins in cleaned event files. If a bin has >2000 counts, and if more than 50% of those come from <1% of pixels, then it is considered to be noise-dominated and hence unusable.
| Quadrant | # 1 sec bins | Bins with >0 counts | Bins with >2000 counts | High rate bins dominated by noise | Noise dominated (total time) | Noise dominated (detector-on time) | Marked lightcurve |
|---|---|---|---|---|---|---|---|
| A | 21470 | 16046 | 3442 | 3442 | 16.03% | 21.45% | 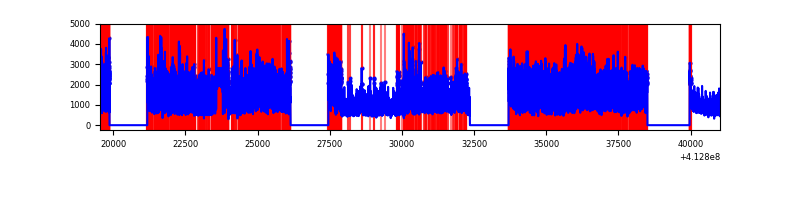 |
| B | 21470 | 16045 | 533 | 533 | 2.48% | 3.32% | 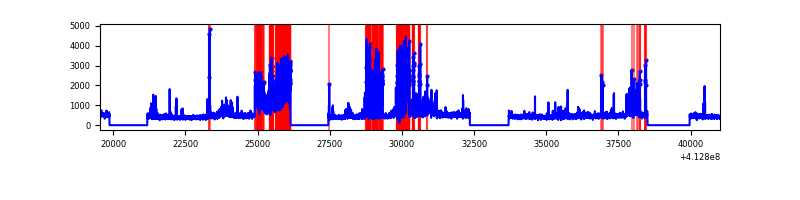 |
| C | 21470 | 16046 | 788 | 788 | 3.67% | 4.91% | 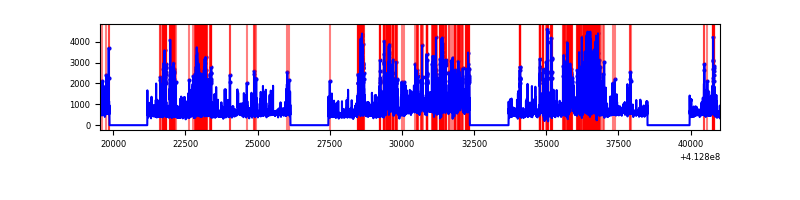 |
| D | 21470 | 16046 | 554 | 554 | 2.58% | 3.45% | 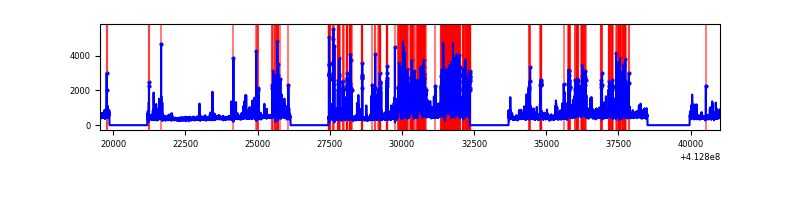 |
Top three noisy pixels from each quadrant. If the there are fewer than three noisy pixels in the level2.evt file, extra rows are filled as -1
| Pixel properties | Quadrant properties | ||||||
|---|---|---|---|---|---|---|---|
| Quadrant | DetID | PixID | Counts | Sigma | Mean | Median | Sigma |
| A | 15 | 222 | 13779662 | 41294.24 | 1639 | 1608 | 333.7 |
| A | 15 | 174 | 2046434 | 6128.55 | 1639 | 1608 | 333.7 |
| A | 10 | 83 | 1080378 | 3233.18 | 1639 | 1608 | 333.7 |
| B | 10 | 246 | 2714348 | 8193.64 | 1736 | 1686 | 331.1 |
| B | 0 | 190 | 292066 | 877.1 | 1736 | 1686 | 331.1 |
| B | 5 | 172 | 274732 | 824.74 | 1736 | 1686 | 331.1 |
| C | 9 | 187 | 3420765 | 8676.32 | 1688 | 1697 | 394.1 |
| C | 15 | 208 | 2142152 | 5431.68 | 1688 | 1697 | 394.1 |
| C | 14 | 254 | 753265 | 1907.2 | 1688 | 1697 | 394.1 |
| D | 12 | 227 | 2462191 | 5995.13 | 1700 | 1651 | 410.4 |
| D | 12 | 233 | 485699 | 1179.39 | 1700 | 1651 | 410.4 |
| D | 13 | 249 | 405633 | 984.31 | 1700 | 1651 | 410.4 |
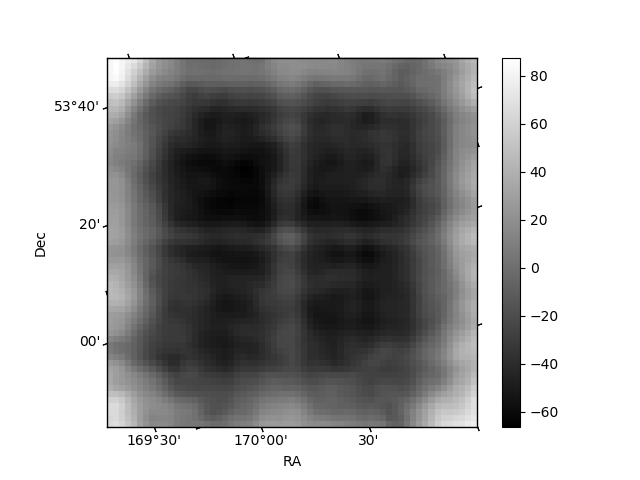
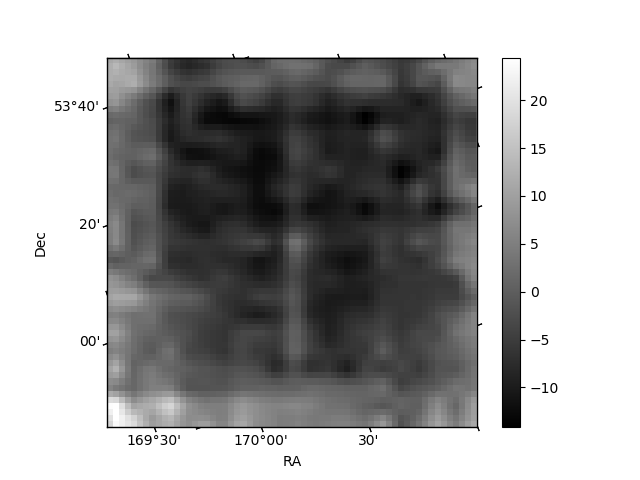
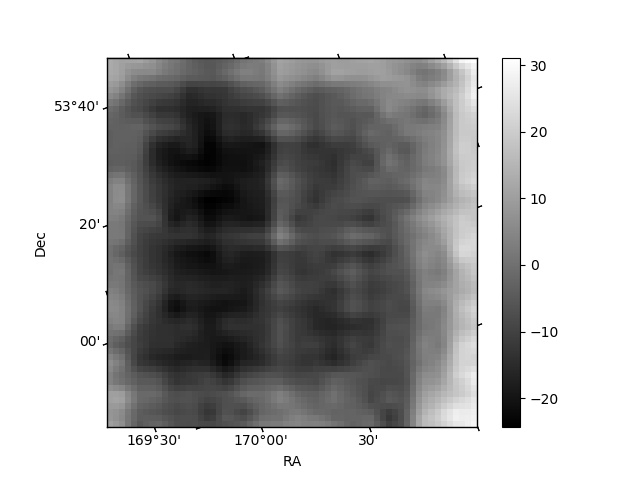
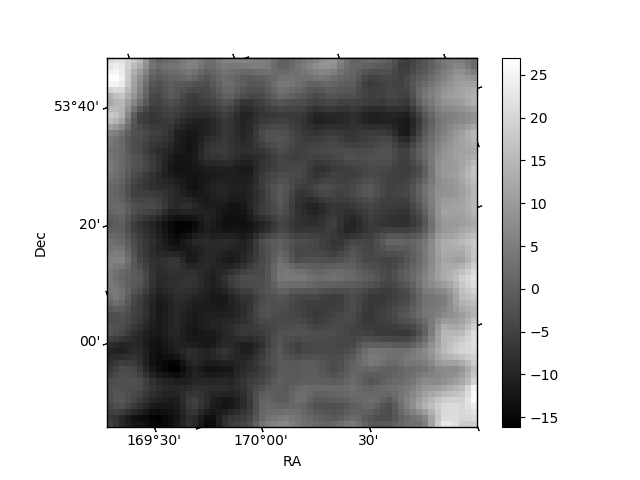
Histogram calculated using DETX and DETY for each event in the final _common_clean file
| Quadrant A | 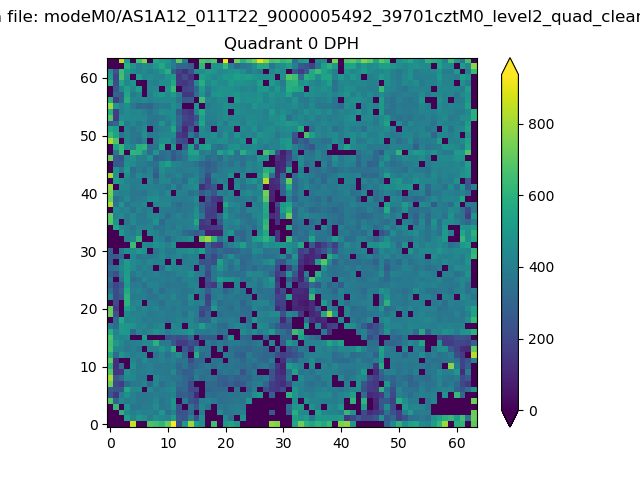 |
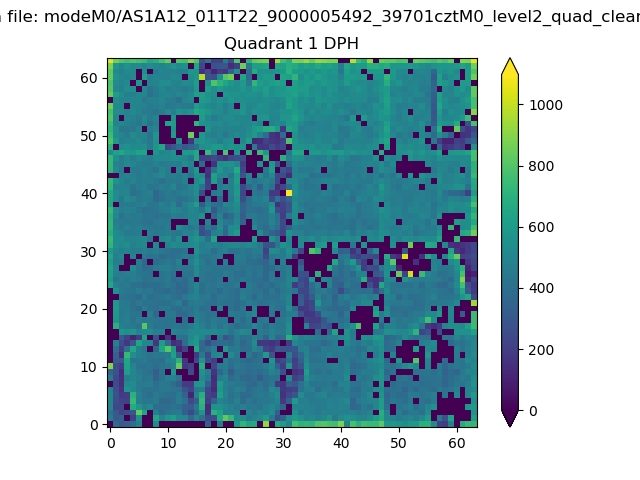 |
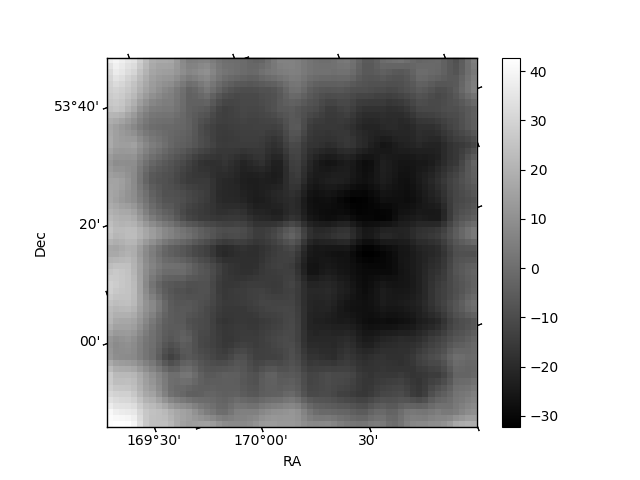
Quadrant B |
|---|---|---|---|
| Quadrant D | 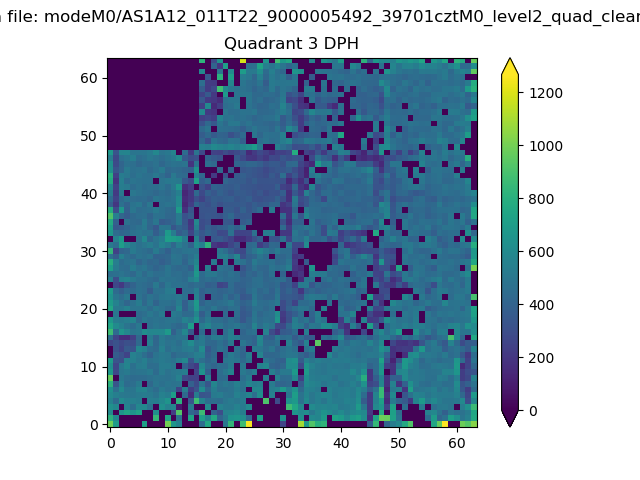 |
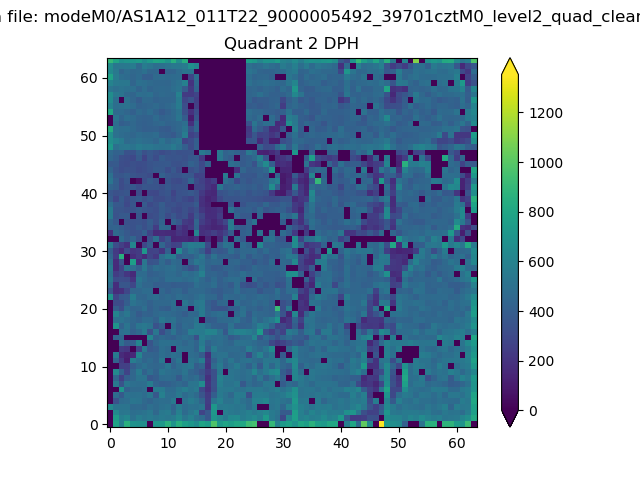 |
Quadrant C |
| Plot type | Count rate plots | Images |
|---|---|---|
| Comparison with Poisson distribution Blue bars denote a histogram of data divided into 1 sec bins. Red curve is a Poisson curve with rate = median count rate of data. |
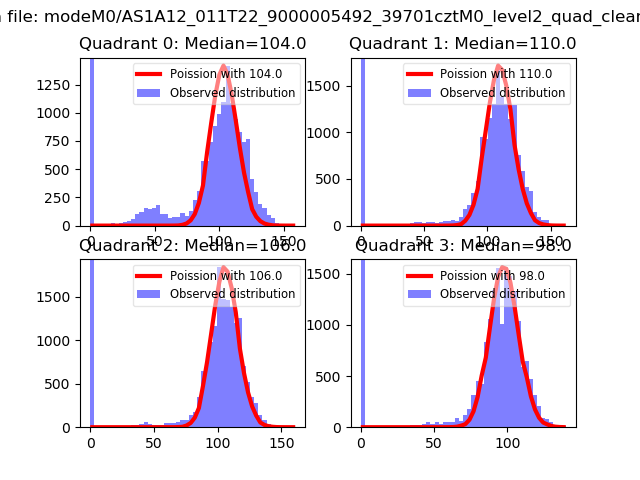 |
 |
| Quadrant-wise count rates Data is divided into 100 sec bins |
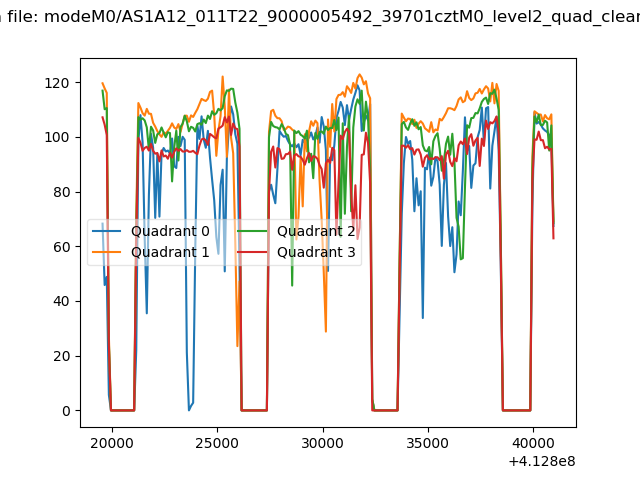 |
|
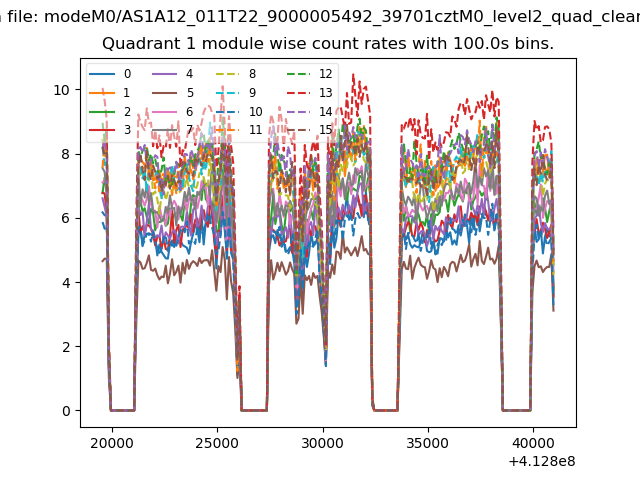
| Module-wise count rates for Quadrant A Data is divided into 100 sec bins |
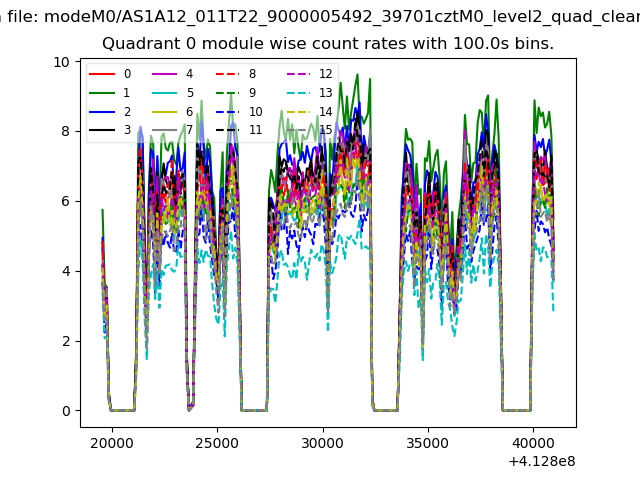 |
 |
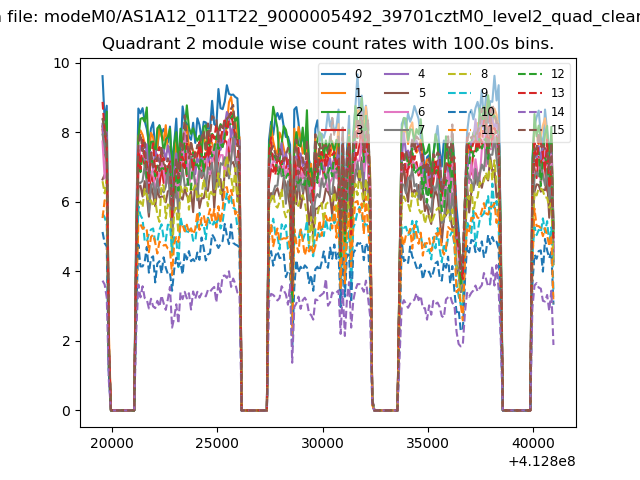
| Module-wise count rates for Quadrant B Data is divided into 100 sec bins |
 |
 |
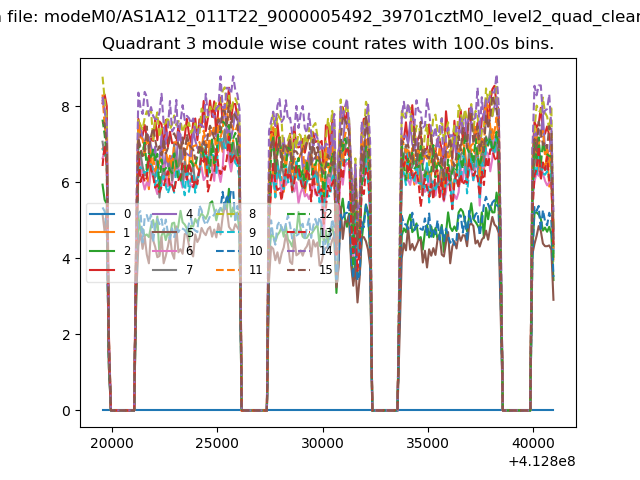
| Module-wise count rates for Quadrant C Data is divided into 100 sec bins |
 |
 |
| Module-wise count rates for Quadrant D Data is divided into 100 sec bins |
 |
 |
| Parameter | Plot |
|---|---|
| CZT HV Monitor | 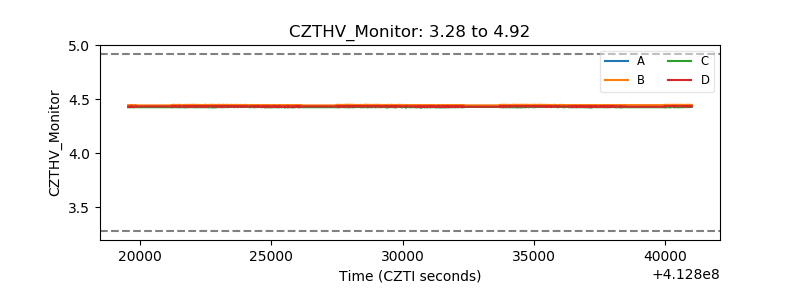 |
| D_VDD | 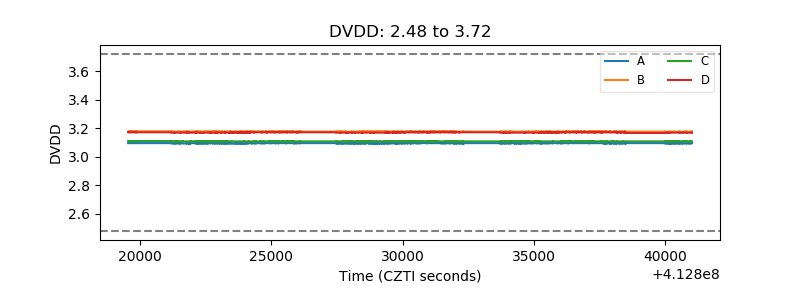 |
| Temperature 1 | 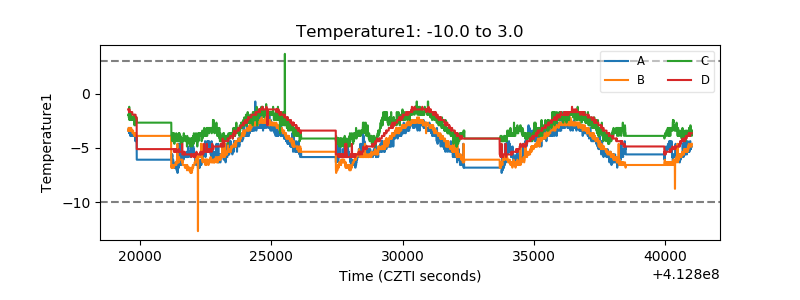 |
| Veto HV Monitor |  |
| Veto LLD | 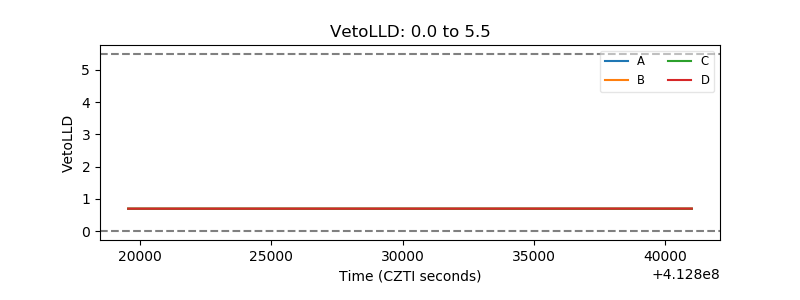 |
| Alpha Counter |  |
| _CPM_Rate | 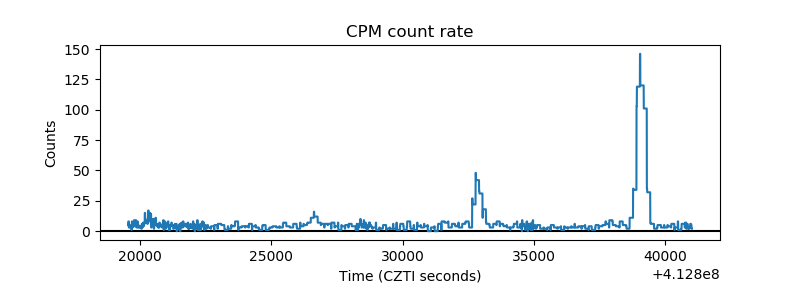 |
| CZT Counter | 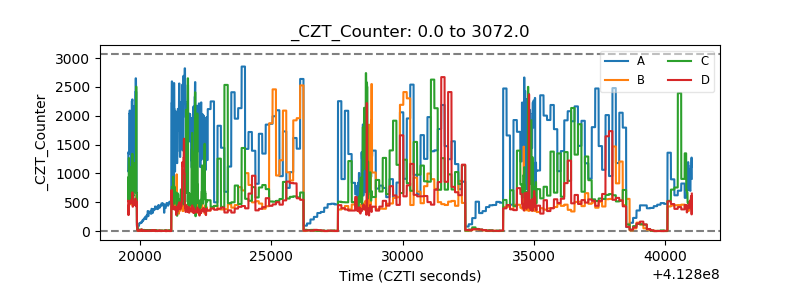 |
| +2.5 Volts monitor | 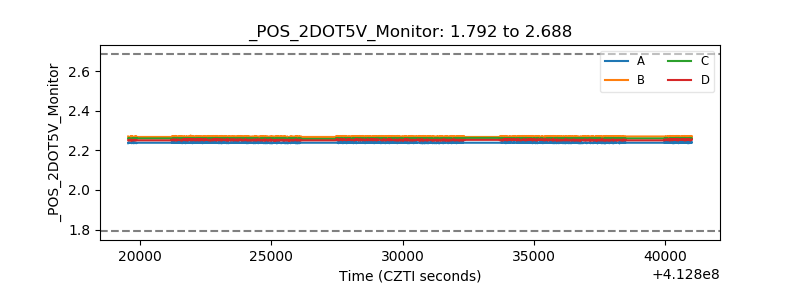 |
| +5 Volts monitor | 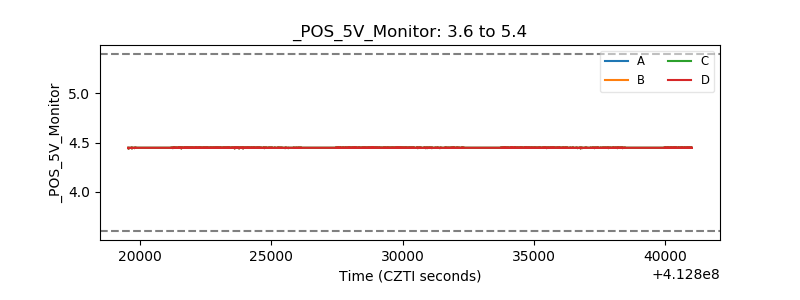 |
| _ROLL_ROT | 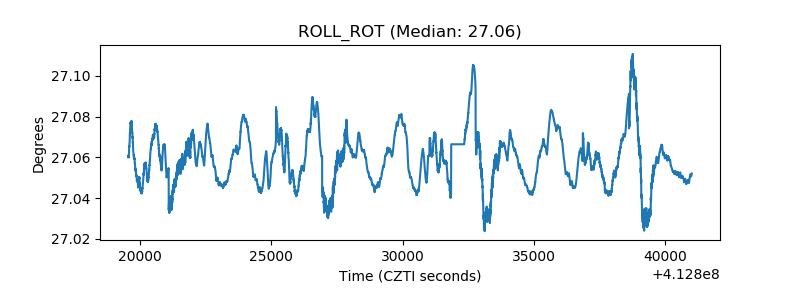 |
| _Roll_DEC | 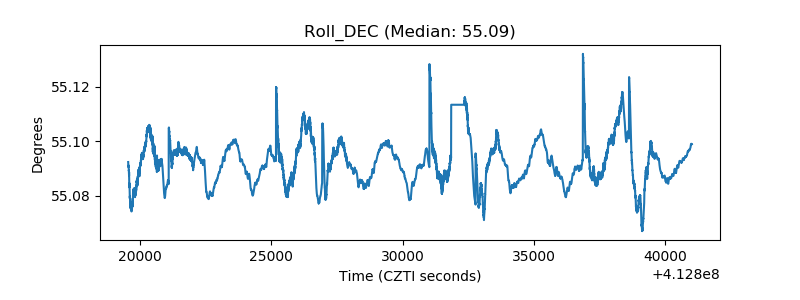 |
| _Roll_RA | 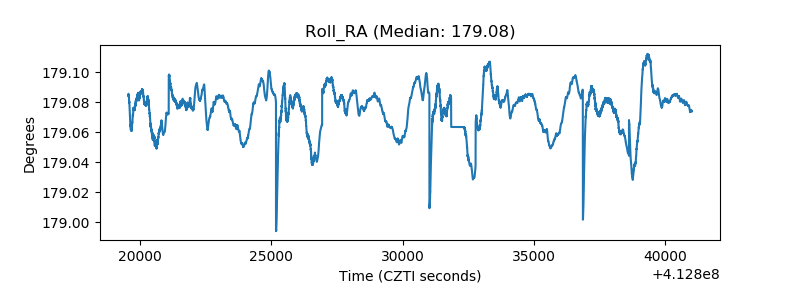 |
| Veto Counter | 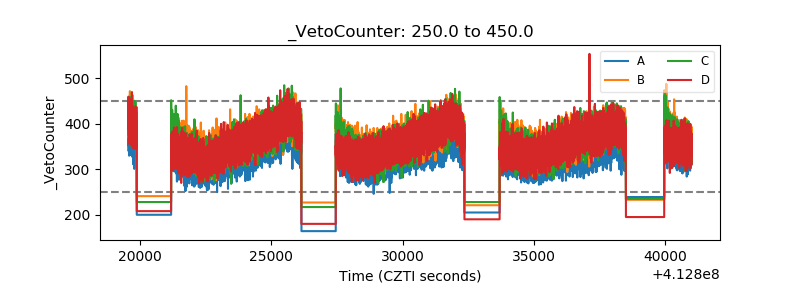 |